Abstract
Cetuximab is a well-characterized chimeric monoclonal antibody (mAb) composed of Fv regions of a mouse anti-epidermal growth factor receptor (EGFR) antibody with human IgG1 heavy and kappa light chain constant regions. This antibody binds to the extracellular domain III of the EGFR and is used to treat metastatic colon and other head and neck cancers. Cetuximab has a unique glycosylation pattern, with glycosylation sites at the Fab region, resulting in increased structural complexity. Indeed, François et al.1 conducted a comprehensive charge heterogeneity and glycosylation analysis using capillary zone electrophoresis-mass spectrometry (CZE-MS) and found various Fc/2 and F(ab')2 variants and several other glycoforms, including several sialic acids.
Simpler analytical technologies with optical detection, such as capillary isoelectric focusing (cIEF) using intact and selective digestion approaches, might offer a convenient strategy to overcome this complexity and study the charge heterogeneity of cetuximab. This technical note demonstrates the charge heterogeneity separation of intact cetuximab and its subunits after digestion using FabRICATOR. This cysteine protease cleaves the antibody below the hinge region to generate F(ab′)2 and Fc fragments. The intact and digested samples were analyzed using a multi-capillary platform on which various conditions can be screened in parallel, saving time and avoiding potential profile changes due to sample stability.
Key features of the cIEF analysis of cetuximab using the BioPhase 8800 system
- High-resolution: Detection of 9 major and 4 minor cetuximab species using the BioPhase 8800 system
- Fast characterization: Multiple sample preparations and blank controls can be analyzed in parallel, saving development time
Introduction
Protein therapeutics are a class of molecules that include traditional mAbs, new modalities of mAbs with Cetuximaba fusion protein, and cell and gene therapy products. There is a different set of analytical characterization challenges with every molecule type. One such challenge is the charge heterogeneity characterization that aids in assessing possible variants in the amino acid sequence and post-translational modifications (PTM). These changes can be detected by cIEF.
cIEF is a robust, reproducible and high-precision technique to characterize the charge heterogeneity of therapeutic recombinant proteins. Typically, cIEF is conducted in 2 steps that include focusing and mobilization. In the focusing step, the proteins, pI markers and a mixture of ampholyte molecules move toward their isoelectric point, or the point at which their net charge is 0. At this stage, these molecules no longer move under the influence of the electric field. There are 2 strategies to move them past the detection point: hydrodynamic mobilization by applying pressure or chemical mobilization by weak acid-base titration.
Methods
Materials: The BioPhase Capillary Isoelectric Focusing (cIEF) kit (P/N: C30101), containing cIEF cathodic stabilizer, cIEF anodic stabilizer, cIEF gel, cIEF urea, cIEF anolyte, cIEF neutral capillary conditioning solution, cIEF catholyte, cIEF chemical mobilizer, cIEF formamide and CE-grade water, was from SCIEX (Framingham, MA). The BioPhase sample and reagent plates (P/N: 5080311), BioPhase sample plates (P/N: 5080313), BioPhase reagent plates (P/N: 5080314), BioPhase outlet plates (P/N: 5080315), BioPhase neutral capillary cartridge - 8 x 30 cm, 50 μm inner diameter (P/N: 5080119) and cIEF peptide marker kit (P/N: A58481) were from SCIEX. The Pharmalyte IEF carrier ampholytes, broad range 3-10 (P/N: 17-0456-01) were purchased from Cytiva. The Amicon Ultra-0.5 Centrifugal Filter Unit (P/N: UFC-501096) was from Sigma-Aldrich (St Louis, MO). FabRICATOR Lyophilized 2000 units enzyme (P/N: A0-FR1-020) was purchased from Genovis (Cambridge, MA).
Sample treatment before analysis: First, 2 mg/mL of cetuximab from Myonex was buffer exchanged and concentrated using the Amicon Ultra cell 10 following the manufacturer's guidelines.2 The protein concentration was determined using the 280 nm assay on NanoDrop from Thermofisher Scientific (San Jose, CA).
Sample digestion for middle-down analysis: The FabRICATOR enzyme was prepared according to the manufacturer’s instructions.3
Sample preparation for cIEF analysis: The preparation of the 4M urea-gel solution and the anodic and cathodic stabilizers were reconstituted following the instructions in the Capillary Isoelectric Focusing (cIEF) Kit for the BioPhase 8800 system application guide.4
The cIEF master mix contained 200 μL of 4M urea-gel solution, 25 μL of cathodic stabilizer, 3 μL of anodic stabilizer, 12 μL of Pharmalyte 3-10 and 2 μL of pI markers 10.0 and 4.1. To this mix, 20 μL of intact or FabRICATOR-treated cetuximab was added. This mixture was vortexed at maximum speed for 45 seconds to thoroughly mix all components. After a brief spin to collect the solution to the bottom of the tube, a 100 μL aliquot was transferred to each well of the sample plate of the BioPhase 8800 system.
Blank control: The same master mix composition described in the previous section was used for the blank, using 2 units of the FabRICATOR enzyme.
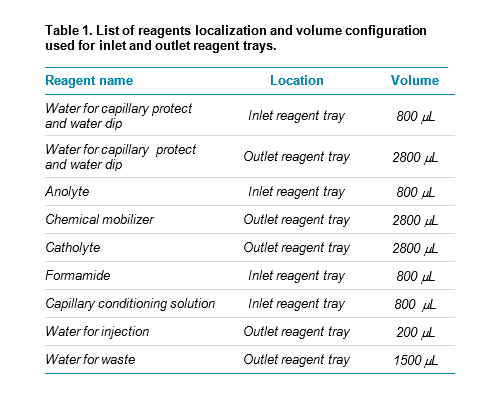
Preparation of sample and reagent plates: Sample inlet plates contained 100 μL of the sample. The sample outlet plate contained 2 mL of water. The reagent inlet and outlet plates contained the reagents and volumes specified in table 1.
Results and discussion
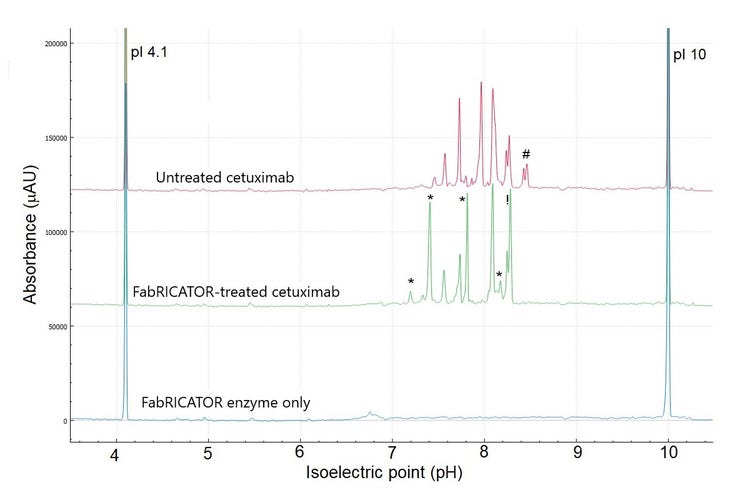
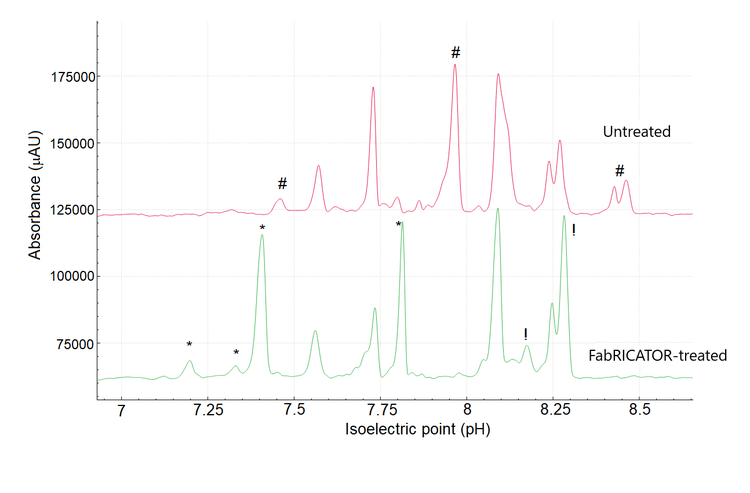
Intact and enzymatically digested cetuximab have been previously analyzed by LC-MS and by icIEF with UV and MS detection. These analyzes revealed the substantial microheterogeneity of cetuximab and its unique glycosylation patterns in the Fc and Fab regions.5-9 Figure 1 demonstrates the overlay of 3 cIEF separations. The bottom trace is the control blank of FabRICATOR enzyme at a concentration of 2 units. The same concentration was used to digest cetuximab to ensure no overlap between a peak of FabRICATOR enzyme and cetuximab. The top and middle trace correspond to the untreated and FabRICATOR-treated cetuximab samples, respectively.Cetuximab
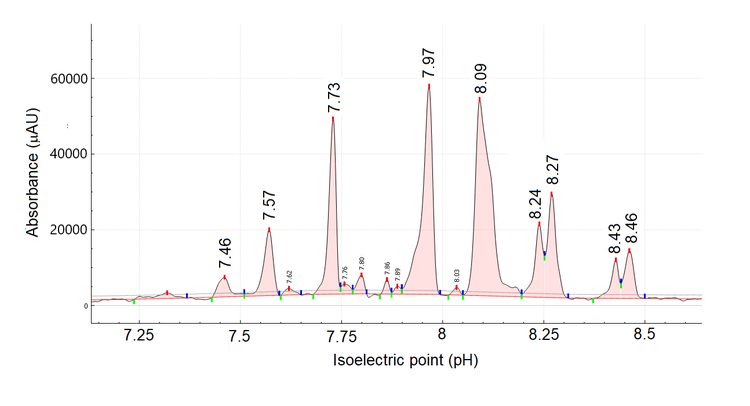
Figure 2 shows a zoomed-in view of the high-resolution cIEF separation of untreated cetuximab. Overall, the pI values ranged from 7.46 to 8.46, corroborating Bones' findings using cation exchange chromatography-mass spectrometry7 There is an agreement in the literature1,6,7 that cetuximab has 8 isoforms. The high-resolution and sensitivity of the BioPhase 8800 system allowed the detection of 9 major species with 4 potential minor species. These results suggest that cetuximab might have 5 more species than is commonly reported by the literature.5-9
To investigate the nature of the charge heterogeneity and to simplify the overall cIEF profile (Figure 3), cetuximab was subjected to enzymatic treatment using the FabRICATOR enzyme.
Cetuximab is a unique mAb because both the F(ab′)2 and Fc fragments carry a N-glycosylation site. Therefore, peaks should be displaced, corresponding to the formation of these fragments with their respective PTMs.
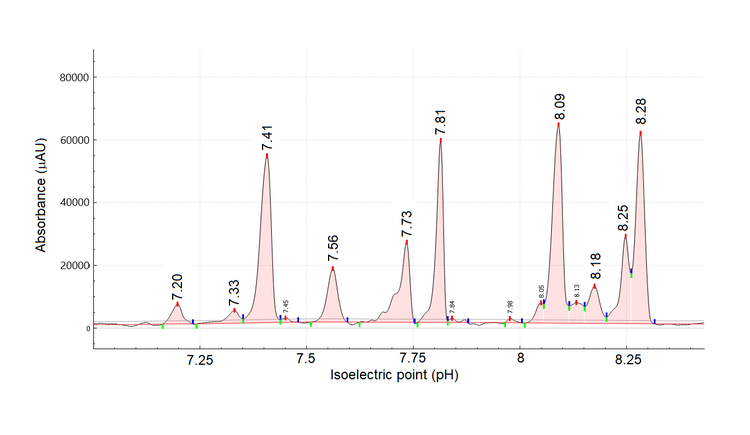
The 2 most basic peaks marked with # with pI 8.43 and 8.46 in the untreated sample are likely the heavy chain C-terminal lysine variants, which disappeared upon digestion. In the treated sample, the change in the shape of the peak at pI 7.73 (Figure 3) might indicate the formation of the Fc fragments, which have a theoretical pI of 7.74, according to Leize-Wagner.9 Similarly, the appearance of the peak at pI 7.81 could be indicative of the formation of F(ab')2 fragments, which have a theoretical pH of 7.78, according to Leize-Wagner.9
Although data in the literature supports the observations found in this work, future experiments are underway using cIEF-MS to further characterize such complex profiles for both untreated and FabRICATOR-treated samples.
Conclusion
- The superior resolution and sensitivity capabilities of the BioPhase 8800 system allowed for the high-resolution cIEF separation of cetuximab
- Eight separations in parallel allowed for the fast and reliable characterization of untreated and FabRICATOR-treated cetuximab
- The change in the cIEF profile of cetuximab after digestion using the FabRICATOR enzyme revealed modifications to its structure, confirming the findings in the literature and solidifying cIEF as a routine technique alongside other analytical techniques such as mass spectrometry
References
- M. Biacchi, R. Gahoual, N. Said, A. Beck, E. Leize-Wagner, and Y-N. François, Glycoform Separation and Characterization of Cetuximab Variants by Middle-up OffLine Capillary Zone Electrophoresis-UV/Electrospray Ionization-MS. Anal. Chem. 2015, 87, 12, 6240–6250.
- Amicon ultracel buffer exchange and concentration protocol.
- FabRICATOR instructions for use.
- Capillary isoelectric focusing kit for BioPhase 8800 system.
- G. Hanck-Silva, L. N. F. Trevizan, R. Petrilli, F. Tita de Lima, J. O. Eloy and M. Chorilli; A Critical Review of Properties and Analytical/Bioanalytical Methods for Characterization of Cetuximab; Critical Reviews in Analytical Chemistry, 50:2, 125-135.
- J. Dai and Y. Zhang; A Middle-Up Approach with Online Capillary Isoelectric Focusing/Mass Spectrometry for InDepth Characterization of Cetuximab Charge Heterogeneity; Anal. Chem. 2018, 90, 14527−14534.
- F. Füssl, A. Trappe, S. Carillo, C. Jakes, and J. Bones; Comparative Elucidation of Cetuximab Heterogeneity on the Intact Protein Level by Cation Exchange Chromatography and Capillary Electrophoresis Coupled to Mass Spectrometry; Anal. Chem. 2020, 92, 5431−5438.
- D. Ayoub, W. Jabs, A. Resemann, W. Evers, C. Evans, L. Main, C. Baessmann, E. Wagner-Rousset, D. Suckau and A. Beck; Correct primary structure assessment and extensive glyco-profiling of Cetuximab by a combination of intact, middle-up, middle-down and bottom-up ESI and MALDI mass spectrometry techniques; mAbs 5:5, 699–710; September/October 2013.
- Y.-N. François, M. Biacchi, N. Said, C. Renard, A. Beck, R. Gahoual, E. Leize-Wagner.. Characterization of Cetuximab Fc/2 dimers by off-line CZE-MS. Analytica Chimica Acta, 2016, 908, pp.168-176.