Introduction
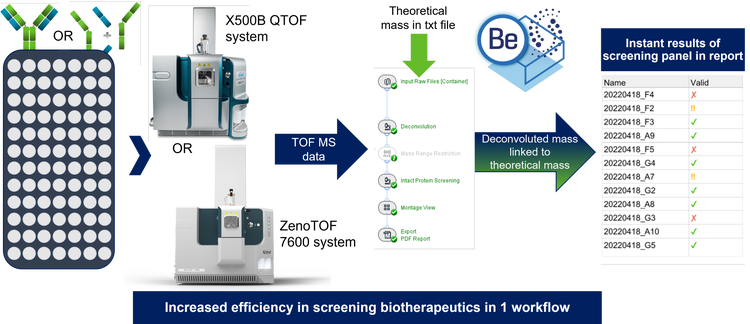
In this technical note, a workflow for high-throughput (HT) screening of intact and subunit masses for identification purposes of candidate biotherapeutic proteins using Biologics Explorer software is showcased.
Liquid chromatography coupled to MS (LC-MS) instrumentation is at the forefront of biopharmaceutical development processes, enabling researchers to identify, characterize and investigate dozens of different candidates to meet the growing demand for biotherapeutics. Although QTOF MS offers excellent sensitivity and mass accuracy, perfectly suited for the identification of intact and subunit proteins, data analysis is often a bottleneck. Laborintense, non-automated data analysis, such as, file-by-file deconvolution and matching to theoretical sequence information, pose challenges for MS utilization in early development protein screening. As a result, MS adoption is more focused on late early-development stages, after candidates had been narrowed down by other methodologies, providing less qualitative information. Being able to close the data processing gap can improve informed decision making and reduce the risk of not pursuing promising biotherapeutic candidate proteins.
Here, the challenges of LC-MS data processing of early development protein screenings are addressed using Biologics Explorer software. Intact and subunits of several monoclonal antibodies (mAb) were used to investigate the suitability for molecular weight assessment of different potential candidates. The import of a vast number of data files, automatic deconvolution and intuitive reporting with minimal user input offer a solution to existing processing challenges. In addition, transparency is provided by access to all data processing steps as needed.
Key features of the protein screening workflow
- Increased efficiency in screening of biotherapeutic proteins on intact and subunit level through a simple HT workflow set-up
- Minimal user input to screen hundreds of biotherapeutic candidates in a single, efficient processing step
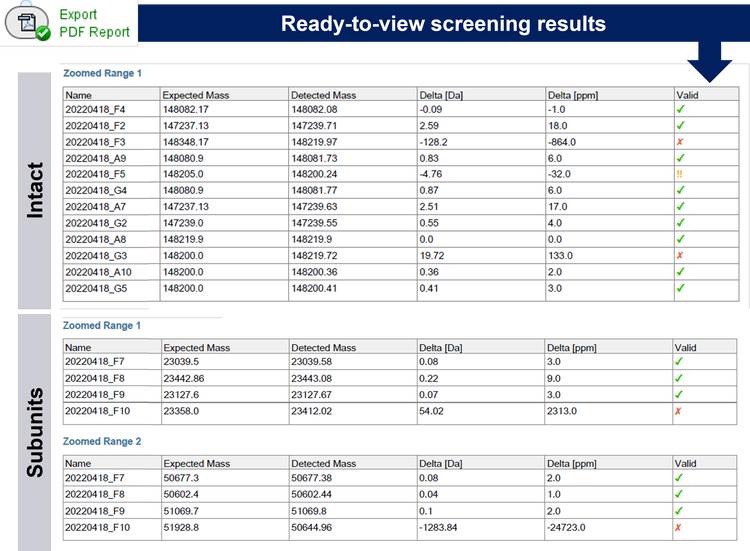
- Easy-to-read, visually supported report outputs facilitate decision making in fast-paced biopharma environments
Methods
Sample preparation: Candidate biotherapeutics were diluted in 50mM Tris to a working concentration of 0.25 μg/μL. For subunit analysis, 150 μL denaturing reagent (7.2M Guanidine in 50mM Tris, pH 7-8) was added to 50 μL sample and vortexed. DTT was added to a final concentration of 100mM and mixture was incubated at 60ºC for 30 mins. Samples were diluted with 0.1% formic acid by a factor of 2 and transferred into vials. For intact analysis, mAbs in working concertation were transferred to the vials.
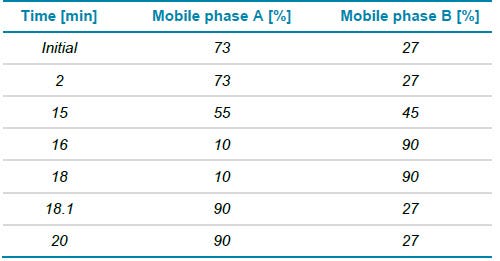
Chromatography: For reversed-phase liquid chromatography (RPLC) of intact and subunit samples, a Waters BioResolveRP, mAb Polyphenyl, column (2.1 mm x 50 mmx 2.7 μm) was used. Flow rate was set to 0.25 mL/min, 2 μL of sample was injected and the mobile phase A consisted of 0.1% formic acid in water and mobile phase B of 0.1% formic acid in acetonitrile. Table 1 shows gradient for intact and subunit analysis.
From data files to results in an efficient manner
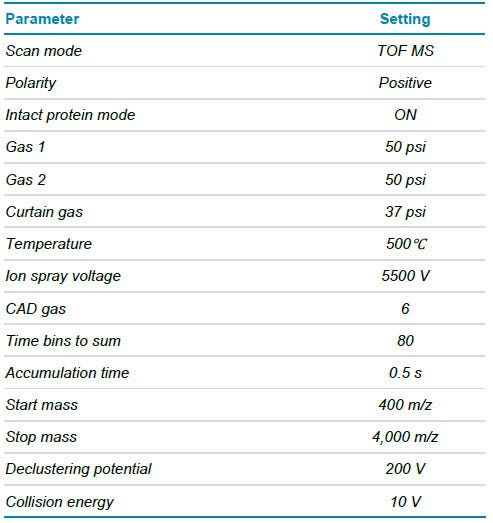
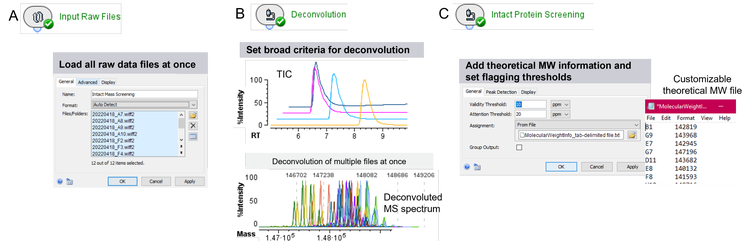
The mAb samples mimicking different biotherapeutic candidates were loaded into 96-well plate and TOF MS data were acquired using a generic LC-MS method setup. The LC and MS methods allow for the detection of different mAb species and their subunits with high data quality, skipping sample-specific optimization to address the need for fast and efficient data acquisition. To understand if the proteins were expressed as desired, raw TOF MS data needed to be deconvoluted and obtained molecular weights (MW) matched against theoretical sequence information. To initiate the processing workflow of MW determination and matching, all data files (each corresponding to a different protein sample) were imported to Biologics Explorer software at once (Figure 2A). For processing with the goal of molecular weight determination, broad criteria were defined for the retention time (RT) range used for automatic peak detection, the deconvolution and for the MW output (Figure 2B). Since different proteins will have different hydrophobicities depending on their sequences and modifications, RTs are likely to shift. Automatic peak detection within a broad RT range is therefore critical to ensure an accurate deconvolution. Similarly, the MW is likely to be different between different protein samples. Defining a wide mass range for the deconvolution output ensures the applicability for the workflow for many different samples. To automatically determine the MW of each candidate protein, MS spectra within the detected peaks were averaged and deconvoluted for all candidates at once maintaining consistency in deconvolution (Figure 2B, bottom). The matching of the resulting MW to theoretical sequences is enabled through a text file, linking the MW output of each data file to a specific theoretical mass (Figure 2C). In addition, 2 thresholds for the flagging of results can be set to distinguish between marginal and significant differences between expected and experimental masses.
Transparency in data analysis and results
The HT workflow is optimized to speed up the screening and decision-making process through user-friendly layouts, single- button executions and smart visual outputs. However, there might be the need to investigate a sample further, especially if a significant deviation from the expectation was found. The workflow therefore provides the option for data interrogation at each processing step for full transparency. All data is directly accessible in the software to facilitate any needed troubleshooting.
As an example, the data for the sample in well F3 were investigated (Figure 4). The red cross from the report of the rapid screening for sample F3 (Figure 3 and Figure 4A) is immediately capturing attention, reducing time spent on samples, which passed set criteria. A quick examination of the table in the report shows a ~128 Dalton difference between the expected mass and the detected mass of sample F3. Representative raw data and deconvoluted data were subsequently used to interrogate the data quality (Figure 4B): A peak with great S/N in the TIC indicates successful injection into the LC-MS system.
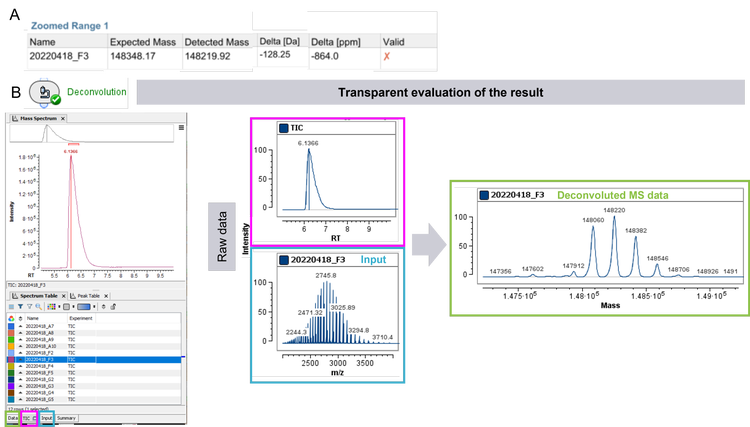
Furthermore, a charge state envelope with baseline separation of proteoforms was achieved for the TOF MS data. The derived deconvoluted data shows as well a common pattern of a mAb. One explanation for the mismatch between expected and detected, deconvoluted mass could be a clipping event of an amino acid, such as lysine, leading to a lower detected MW than the expected one. At this step, a decision whether to continue investigating the sample or focusing on the samples which passed the criteria can be made. To investigate the theory of a clipping event, further in-depth analysis with a peptide mapping analysis can be performed. With that approach the sequence deviations and modification(s) of the candidate biotherapeutic can be investigated.
In summary, biopharmaceutical development can be taken one step further by enabling fast and efficient LC-MS-based screening of intact and subunit proteins with Biologics Explorer software. The user-friendly workflow closes current data analysis gaps, while allowing a transparent data analysis experience. Equipped with visual interpretation of results and customizable report options, the HT workflow supports fast-paced decision-making processes where high numbers of candidates need to be screened to meet the demand in analytics of biotherapeutics.
Conclusion
- HT screening of candidate biotherapeutics in 96-well plate settings was achieved at intact and subunit level with a simple and effective set-up in Biologics Explorer software leveraging accurate mass QTOF MS data
- Automatic batch processing and deconvolution of candidates within wide mass ranges and batch reporting allow routinization of QTOF MS-based screening of proteins during early development
- Smart visualization icons offered by the workflow provide easy-to-read reports and fast decision making for hundreds of candidate molecules