:true:
The Power of Precision
false
us
ZenoTOF 7600 system
X500R system
X500B system
View all
SelexION device
SCIEX 7500 system
SCIEX Triple Quad 6500+ system
SCIEX 5500+ system
QTRAP 6500+ system
QTRAP 4500 system
Citrine system
4500MD system
Jasper system
View all mass spectrometers
Intabio ZT system
Echo MS system
Biologics Quant solution
Biotransform solution
MPX 2.0 High Throughput Multiplexing system
View all integrated solutions
BioPhase 8800 system
CESI 8000 Plus system
PA 800 Plus system
P/ACE MDQ Plus system
GenomeLab GeXP system
View all capillary electrophoresis
Advance your research with front-end instruments designed to help you realize the full power of your mass spectrometer. SCIEX has the broadest portfolio of ESI-MS front-ends that can facilitate various flow rates, sample requirements and sensitivities. No one else offers the entire range of analytical flow, microflow, nanoflow LC-MS and even ultra-low flow CESI-MS.
ExionLC AE system
ExionLC 2.0 series
Micro HPLC columns
M5 MicroLC system
View All
Ultra-low Flow CESI-MS
View all front-end HPLC MS
Differential mobility spectrometry (DMS) and ion mobility spectrometry are analytical techniques used to separate ions based on their gas phase mobility. Multiple types of ion mobility devices exist, such as drift tubes, traveling wave, and high-field asymmetric waveform devices. Learn how you can separate yourself with Differential Ion Mobility.
The latest ion sources from SCIEX enable enhanced sensitivity and robustness with greater desolvation range across all MS platforms, from Triple Quad to QTRAP and QTOF.
Turbo V ion source
OptiFlow Turbo V ion source
OptiFlow Interface
View all ion sources
vMethod applications are pre-configured and verified LC-MS/MS methods that reduce the need for method development – significantly cutting the time, effort and money to deploy a new assay. Every vMethod provides method conditions, recommended sample prep, LC and MS conditions, and details for applicable MS/MS library databases for key applications.
AA45/20 1.0
aTRAQ
Illicit drugs
Acrylamide
Allergens
Antiobiotics/veterinary drugs
Cannabinoids
Illegal dyes
Melamine
Mycotoxins
Pesticides
Industrial chemicals (bisphenol)
Industrial chemicals (ethanolamines)
Pesticides (herbicides)
Pesticides (Polar)
Pharmaceutical and personal care products (PPCPs)
Peptide and protein bioanalysis
Routine biologics characterization
Benzodiazepines
Blood screening
Drugs of abuse
Etg and ets
Nicotine
THC-COOH
Urine screening
Explore vMethod applications
Software downloads
Software activation
Software support policy
Software support plans
Software feature request portal
Software partners
SCIEX OS software
Biologics Explorer software
Cliquid software
DiscoveryQuant software
Molecule Profiler software
OneOmics suite
View all software
In addition to being your trusted partner for the precise detection and quantitation of molecules, SCIEX offers accessories for your lab to support your work.
Mass spectrometry accessories
High resolution and QTRAP libraries can dramatically enhance the quality of your analysis, giving you much improved confidence in your data. With a comprehensive library at your fingertips, you can easily create methods and process targeted and non-targeted screening data on your complex samples, faster and easier than ever before.
All in one library
SCIEX all-in-one HR-MS/MS library with NIST 2017
Antiobiotic Llbrary
Flurochemical library
Forensic library
Mycotoxin library
Natural products
Pesticide library
Wiley Libraries
Antibiotic library
Meta library
Explore the library selector tool
Boost the performance of your mass spectrometer and improve sensitivity, productivity, and data precision. iChemistry Solutions are the world's only reagents and consumables that are custom designed with your success in mind.
RNA 9000 Purity & Integrity kit
aTRAQ kit for amino acid analysis of hydrolysates
aTRAQ kit for amino acid analysis of physiological fluids
Protein CE-SDS Purity Analysis kit
MS calibration kits
CZE rapid charge variant analysis kit
BioPhase Fast Glycan Labeling and Analysis kit
iTRAQ reagent
mTRAQ reagent
View all consumables
QTOF – Quadrupole Time of Flight
QTRAP® – Triple Quad Linear Ion Trap
SWATH® – Data Independent Acquisition
SelexION® – Differential Mobility Separation
MicroLC – Microflow Chromatography
Ultra Low-Flow CESI-MS Technology
iCIEF-MS Technology
Nominal Mass LC-MS-MS
Acoustic Ejection Mass Spectrometry
View All Technology
ADME and DMPK
Biomarker quantitation
Cell therapy
CRISPR/Cas9 analysis
Viral vector characterization
Biomarker discovery
High-throughput mass spectrometry
Metabolite identification
Targeted protein degraders and PROTACs
Extractables and leachables
Pharma impurities
Residual nucleic acid analysis
Lipid nanoparticles and non-viral carrier
Messenger RNA analysis
Plasmid and DNA analysis
Synthetic oligonucleotide analysis
ADC analysis
Cell line analysis
Charge heterogeneity analysis
Glycan analysis
Intact protein analysis
Multi-attribute methodology
Peptide mapping analysis
Subunit mass analysis and middle-down
View all Biopharma and pharma
Clinical research
Clinical diagnostics
Clinical Mass Spec Operators
Clinical Method Developers
Clinical Lab Managers
View All Clinical
PFAS
Pesticides & herbicides
PPCP
Disinfection by-products
Soil and biota
Ethanolamine
Synthetic polymers
Exposome
Suspect screening
Nanomaterials
View All Environmental Testing
How do you protect your reputation and meet today’s global food safety standards? Whether you are a commercial lab or a food manufacturer, the quality of your food testing data is vital to your business. SCIEX solutions help you meet maximum residue limits (MRLs) with high-quality data that you can genuinely count upon. With a portfolio of applications, your lab can quickly and easily react to diverse market needs.
Pesticide Testing
Mycotoxins Testing
Antibiotics Testing
Potency Testing
Mycotoxin Testing
Terpenes Profiling
Meat Speciation Testing
Food Fraud Analysis
Food Adulterant Testing
Food Dye Testing
Food Omics
Allergen Testing
Ingredient Authenticity & Profiling Analysis
Packaging & Food Contact Substance Analysis
View All Food and Beverage Testing
How do you ensure the integrity of your results in an industry that is never constant? By accurately detecting even the smallest compound angles you can deliver evidence that stands. SCIEX forensic analysis solutions deliver fast, highly accurate data across a multitude of compounds and biomarkers, from the known to the new and novel.
Forensic toxicology
Homeland security (coming soon!)
Cannabis and hemp potency testing
Doping control
View All Forensic Testing
Discovery Proteomics
Next-Generation Proteomics
Targeted Proteomics
Untargeted Lipidomics
Targeted Lipidomics
Untargeted Metabolomics
Targeted Metabolomics
Metabolic Flux Analysis
Gene Expression Analysis
DNA Sequencing
Genotyping and SNP Analysis
STR Analysis
AFLPs
View All Life Science Research
The SCIEX Now Learning Hub offers the most diverse and flexible learning options available, with best-inclass content that helps you to get the most out of your instrument and take your lab to the next level. Available personalized learning paths based on the latest memory science ensure better knowledge retention, and automated onboarding and enrollment means you’ll get up and running faster.
SCIEX Now Learning Hub offers the most diverse and flexible learning options available, with best-in-class content that helps you to get the most out of your instrument and take your lab to the next level. Available personalized learning paths based on the latest memory science ensure better knowledge retention, and automated onboarding and enrollment means you’ll get up and running faster.
SCIEX Learning Manager provides you with the infrastructure to assign, monitor and report on your staff's competency through a single digital platform. Effectively manage the training process for new hires, ensure continuous staff development and access information with a single log-in to your SCIEX account.
You can browse, filter, or search our extensive list of training offerings. Choose from over 100 self-paced eLearnings or search for an instructor-led course near you. Once you select the course you want to take, you will be directed to Learning Hub for enrollment (login required).
Login to SCIEX Now Learning Hub
Success Programs at Your Site
Online Course Catalog
Clinical Knowledge Center
Application Scientist Training at Your Site
China
Europe
German CE Courses
India
Japan
Korea
North America
UK
Visit all Training
Support cases
SCIEX Now Learning Hub
Instruments
Manage my instruments
Registered software
Activate software
Resource library
My notifications
Request support
Course catalog
SCIEX Store
SCIEX Now New Feature Request
Visit your SCIEX Now™ Dashboard
Declaration of conformance
Safety data sheets
Certificates of analysis
View All regulatory documents
Customer documents
Software and IT services
Compliance services
Lab optimization
Customized training
Relocation services
LC-MS service plans
Protect Plus Suite for your new LC-MS
CE service plans
Clinical service plans
StatusScope remote monitoring
Software accelerator program
Premium access content
Academic partnership program
Academic partners
View all partnership programs
Join the SCIEX community today to interact with your peers, share and exchange ideas, develop your knowledge, stay up-to-date with the latest products, post insights and questions, comment on others and receive support. This community is designed to help you, our customers, move science forward and get the answers you need. We’re committed to engaging with and listening to you, to create the best customer experience possible and to contribute to the success of your work.
Biopharma
Clinical
Environmental / Industrial
Food and Beverage
Forensics
Life Science Research
Pharma
Technology
Knowledge Base Articles
Course Catalog
Software Downloads
Request Support
SCIEX Now Feature Requests
Software Feature Requests
Newsletter Archive
Featured Content
FAQs
View All Community
About SCIEX
About Danaher
Customer Profiles
Echo® MS Center Of Excellence
Our History
Our favorite papers
Meet our executives
Career opportunities
Contact us
Press releases
In the news
Awards
Sustainability
You've got questions. We've got experts who can help. Contact us to find out more, talk to a specialist, explore our solutions or get expert support.
Talk to a specialist
Request more information
Request a quote
SCIEX success network
Frequently asked questions
SCIEX community
Request hosted catalog
Request punchout
Global public relations
508-782-9484
Country/Region Canada Mexico United States
Country/Region Argentina Brazil Chile Colombia Costa Rica Ecuador El Salvador Guatemala Peru Uruguay Venezuela
Country/Region Germany Albania Austria Belgium Bosnia and Herzegovina Bulgaria Croatia Cyprus Czech Republic Denmark Estonia Finland France Germany Greece Hungary Ireland Italy Latvia Lithuania Luxembourg Macedonia Montenegro Netherlands Norway Poland Portugal Romania Serbia Slovakia Slovenia Spain Sweden Switzerland United Kingdom
Country/Region Bangladesh Brunei Darussalam Cambodia 中国 Hong Kong India Indonesia 日本 한국 Singapore Sri Lanka Taiwan Thailand Viet Nam
Country/Region Bahrain Iran Iraq Israel Jordan Kuwait Lebanon Oman Pakistan Palestine Qatar Saudi Arabia Syria Turkey United Arab Emirates Yemen
Country/Region Algeria Angola Botswana Burundi Egypt Ethiopia Kenya Liberia Libya Morocco Rwanda South Africa Tunisia Uganda United Republic of Tanzania Zambia Zimbabwe
Country/Region Armenia Azerbaijan Belarus Georgia Kazakhstan Kyrgyzstan Moldova Russia Tajikistan Turkmenistan Ukraine Uzbekistan
Country/Region Australia Micronesia New Zealand
AB Sciex is doing business as SCIEX. © 2010-2018 AB Sciex. The trademarks mentioned herein are the property of the AB Sciex Pte. Ltd. or their respective owners. AB SCIEX™ is being used under license. Beckman Coulter® is being used under license. Product(s) may not be available in all countries. For information on availability, please contact your local representative. For research use only. Not for use in diagnostic procedures.
Download Tech Note (PDF)
Featuring an icIEF-UV/MS workflow using the Intabio ZT system from SCIEX
Scott Mack, Zhichang Yang, Rashmi Madda, Jingwen Ding, Zoe Zhang, Rita Nichiporuk, and Maggie Ostrowski SCIEX, USA
This technical note demonstrates a novel integrated workflow using the Intabio ZT system. This innovative system offers direct chip-based integration of imaged capillary isoelectric focusing (icIEF) with mass spectrometry (MS), which affords confident characterization of proteins and reliable quantitation of charge variants by icIEF-UV/MS. Further, the streamlined icIEF-UV/MS platform significantly reduces the time to results from weeks or longer to approximately 1 hour for routine samples, compared to ion exchange chromatography (IEX) with fraction collection.
Recombinant monoclonal antibodies (mAbs) have become an important class of biotherapeutics to treat a wide variety of diseases due to their high specificity, efficacy and flexibility.1 During the manufacturing process, heterogeneity of the mAbs could occur due to enzymatic cleavage and chemical posttranslational modifications (PTM).2 Many of these PTMs, including deamidation, C-terminal lysine truncation, glycation and sialylation, change mAb charge (and, thus, isoelectric point or pI).3 Characterizing the charge heterogeneity of mAbs is essential for critical quality attribute (CQA) assessment to ensure drug safety, efficacy and potency.4 In addition, process changes can happen during manufacturing, which poses a significant concern for biopharma therapeutic development. Process changes can result in PTMs that impact product quality.
cIEF offers a high-resolution separation of protein charge variants, including compounds with similar pI values.3 Therefore, cIEF is commonly used to monitor CQAs and product quality attributes (PQA). However, how to directly and rapidly identify and characterize different PTMs from these charge variant peaks in a single assay using iciEF-UV/MS data has been an unsolved problem for decades.
Figure 1. icIEF-UV/MS analysis on the Intabio ZT system. The Intabio ZT system directly integrates icIEF separation with a detection on the ZenoTOF 7600 system.
The Intabio ZT system aids in solving this challenge. It directly integrates icIEF separation with a ZenoTOF 7600 system, enabling direct coupling of icIEF charge variant analysis, UV quantitation and high-resolution mass spectrometry to identify intact proteins.
The UV results provide relative quantitation of the charge variant peaks. After focusing, separated charge variants are chemically mobilized and introduced to the MS through an on-chip electrospray ionization emitter for analysis without compromising separation efficiency and resolution. The icIEF-UV profile is correlated to the MS base peak electropherogram (BPE) for peak assignment and annotation.
The Intabio ZT system in combination with ZenoTOF 7600 system confidently identified numerous attributes, including deamidation and low-abundance glycation events. The total turnaround time for routine samples is approximately 1 hour, which offers significant time savings compared to the conventional LC IEX workflow and fraction collection followed by MS identification. Since all data are collected in a single MS and optical analysis, data integrity is superior to fraction collection for GLP considerations.
Equipment: Intabio ZT system (SCIEX) and Intabio ZT cartridge (SCIEX, P/N 5088248) were used for the separation of NISTmAb and its charge variants. MS detection was performed on the ZenoTOF 7600 system (SCIEX, P/N 5080337) equipped with OptiFlow interface components (SCIEX, P/N 5084645).
Chemicals and reagents: The Intabio system – Electrolyte and Mobilizer kit (P/N 5088205) was used for anolyte, catholyte and mobilizer. Anolyte and mobilizer were used undiluted. The stock catholyte solution was 1% and diluted to 0.25% for use in the reagent drawer. The stock anolyte is 1% formic acid and catholyte is 1% diethylamine. The mobilizer is composed of 25% acetic acid, 25% acetonitrile and 50% water.
A 500mM cathodic spacer solution containing free base Larginine (Arg) (purity ≥ 98.5%, Sigma-Aldrich, P/N A8094-25G) was prepared by dissolving 0.870 mg of Arg powder into 10 mL of Milli-Q water. The electrolytes and cathodic spacer solutions were stored at room temperature. pI markers (CanPeptide) were individually dissolved in Milli-Q water at 5 mg/mL.
Prior to icIEF-UV/MS analysis, NISTmAb was desalted with a Zeba Spin Desalting Columns, 7K MWCO, 0.5 mL(Thermo Fisher Scientific, P/N 89882).
icIEF-UV/MS analysis: MS signal was optimized before sample analysis using a solution containing 100 µg/mL NISTmAb in mobilizer solution. The NISTmAb solution was infused through the Intabio ZT cartridge with 100-150 mbar of pressure, and electrospray was achieved into a ZenoTOF 7600 system with a tip voltage between 5000 and 5500 Volts. Nitrogen gas was applied between 60 to 75 psi to the on-chip integrated nebulization channels coplanar with the tip of the icIEF-UV/MS chip to achieve stable and robust ionization and sample entry to the MS.
Table 1. icIEF separation
Samples containing 250 µg/mL NISTmAb, 10 mM arginine, 1% Pharmalyte 3 to 10 (Cytiva, PN 17045601), 2.5% Pharmalyte 8 to 10.5 (Cytiva, PN 17045501), and 6.25 µg/mL peptide pI markers were vortexed and then degassed by centrifugation at 3900 rcf.
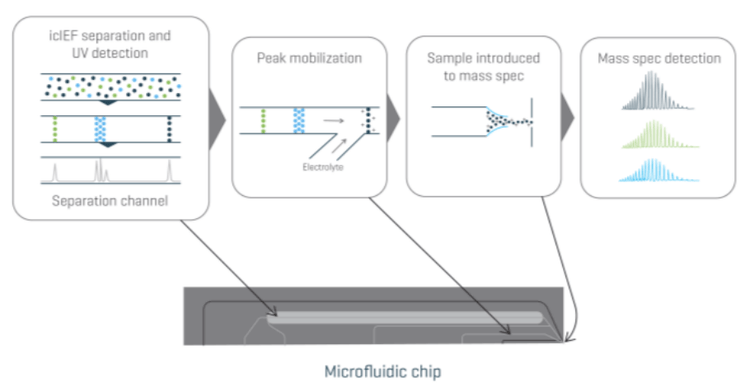
The streamlined process of icIEF-UV/MS analysis is illustrated in Figure 1. First, 70 psi of nitrogen was supplied to the internal nebulization channel within the Intabio ZT cartridge during the loading, focusing, and mobilization cycles of the icIEF-UV/MS separation process. After priming the channels within the Intabio ZT cartridge with either electrolyte solution or water, 50 µL of the sample was automatically loaded onto the separation channel using the autosampler. The icIEF separation was achieved using the parameters shown in Table 1. Absorbance measurements were collected at 1 Hz throughout the focusing and mobilization steps. The samples were introduced into the ZenoTOF 7600 system by a metered 2 µL/min flow of chemical mobilizer, and the data was acquired using parameters shown in Table 2.
Table 2. TOF MS parameters.
Data processing: UV profiles and mass spectra from the icIEFUV/MS analysis of NISTmAb were analyzed using the Biologics Explorer software. Each peak in the icIEF-UV profile was integrated to determine peak area and percent composition. Intact masses were estimated from the raw mass spectrum under each peak of the icIEF-MS profile utilizing a charge deconvolution algorithm with a mass range setting between 145,000 and 150,000 Da.
Figure 2. NISTmAb intact charge profiles. Panel A shows an icIEF-UV profile of charge variant separation, in the scale of the pI value (x axis) acquired from the Intabio ZT system. Panel B shows an MS base peak electropherogram (BPE) of mAb charge variants acquired from ZenoTOF 7600 system after icIEF separation.
Figure 3. Overlay of the intensity normalized deconvoluted intact mass spectrum of the 5 NISTmAb charge variants, showing the identity of the peaks detected in the icIEF-UV/MS analysis (Figure 2); the data analysis was performed by the Biologics Explorer software.
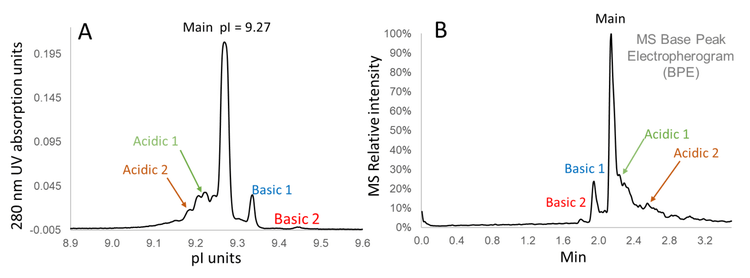
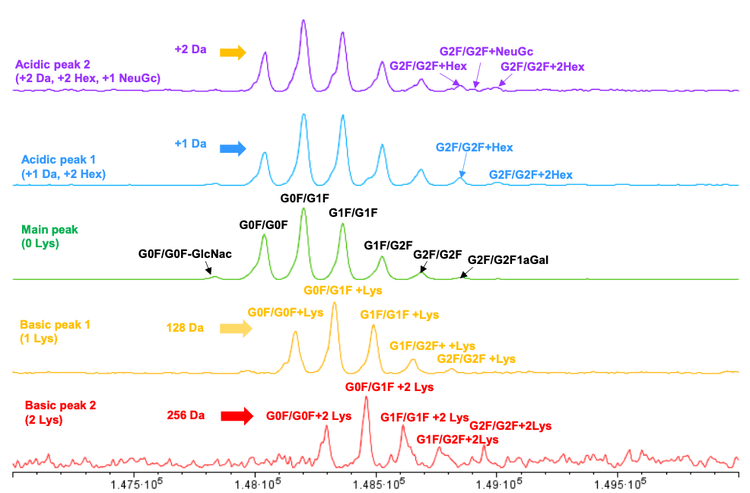
Figure 2 shows a separation profile of the charge variants of NISTmAb acquired with the Intabio ZT system coupled to ZenoTOF 7600 system. Panel A shows a 280-nm UV absorbance profile of NISTmAb charge variants separated by icIEF. Panel B is a MS BPE of the corresponding peaks after mobilization, electrospray and detection by MS. The separation profiles generated by icIEF-UV (once inverted) and icIEF-MS on the Intabio ZT system and ZenoTOF 7600 system, respectively, are similar. icIEF-UV profile shows separated peaks across the icIEF separation channel, whereas the MS data is acquired based on the time the charge variants are mobilized and electrosprayed into the mass spectrometer. Basic peaks of the icIEF-UV profile with high pI are introduced first into the MS system for analysis and therefore appear at earlier time points (left side of the MS BPE). The MS BPE shows that all the peaks observed from icIEF-UV profile were also detected by the MS system without compromising separation resolution. This result indicates that the separation efficiency of charge variants was well maintained after chemical mobilization. The entire focusing and separation only took 15 min, demonstrating the capability of high-throughput characterization of charge variants.
A detailed analysis of the charge variant peaks was performed on intact NISTmAb. Figure 3 shows the intensity normalized deconvoluted mass spectra of 5 charge variants from the NISTmAb sample. The basic peaks 2 and 1 charge variants show +256 and +128 Da mass increases compared to the main peak, which are respectively identified as C-terminal lysine variants.
Additional peaks above G2F/G2F at +162 Da intervals are observed in acidic peaks 1 and 2, identified as putative glycation. Masses that correspond to glycans with NeuGc sialic acid are observed in acidic peaks 2. A +1 Da mass shift was observed in acidic peak 1 and a +2 Da mass shift was observed in acidic peak 2 for proteoforms with G0F/G0F, indicating a high abundance of proteoforms with1 deamidation or 2 deamidation events in these 2 charge variants. Due to the excellent charge heterogeneity separation on the Intabio ZT system, neutral proteoforms, such as the glycosylation series, including lowabundance glycans such as G0F/G0F-GlcNAc, are readily measured by icIEF-UV/MS. In a follow-up technical note, we confirm the existence of glycation by performing the icIEFUV/MS analysis on a deglycosylated NISTmAb using the Intabio ZT system.
Figure 4. Results interface in the Biologics Explorer software.
Figure 4 shows an example of the analysis result using the Biologics Explorer software. The layout simultaneously includes the UV electropherogram, results summary, MS data, deconvoluted ion map results and raw MS data. On the top left panel, the UV electropherogram illustrating the isoelectric focusing separation of charge variants and the integration of identified peaks. Peaks identified in the icIEF-UV profiles (electropherogram table) and MS BPE (peak table) are separately listed in the bottom left panel with detailed annotations of the identified proteoforms in the annotations section. The top right panel presents the ion map (color image) and deconvoluted mass spectra of the peak selected in the left panel. The bottom right panel shows the peaks selected in the deconvoluted mass spectra, including peak intensities, retention time and method used for data analysis. This report summary demonstrates a comprehensive overview of a streamlined charge variant characterization using the Biologics Explorer software.