A comprehensive workflow to characterize deglycosylated NISTmAb using imaged capillary isoelectric focusing (icIEF)-UV/MS
Featuring an icIEF-UV/MS workflow using the Intabio ZT system from SCIEX
Rashmi Madda, Jingwen Ding, Mariam ElNaggar, Scott Mack, Maggie Ostrowski and Zoe Zhang
SCIEX, USA
Abstract
This technical note presents a comprehensive analysis of deglycosylated NISTmAb (dgNISTmAb) using a novel integrated icIEF-UV/MS workflow. This innovative Intabio ZT system offers direct chip-based integration of icIEF with mass spectrometry (MS), which affords the confident characterization of proteins and reliable quantitation of charge variants. The streamlined icIEF-UV/MS platform significantly reduces the time to obtain results from weeks or longer to approximately 1 hour for routine samples, compared to ion exchange chromatography (IEX) with fraction collection.1
Introduction
Monoclonal antibodies (mAbs) are complex biomolecules that are increasingly used as therapeutics. 2 mAbs can undergo various modifications during the manufacturing process, which can lead to heterogeneity. These modifications include post-translational modifications (PTMs)3 and chemical changes, such as glycosylation, deamidation, C-terminal Lys truncation and oxidation, that can alter mAb surface charge distribution and net charge (isoelectric points or pI). 4 In turn, these changes can affect the safety, efficacy and potency of the final product. Characterizing the charge heterogeneity of mAbs is therefore essential for critical quality attribute (CQA) assessment to ensure drug safety, efficacy and potency.5
cIEF offers a high-resolution separation of protein charge variants, including compounds with similar pI values.3 Therefore, cIEF is commonly used to monitor CQAs and product quality attributes (PQA). However, how to directly identify and characterize different PTMs from these charge variant peaks in a single assay in fast-paced biopharma development labs has been an unsolved problem for decades.
N-linked glycans can interfere with the confirmation of glycation in intact mAbs. In this technical note, the icIEF-UV/MS workflow was used to quickly and comprehensively characterize and identify the charge variants of dgNISTmAb in less than 1 hour (Figure 1).
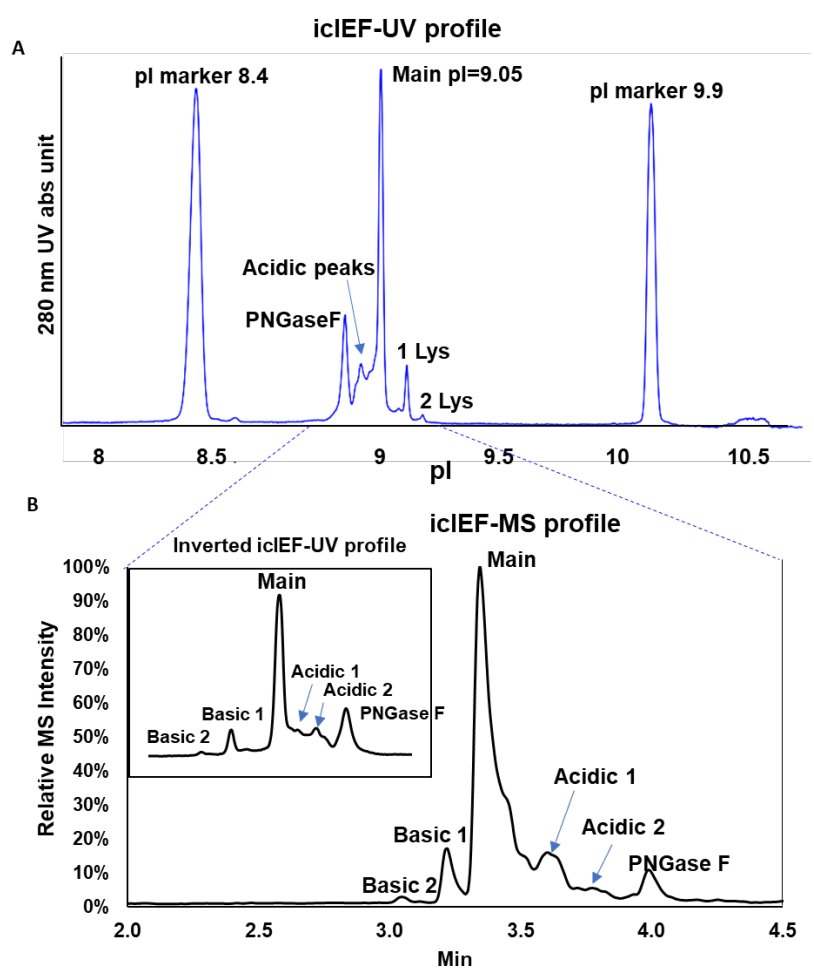
Figure 1. Confident charge variant peak identification using the icIEF-UV/MS platform. The upper panel shows the icIEF-UV profile for charge variants separation based on pI. The lower panel shows the inverted icIEF-UV profile and icIEF-MS profile of dgNISTmAb charge variants detected by high-resolution mass spectrometry using the ZenoTOF 7600 system after icIEF separation.
Key features of the icIEF-UV/MS workflow
- Seamless identification of charge variants with a microfluidic chip-based integrated icIEF-UV/MS technology. The Intabio ZT system is exclusively coupled to the ZenoTOF 7600 system
- Platform offers both rapid multi-attribute monitoring of intact biotherapeutics and comprehensive characterization by icIEF-UV/MS
- The 30-min sample analysis is significantly faster than conventional cIEF and IEX workflows requiring fractionation for the following identification.
- icIEF separation and UV quantitation correlate well with standard icIEF techniques
- Streamlined, intuitive data analysis software for rapid reporting and result sharing.
Methods
Equipment: Intabio ZT system (SCIEX) and Intabio ZT cartridge (SCIEX, P/N 5088248) were used for the separation of NISTmAb and its charge variants. MS detection was performed on the ZenoTOF 7600 system (SCIEX, P/N 5080337) equipped with components of OptiFlow interface (SCIEX, P/N 5084645).
Chemicals and reagents: The Intabio system–Electrolytes and Mobilizer kit (P/N: 5088205) was used for the anolyte, catholyte and mobilizer. The stock anolyte and mobilizer were directly used without dilution. The 1% stock catholyte solution was diluted to 0.25% for use in the reagent drawer. The stock anolyte was 1% formic acid and catholyte was 1% diethylamine. The mobilizer was composed of 25% acetic acid, 25% acetonitrile and 50% water.
A 500mM cathodic spacer solution containing free base L-arginine (Arg) (purity ≥ 98.5%, Sigma-Aldrich, P/N: A8094-25G) was prepared by dissolving 0.870 mg of Arg powder into 10 mL of Milli-Q water. The electrolytes and cathodic spacer solutions were stored at room temperature. pI markers (CanPeptide) were individually dissolved in Milli-Q water at 5 mg/mL.
For the dgNISTmAb comprehensive characterization workflow, the intact mAb was first deglycosylated by removing its N-glycan. The 400 µg/mL intact mAb was mixed with 5 µL of PNGase F (New England Biolabs, P/N: 0704S) and incubated at 37°C overnight. Then, the resulting dgNISTmAb was desalted with a Zeba Spin Desalting Columns, 7K MWCO, 0.5 mL (Thermo Fisher Scientific, P/N 89882).
Prior to icIEF-UV/MS analysis using the Intabio ZT system, samples containing 400 µg/mL dgNISTmAb, 12.5mM Arg, 1% Pharmalyte 3 to10 (Cytiva, P/N: 17045601), 3% Pharmalyte 8 to 10.5 (Cytiva, P/N: 17045501) and 50 µg/mL peptide pI markers were vortexed and then degassed by centrifugation at 3900 cf.
icIEF-UV/MS analysis: An aliquot of 400 µg/mL desalted dgNISTmAb solution was mixed with carrier ampholytes, analyte and internal pI markers and analyzed using the Intabio ZT cartridge.
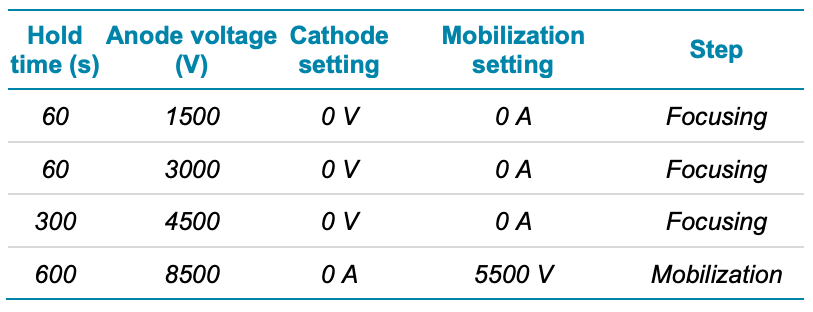
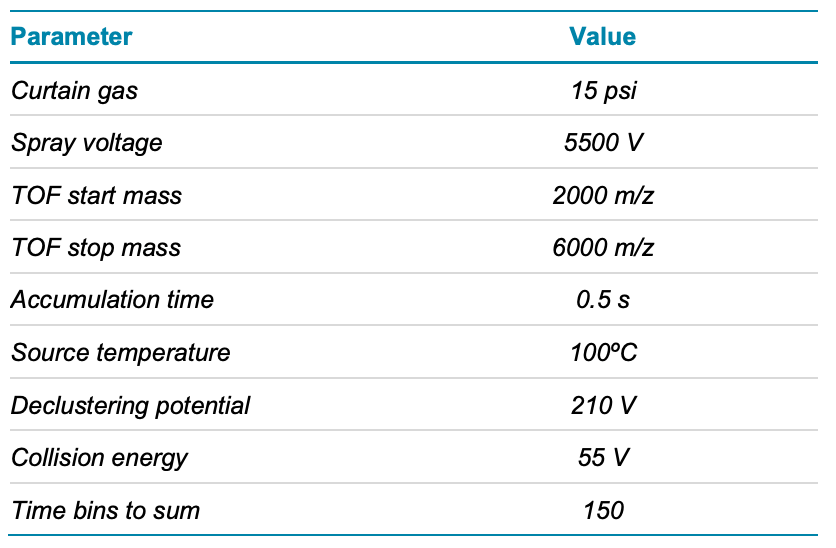
The icIEF separation profile was achieved using the parameters shown in Table 1. UV absorbance measurements were collected at 1 Hz during focusing and mobilization. The samples were introduced into the ZenoTOF 7600 system with a metered 2 µL/min flow of chemical mobilizer. The TOF MS data were acquired using the parameters shown in Table 2.
Table 1. icIEF separation settings.
Data processing: UV profiles and mass spectra from the icIEF-UV/MS analysis of NISTmAb were analyzed using the Biologics Explorer software. Each peak in the icIEF-UV profile was integrated to determine peak area and percent composition. Intact masses were estimated from the raw mass spectrum under each peak of the icIEF-MS profile utilizing a charge deconvolution algorithm with a mass range setting between 145,000 and 150,000 Da.
Table 2. TOF MS parameters.
Results and discussion
Deglycosylated NISTmAb separation and charge variants detection
Figure 1 shows the icIEF-UV and icIEF-MS profiles of the charge variants of dgNISTmAb acquired with the Intabio ZT system coupled to the ZenoTOF 7600 system. The upper panels show the icIEF-UV profile of dgNISTmAb charge variants and PNGase F separated (Figure 1A). The bottom panel shows the icIEF-MS profile of the corresponding peaks after mobilization, electrospray ionization and detection by MS. The separation profiles generated by icIEF-UV (once inverted) and icIEF-MS on the Intabio ZT system and ZenoTOF 7600 system, respectively, are similar (Figure 1B). icIEF-UV profile shows separated peaks across the icIEF separation channel, whereas the icIEF-MS profile is acquired based on the time at which the charge variants flow into the mass spectrometer after mobilization. The basic peaks shown in the icIEF-UV profile at high pI reached the MS system for analysis first and therefore appear at earlier points (left side of the icIEF-MS profile in Figure 1B). The icIEF-MS profile shows that all the peaks observed by the icIEF-UV profile were detected by the MS system without compromising separation resolution (Figure 1B). This result indicates that the separation efficiency of charge variants was well-maintained after chemical mobilization. The entire focusing and separation only took 15 min, demonstrating the capability of high-throughput characterization of charge variants.
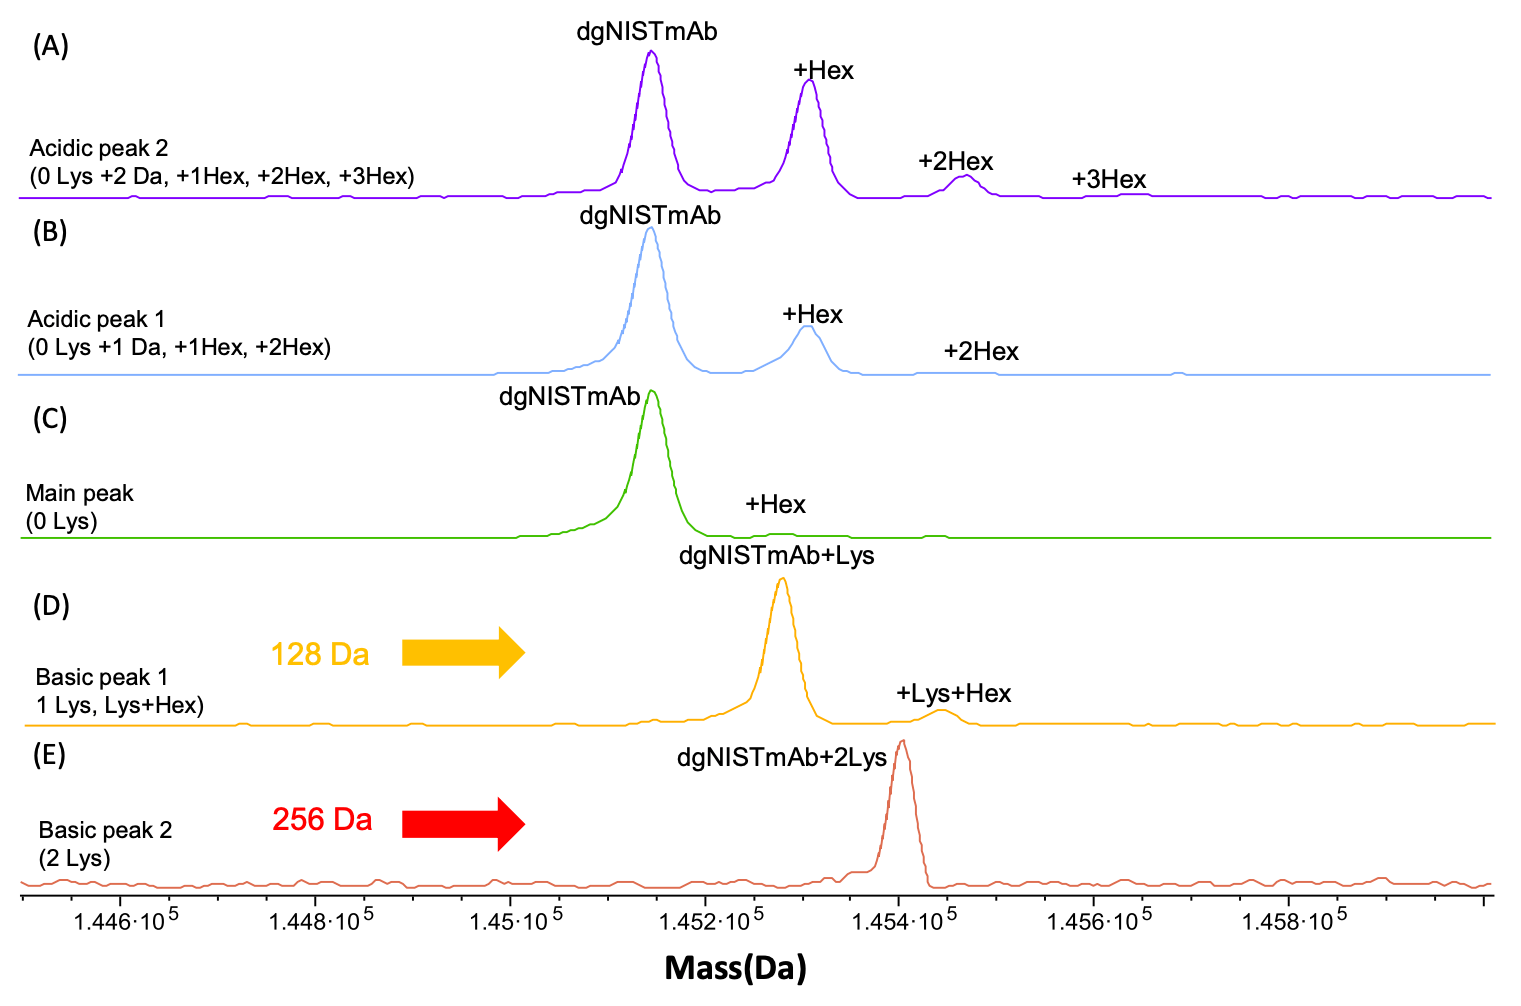
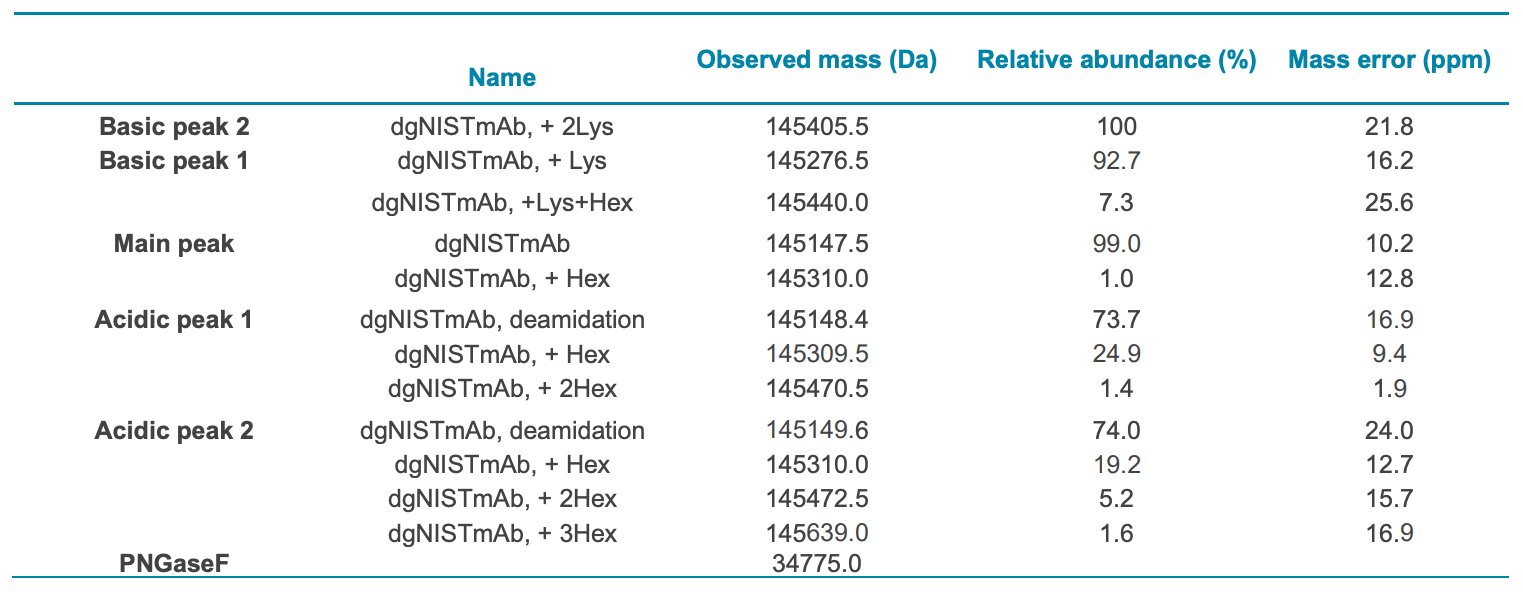
A detailed analysis of the charge variant peaks was performed on dgNISTmAb to identify different proteoforms. Figure 2 shows the overlay of the intensity normalized deconvoluted mass spectra of the 5 charge variants and 12 major proteoforms identified from the dgNISTmAb. The relative peak abundance of the identified proteoforms was calculated for each peak based on the peak intensities from the deconvoluted mass spectra (Table 3).
Figure 2. Detailed analysis of the charge variant peaks of the dgNISTmAb. An overlay of the intensity normalized deconvoluted mass spectra of the 5 dgNISTmAb charge variants detected from the icIEF-MS profile, showing the identity of the peaks detected in the icIEF-UV/MS analysis. The data analysis was performed by the Biologics Explorer software.
PTM identification from dgNISTmAb using icIEF-UV/MS
The deconvoluted mass spectrum (Figure 2) of the main peak contained a trace level of hexose (1%), indicating a glycation event. The separation profiles of basic peaks 1 and 2 showed mass increases of +256 and +128 Da, respectively, compared to the main peak (Figures 2D and 2E), which are respectively identified as C-terminal lysine variants. Further, minor glycation modification (7.3%) was observed on species with 1 C-terminal lysine in the basic 1 peak (Figure 2D). The acidic 1 and 2 charge variants had mass shifts of +1 Da and +2 Da, respectively, indicating a high abundance of proteoforms with deamidation events (Figures 2A and 2B). Abundant glycated species were also detected in acidic charge variant peaks. Proteoforms with 1 and 2 hexose additions were seen in the acidic peak 1 (Figure 2B) with relative abundances of 24.9% and 1.4%, respectively. In acidic peak 2, proteoforms with 1, 2 and 3 hexose additions were observed with relative abundances of 19.2%, 5.2% and 1.6% (Figure 2A). The separation of charge variants profile was consistently detected and measured using icIEF-UV/MS platform with a high mass accuracy (Table 3), demonstrating the accuracy of the measurement when the Intabio ZT system is coupled to the ZenoTOF 7600 system. A thorough and complete summary of charge variant separation and characterization of dgNISTmAb using the icIEF-UV/MS system is shown in Table 3.
Table 3. icIEF-UV/MS charge variant separation and relative peak area intensity of main, acidic and basic peaks of dgNISTmAb. The relative abundance was calculated for each peak.
Conclusion
- The deglycosylation experiment demonstrates the capability of the Intabio ZT system to confidently identify glycation events using icIEF-UV/MS
- The Intabio ZT system enables a streamlined workflow to separate charge variants by icIEF, quantify them by UV absorbance and identify them by ZenoTOF 7600 system
- A unified icIEF-UV/MS workflow offers high sensitivity and selectivity to detect low-abundant proteoforms that might impact product quality
- The separation efficiency and resolution of icIEF are well-maintained after mobilization, enabling highly confident identification of CQAs by icIEF-UV/MS
- The Intabio ZT system is a commercially available platform that offers a workflow combining icIEF separation, UV quantitation and compatibility for downstream MS detection
References
- Ostrowski M. Raplid multi-attribute characterization of intact bispecific antibodies by a microfluidic chip-based integrated icIEF-MS technology. Electrophoresis. 2022 Oct;1-9.
- Mullard A. FDA approves 100th monoclonal antibody product. Nat Rev Drug Discov. 2021 Jul;20(7):491-495.
- Houde D, Peng Y, Berkowitz SA, Engen JR. Posttranslational modifications differentially affect IgG1 conformation and receptor binding. Mol Cell Proteomics. 2010 Aug;9(8):1716-28.
- Mack S, Arnold D, Bogdan G, et al. A novel microchipbased imaged CIEF-MS system for comprehensive characterization and identification of biopharmaceutical charge variants. Electrophoresis. 2019, 40: 3084-3091.
- Vlasak J, Bussat MC, Wang S, Wagner-Rousset E, Schaefer M, Klinguer-Hamour C, Kirchmeier M, Corvaïa N, Ionescu R, Beck A. Identification and characterization of asparagine deamidation in the light chain CDR1 of a humanized IgG1 antibody. Anal Biochem. 2009 Sep 15;392(2):145-54