Abstract
This technical note demonstrates a novel integrated workflow using the Intabio ZT system. This innovative system offers direct chip-based integration of icIEF with mass spectrometry (MS), which affords confident characterization of different proteoforms of biotherapeutics and reliable quantitation of charge variants. Further, the streamlined icIEF-UV/MS platform significantly reduces the time to results from weeks to approximately 1 hour for routine samples, compared to ion exchange chromatography (IEX) with fraction collection.1
Introduction
Recombinant monoclonal antibodies (mAbs) have become an important class of biotherapeutics to treat various diseases due to their high specificity and efficacy.2 During the manufacturing process, heterogeneity can occur in mAbs due to enzymatic cleavage and chemical post-translational modifications (PTM).3 Many PTMs, including deamidation, C-terminal lysine truncation, glycation and sialylation, change the isoelectric point (pI) of a mAb. 4 Characterizing the charge heterogeneity of mAbs is therefore important for critical quality attribute (CQA) assessment to ensure drug safety, efficacy and potency.5 In addition, process changes can occur during manufacturing, which poses a significant concern for the development of biopharmaceutical therapeutics, as process changes could result in PTMs that impact product quality.

cIEF offers high-resolution separation of protein charge variants, including compounds with similar pI values.6 Therefore, cIEF is commonly used to monitor charge variant profiles. However, numerous technical challenges inhibit the direct combination of upstream icIEF-UV characterization with downstream identification by mass spectrometry and have limited the ability to identify proteoforms in each charge variant.
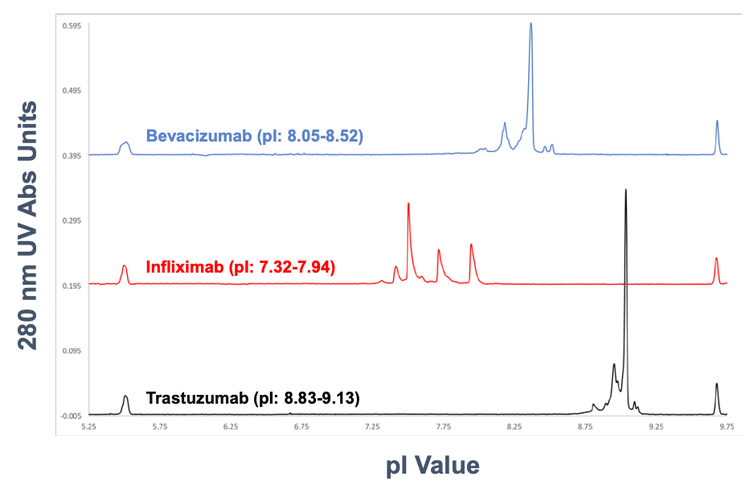
In this technical note, a platform assay using the direct chipbased integration of icIEF-UV/MS was employed to characterize 3 mAbs spanning a wide pI range7 (Figure 1).
Key features of the icIEF-UV/MS workflow
- Seamless identification of charge variants with a microfluidic chip-based integrated icIEF-UV/MS technology. The Intabio ZT system is exclusively coupled to the ZenoTOF 7600 system.
- This platform offers rapid monitoring and identification of intact biotherapeutics with a wide pI range of 7.3 to 9.1 by icIEF-UV/MS
- The 30-min sample analysis is significantly faster than conventional cIEF and IEX workflows requiring fractionation for the following identification.
- icIEF separation and UV quantitation correlate well with standard icIEF techniques
- Streamlined, intuitive data analysis software is available for rapid reporting and results sharing
Methods
Equipment: The Intabio ZT system (SCIEX) and Intabio ZT cartridge (SCIEX, P/N 5088248) were used for the separation of the 3 mAbs and their charge variants. MS detection was performed on the ZenoTOF 7600 system (SCIEX, P/N 5080337) equipped with components of the OptiFlow interface (SCIEX, P/N 5084645).

Chemicals and reagents: The Intabio system – Electrolyte and Mobilizer kit (P/N 5088205) was used for anolyte, catholyte and mobilizer. Anolyte and mobilizer were used undiluted. The stock catholyte solution was 1% and diluted to 0.25% for use in the reagent drawer. The stock anolyte is 1% formic acid and catholyte is 1% diethylamine. The mobilizer is composed of 25% acetic acid, 25% acetonitrile and 50% water.
A 500mM cathodic spacer solution containing free base LArginine (purity≥ 98.5%, Sigma-Aldrich, P/N A8094-25G) was prepared by dissolving 0.870 mg of Arg powder into 10 mL of Milli-Q water. The electrolytes and cathodic spacer solutions were stored at room temperature. pI markers (CanPeptide) were individually dissolved in Milli-Q water at 5 mg/mL.
Prior to icIEF-UV/MS analysis, bevacizumab, infliximab, trastuzumab and NISTmAb were desalted with a Zeba Spin Desalting Columns, 7K MWCO, 0.5 mL(Thermo Fisher Scientific, P/N 89882).
Bevacizumab, infliximab and trastuzumab are from stock solutions.
icIEF-UV/MS analysis: The MS signal was optimized before sample analysis using a solution containing 100 µg/mL of NISTmAb in mobilizer solution. The NISTmAb solution was infused through the Intabio ZT cartridge with 100-150 mbar of pressure. Electrospray ionization was achieved into a ZenoTOF 7600 system with a tip voltage between 5000 and 5500 V. Nitrogen gas was applied between 60 and 75 psi to the on-chip integrated nebulization channels that are coplanar with the tip of the icIEF-UV/MS chip to achieve stable and robust ionization and sample entry to the MS system.
Samples containing 250 µg/mL of NISTmAb, 10mM arginine, 1% Pharmalyte 3 to 10 (Cytiva, P/N 17045601), 2.5% Pharmalyte 8 to 10.5 (Cytiva, P/N 17045501) and 6.25 µg/mL of peptide pI markers were vortexed and then degassed by centrifugation at 3900 rcf.
The streamlined process of icIEF-UV/MS analysis is illustrated in Figure 2. First, 70 psi of nitrogen was supplied to the internal nebulization channel within the Intabio ZT cartridge during the loading, focusing and mobilization cycles of the icIEF-UV/MS separation process. After priming the channels within the Intabio ZT cartridge with either electrolyte solution or water, 50 µL of the sample was automatically loaded onto the separation channel using the autosampler. The icIEF separation was achieved using the parameters shown in Table 1. Absorbance measurements were collected at 1 Hz throughout the focusing and mobilization steps. The samples were introduced into the ZenoTOF 7600 system by a metered 2 µL/min flow of chemical mobilizer, and the data was acquired using parameters shown in Table 2.
Data processing: UV profiles and mass spectra from the icIEFUV/MS analysis of mAbs were analyzed using the Biologics Explorer software. Each peak in the icIEF-UV profile was integrated to determine peak area and percent composition. Intact masses were estimated from the raw mass spectrum under each peak of the icIEF-MS profile utilizing a charge deconvolution algorithm with a mass range setting between 145,000 and 150,000 Da.

Results and discussion
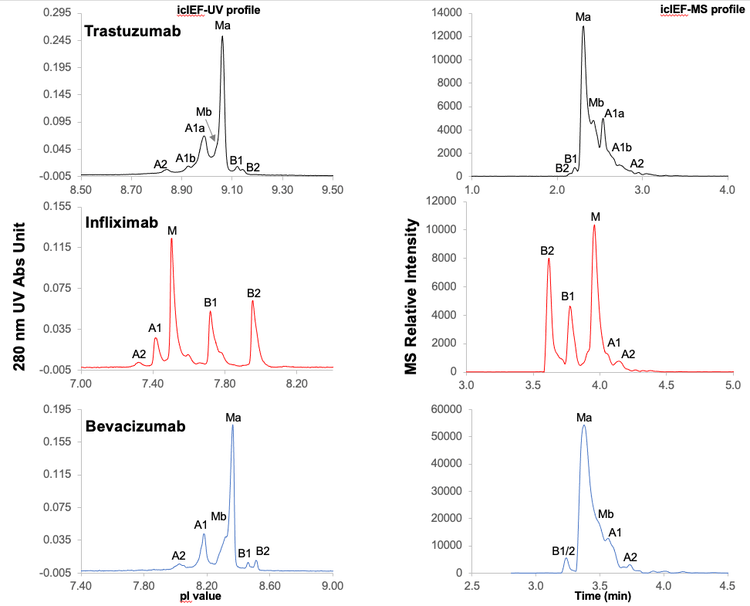
Figure 3 shows the icIEF-UV and icIEF-MS profiles of the charge variants of 3 mAbs acquired with the Intabio ZT system coupled to ZenoTOF 7600 system. The left panels show 280 nm UV absorbance profiles of trastuzumab, infliximab and bevacizumab charge variants separated by icIEF. The right panels are MS base peak electropherograms (BPEs) of the corresponding peaks after mobilization, electrospray ionization and detection by MS. The separation profiles generated by icIEF-UV (once inverted) and icIEF-MS on the Intabio ZT system and ZenoTOF 7600 system, respectively, are similar. icIEF-UV profile shows separated peaks across the icIEF separation channel, whereas icIEF-MS profile is acquired based on the time at which the charge variants flow into the MS system after mobilization. Basic peaks on the icIEF-UV profile at high pI are introduced first into the MS system for analysis and therefore appear at earlier points (left side of the MS BPE). The MS BPE shows that all the peaks observed on icIEF-UV profile were also detected in icIEF-MS profile without compromising separation resolution. This result indicates that the separation efficiency of charge variants was well-maintained after chemical mobilization. The entire focusing and separation step took less than 15 minutes, demonstrating the capability of this workflow for high-throughput analysis.
Quantitation of charge variants
The percent composition of acidic, basic and main peaks in the icIEF-UV profiles for each mAb analyzed is shown in Table 3. The use of the Intabio ZT system allowed quantitative information of the mAb charge variants to be successfully obtained from icIEF-UV profile while the proteoform composition of the charge variant peaks was identified by the coupled ZenoTOF 7600 system.
Characterization of charge variants
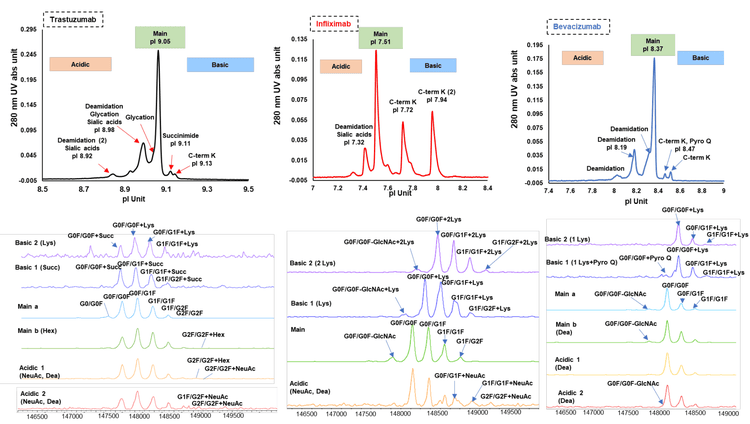
A detailed characterization of the charge variant peaks was performed for 3 mAbs to identify different proteoforms. Figure 4 shows a summary of the identified PTMs for charge variant peaks from different mAbs (top) and the corresponding deconvoluted mass spectra (bottom). Deamidation and sialylated glycans were detected in the acidic peaks of trastuzumab. Potential glycation (Hex) was observed in main peak b (green), to which other glycan isoforms can contribute. Succinimide was detected in basic peak 1 (dark blue) and C-terminal lysine variants were identified in basic peak 2 (purple). Basic peaks 1 and 2 represented different proteoforms, which differed by only 0.02 pI and were wellseparated, demonstrating the high-resolution of icIEF separation on the Intabio ZT system. For infliximab, deamidation and sialylated glycans were also identified in the acidic peaks (orange). C-terminal lysine variants were identified in both basic peaks 1 (1 Lys) and 2 (2 Lys), which are illustrated in dark blue and purple traces, respectively. For bevacizumab, deamidation were observed in both acidic peaks (yellow and red) and the main peak b (green). C-terminal lysine variants were the major species detected in the basic peaks (dark blue and purple). In addition, icIEF-UV profile reveals the existence of low-level pyroglutamate in basic peak 1. Additional complex glycans were identified by icIEF-MS profile for all 3 mAbs as listed in the figures, covering a wide range of pI values. The 3 mAbs with different pI values were comprehensively characterized by a platform method, demonstrating the user-friendly operation of the icIEF-UV/MS system without redundant method development for different molecules.


Conclusion
- The Intabio ZT system enables a streamlined workflow to separate charge variants by icIEF and identify them with ZenoTOF 7600 system across a pI range of 7.3 to 9.1
- A unified icIEF-UV/MS workflow offers high sensitivity and selectivity to detect low-abundant proteoforms that might impact product quality
- The separation efficiency and resolution of icIEF are wellmaintained after mobilization, enabling highly confident identification of CQAs by icIEF-UV/MS, such as C-terminal lysine variants, glycosylation, deamidation and glycation (Hex)
- The Intabio ZT system is a commercially available platform that offers workflow combining icIEF separation, UV quantitiation and MS-based identification.
References
- Ostrowski M. Rapid multi-attribute characterization of intact bispecific antibodies by a microfluidic chip-based integrated icIEF-MS technology. Electrophoresis. 2022 Oct;1-9
- Mullard A. FDA approves 100th monoclonal antibody product. Nat Rev Drug Discov. 2021 Jul;20(7):491-495.
- Houde D, Peng Y, Berkowitz SA, Engen JR. Posttranslational modifications differentially affect IgG1 conformation and receptor binding. Mol Cell Proteomics. 2010 Aug;9(8):1716-28.
- Vlasak J, Bussat MC, Wang S, Wagner-Rousset E, Schaefer M, Klinguer-Hamour C, Kirchmeier M, Corvaïa N, Ionescu R, Beck A. Identification and characterization of asparagine deamidation in the light chain CDR1 of a humanized IgG1 antibody. Anal Biochem. 2009 Sep 15;392(2):145-54.
- Liu H, Ponniah G, Zhang HM, Nowak C, Neill A, GonzalezLopez N, Patel R, Cheng G, Kita AZ, Andrien B. In vitro and in vivo modifications of recombinant and human IgG antibodies. MAbs. 2014;6(5):1145-54.
- Hühner J, Lämmerhofer M, Neusüß C. Capillary isoelectric focusing-mass spectrometry: Coupling strategies and applications. Electrophoresis. 2015 Nov;36(21-22):2670- 2686.
- Bumbaca D, Boswell C, Fielder P, Khawli L. Physiochemical and Biochemical Factors Influencing the Pharmacokinetics of Antibody Therapeutics. AAPS J. 2012 Sep 14(3):554-558