Intermediate precision study of capillary electrophoresissodium dodecyl sulfate (CE-SDS) assay on the BioPhase 8800 system
Featuring the BioPhase 8800 system and the CE-SDS Protein Analysis Kit
Marcia Santos, Jane Luo, Fang Wang, Tingting Li and Sahana Mollah
BioPharma
SCIEX - Brea/California
Abstract
CE-SDS on BioPhase 8800 system we show an inter-capillary reproducibility better than 0.38% RSD for relative migration time (RMT) and 0.3% RSD for corrected peak area (CPA) % for the heavy chain peak. For intra-capillary reproducibility, our results revealed %RSD for relative migration time between 0.23 and 0.61% and between 0.23 and 0.48% for corrected peak area %.
Introduction
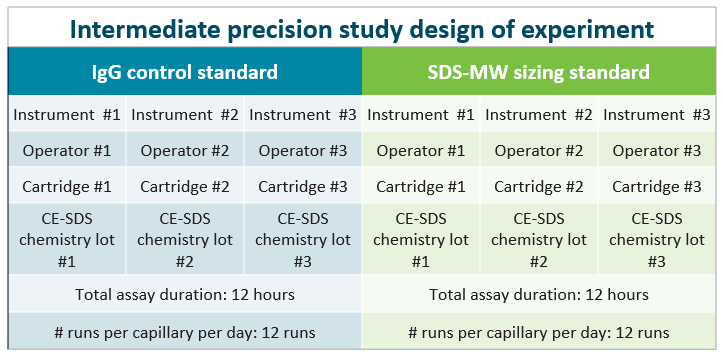
Characterization by capillary electrophoresis sodium dodecyl sulfate (CE-SDS) is a ubiquitous technology throughout the life-cycle of therapeutic antibodies and molecules alike. To enable analytical scientists in the biopharma industry to deliver fast, accurate and reliable results for process and productrelated impurities requires a complete solution including a robust high throughput analytical platform and chemistry.1-3 . This technical note describes the intermediate precision study (Figure 1) of the CE-SDS assay using the BioPhase 8800 system.
We demonstrate an inter-capillary reproducibility better than 0.38% RSD for relative migration time (RMT) and 0.29% RSD for corrected peak area (CPA) % for the heavy chain peak of reduced IgG control standard. For intra-capillary reproducibility, our results showed a RSD for relative migration time between 0.23% and 0.61% and between 0.23% and 0.48% for CPA%.
Key features
- Parallel processing of 8 samples simultaneously enables data collection in less than 7.5 minutes per sample
- Outstanding inter-capillary reproducibility with less than 0.4% RSD for RMT and less than 0.3% for CPA% for heavy chain
- Excellent intra-capillary reproducibility with %RSD for RMT and CPA%, less than 0.6% for heavy chain
- Complete CE-SDS kit and pre-assembled bare fused silica cartridge facilitate user to user consistency and overall data reproducibilitycontent here
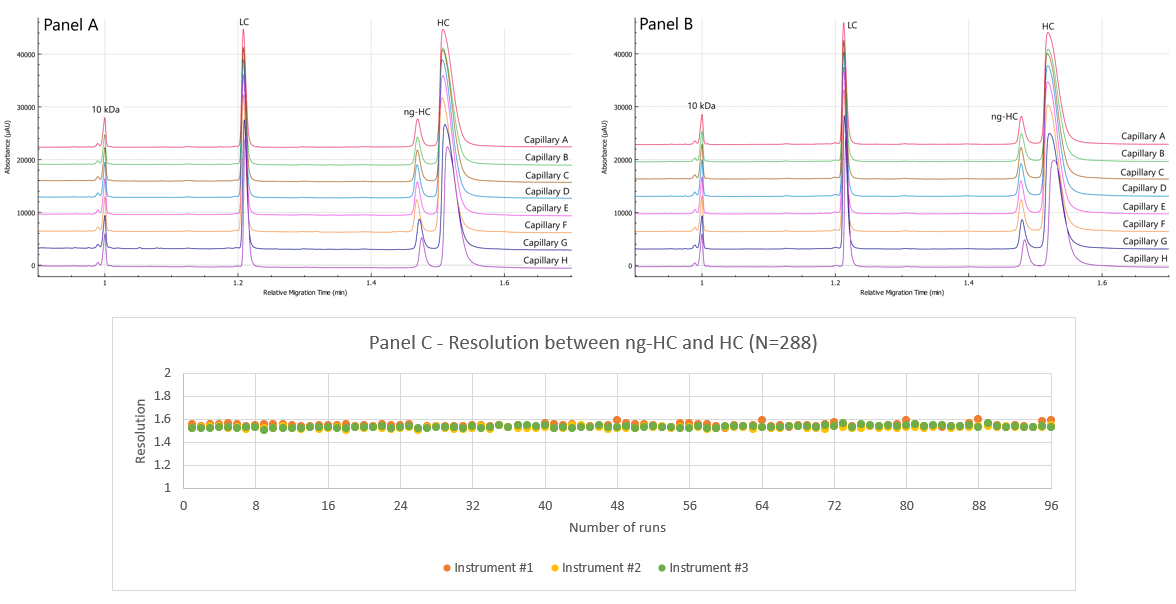
Figure 1. Representative electropherograms of the reduced IgG control standard and resolution. A) Electropherogram from a representative first run on 8 capillaries; B) Representative last run of IgG control standard on 8 capillaries. C) Resolution between the ng-HC peak and the HC, 96 runs per user displayed separately (total of 288 runs)
Methods
Materials: The BioPhase CE-SDS Protein Analysis Kit (PN C30085), including the SDS-MW separation gel buffer, 10 kDa internal standard, basic wash, acidic wash, sample buffer, IgG control standard (PN 391734) and SDS-MW size standard (PN A22196) were from SCIEX, Framingham, MA). The βmercaptoethanol(β-ME) (Part # M3148-25ML) was from Sigma Aldrich (St. Louis, MO).
IgG control standard preparation per user: A 950 μL of IgG control standard was combined with 50 μL of β-Me and 20 μL of 10 kDa internal standard. The sample mixture was vortexed, briefly centrifuged at 2,500 g, then heat denatured at 70°C for 10 min. Afterward, the sample was allowed to cool to room temperature, and a 100 μL of the sample solution was transferred to each well of the sample plate for CE-SDS analysis. The samples were then pooled and re-distributed to avoid sample to sample variation.
SDS-MW sizing standard preparation per user: A 90 μL of SDS-MW sizing standard was combined with 765 μL of sample buffer, 18 μL of 10 kDa internal standard, and 45 μL of β-ME. The sample mixture was vortexed, briefly centrifuged at 2,500 g, then heat denatured at 70°C for 10 min. Afterward, the sample was allowed to cool to room temperature and a 100 μL of the sample solution was transferred to each well of the sample plate for CE-SDS analysis. The samples were then pooled and redistributed to avoid sample to sample variation.
Instrumentation: The BioPhase 8800 system equipped with UV absorbance detection at 220 nm (PN 5083590F), the BioPhase BFS capillary cartridge - 8 x 30 cm (PN 5080121) and Sample and Reagent Plates kit (PN 5080311) were from SCIEX (Framingham, MA). Multi-Therm shaker incubator (PN H5000-H) was from Benchmark Scientific (Sayreville,NJ).
Methods: The capillary conditioning method was performed at the beginning of each sequence, as shown in Figure 2A. The temperature of the sample storage compartment and separation cartridge was always set at 25°C. Figure 2B shows the details of the separation method.
Software: The BioPhase software package version 1.0 was used for creating run methods and sequence and for data acquisition and processing.
Results and discussion
Monoclonal antibodies (mAbs) and next-generation biologics (NGB) belong to a class of molecules that has been established as one of the most powerful approaches to treating serious diseases that once were considered untreatable.4 mAbs and NGBs are highly complex molecules that require robust analytical characterization tools to ensure product consistency in quality, safety and efficacy throughout the production process.5
Figure 2. Conditioning and separation methods used on the BioPhase 8800 system. A) shows the detailed settings for the conditioning method. B) The separation method.
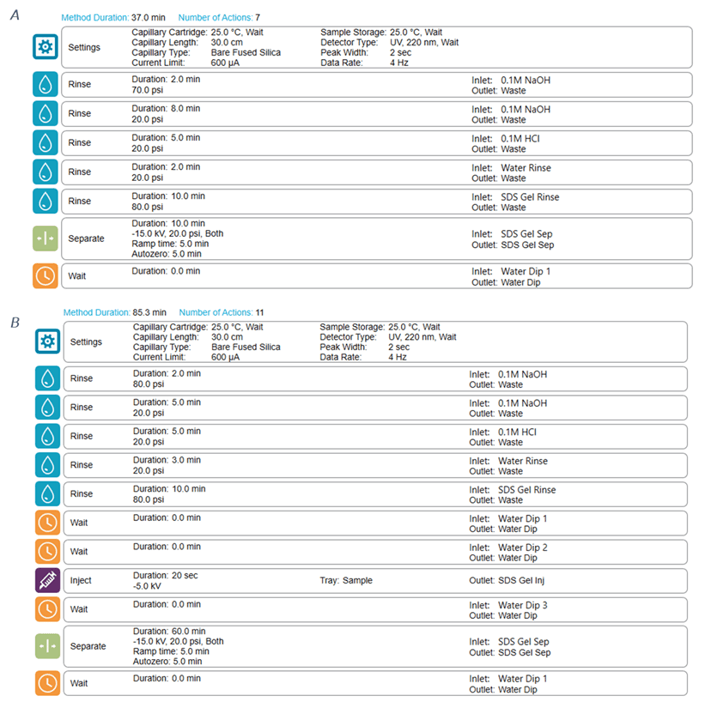
The BioPhase 8800 system is a high-performance multi-capillary electrophoresis system, offering a fully automated platform that, combined with a state-of-the-art chemistry kit, enables scientists to address the analytical characterization challenges in record time.
However, for the industry to adopt such an analytical tool, it is necessary to show compelling confirmation of inter and intracapillary consistency between runs, cartridges, users, instruments, and days. This technical note summarizes the intermediate precision study and the resulting performance of the CE-SDS assay on the BioPhase 8800 system.
Design of the intermediate precision study
Figure 3 shows the intermediate precision study design scheme. The approach used in this study sought to determine the impact of the instrument, operator, capillary cartridge, and chemistry kit lot on inter- and intra-capillary reproducibility. The study took only 2 days of laboratory and instrument hands-on work and 1 day for data analysis and reporting.
This design assessed the assay and instrument performance using a reduced IgG control standard. Several parameters were monitored to determine the intra- and inter-capillary reproducibility, including:
- corrected peak area (CPA) % and relative migration time (RMT) of light chain (LC), non-glycosylated heavy chain (ng-HC), and heavy chain (HC)
- the corrected peak area ratio between HC and LC
- resolution between ng-HC and HC
We used the molecular weight size standards to assess the inter-system assay precision and the intra-capillary consistency of the MW size calibration curve for each marker using Log MW vs 1/RMT.
Figure 3. Intermediate precision study design scheme.
Intra and inter-capillary reproducibility using IgG control standard
Twelve runs of the IgG control standard were performed by each user on a representative instrument. Figures 1A and 1B showcase the overlayed electropherograms of the IgG control standard, respectively. Traces of absorbance are shown as a function of relative migration time in separate lines of each panel for capillaries A-H.
Relative migration time: Figures 1A and 1B show a good overlay of the 10 kDa internal standard that was used to calculate the relative times of LC, ng-HC and HC. Table 1 summarizes the intra and inter-capillary average values for relative migration time (RMT). Overall, the average values (N=288) for RMT were consistent inter and intra-capillaries indicating the assay's specificity, reproducibility, and the robustness of the cartridge cooling features of the BioPhase 8800 system. Table 2 highlights a %RSD better than 0.38% for the RMT for the 3 major species of reduced IgG control standard.
Corrected peak area %: The corrected peak area % (CPA%) was determined automatically by the BioPhase software. Briefly, the CPA% was calculated by dividing the peak area by the velocity of the corresponding peak. The average values for the CPA% of the major species found in the reduced IgG control standards (LC, ng-HC and HC) are displayed in Table 1. Consistent values for CPA% were observed for the reduced form of the IgG control standards across all 8 capillaries. Moreover, this result was reproducible across the 3 systems tested, highlighting inter- and intra-capillary reproducibility. The overall intra-capillary %RSD for CPA% for the LC, ng-HC and HC was between 0.23% and 1.39%.
Table 1. Intra- and inter-capillary average values for relative migration time, corrected peak area % and HC/LC ratio for IgG control standard. N=288
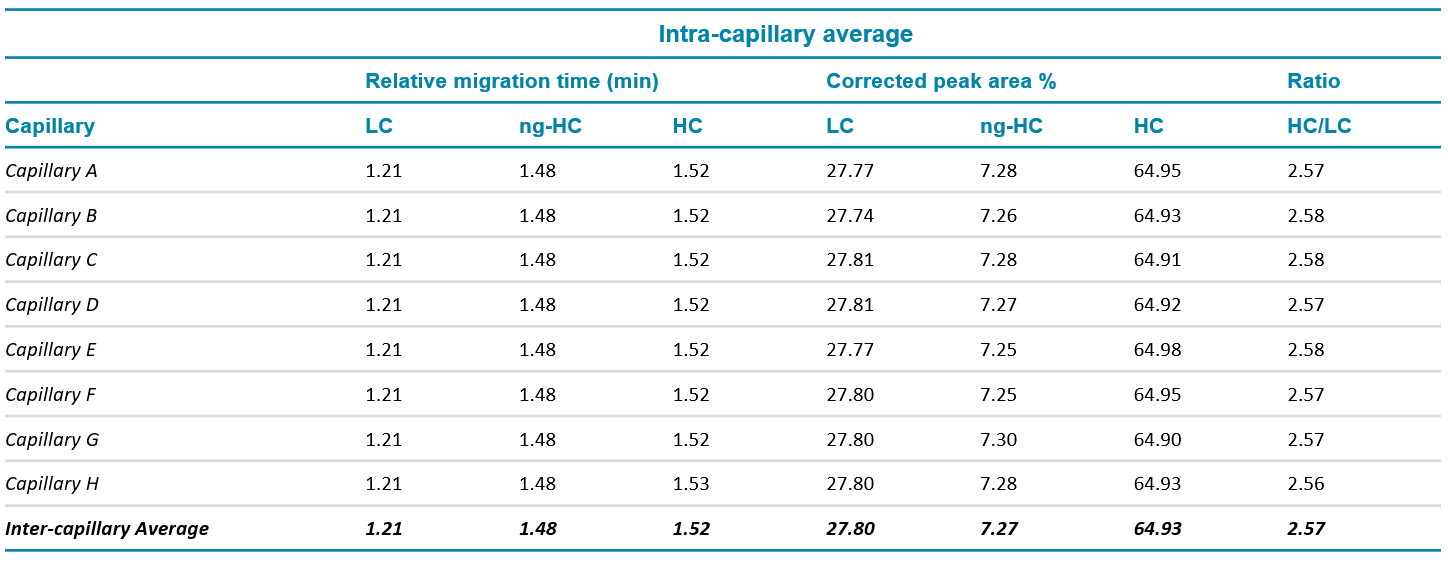
Table 2. Intra- and inter-capillary %RSD for relative migration time, corrected peak area % and HC/LC ratio for IgG control standard. N=288
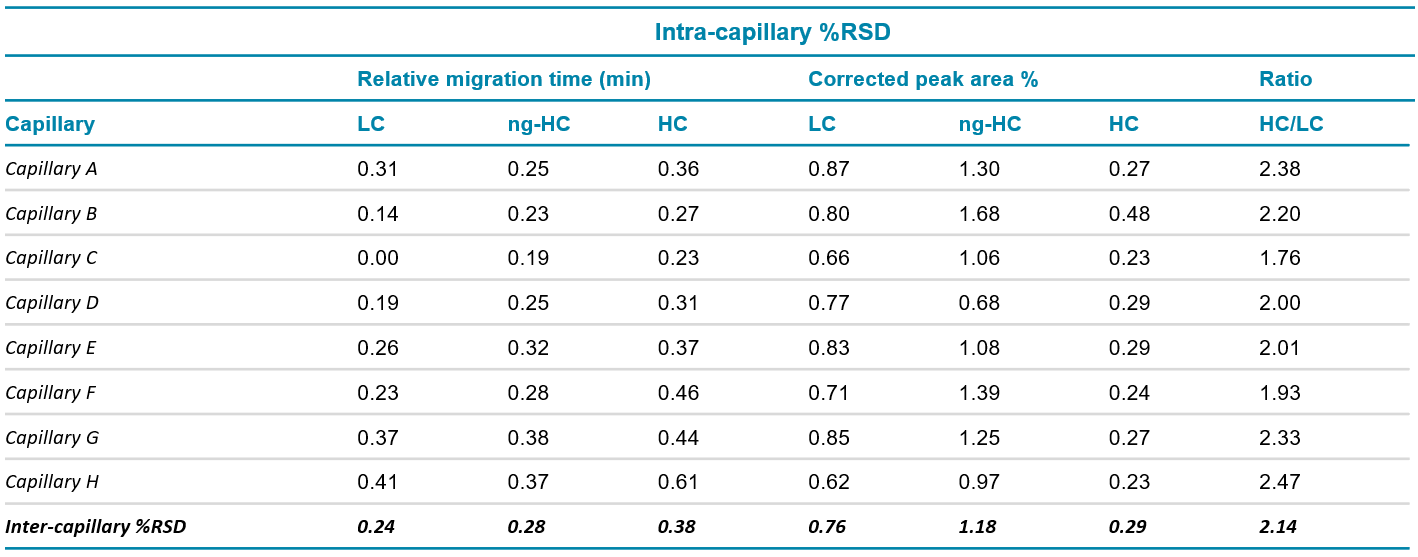
HC/LC ratio: The ratio between the CPA for the HC and LC was automatically calculated by the software without any additional user input. The average intra-capillary values are shown in Table 1 and indicate the consistency of the data. A %RSD of the HC/LC ratio between 1.76 and 2.47% was observed intracapillary and 2.14% for inter-capillary, indicating good reproducibility (Table 2).
Resolution ng-HC and HC: Another critical quality attribute is the resolution between the ng-HC and HC. The presence of a ng-HC peak is considered a product-related impurity because it alters the stability and effector functions of the final therapeutic product. Therefore, it is essential to separate and quantify this variant consistently.6 The mobility of these species is very similar and therefore it is necessary to monitor resolution and specificity during the CE-SDS separation under reduced conditions.
Figure 1C shows the resolution obtained across 3 users (N=288 injections). The overlay of the data points corresponding to the data from the 3 instruments suggests consistent baseline resolution between ng-HC and HC across capillaries, cartridges, and instruments. The overall reproducibility achieved for the resolution between the ng-HC and HC resolution is better than 0.90 %RSD.
CE-SDS of molecular weight size standards
A similar study was carried out using MW sizing standards. Figure 4 shows the inter-assay precision attained across 288 data points collected by 3 users on 3 instruments. The bar graphs suggest high reproducibility of the relative migration time for the 7 MW size markers and a consistency between the 3 systems.
The error bars indicate the standard deviation of the measurements for each BioPhase 8800 system used in this study and demonstrate the high precision of the assay across systems. The number shown above each bar graph is the average relative migration time for each MW standard obtained from the 3 instruments.
Table 3 shows inter-capillary data from the analysis of the MW standards. The relative migration time for the MW standards was consistent across all capillaries.
During protein characterization, analytical scientists typically use at least one injection of the MW size ladder in the same sequence (or capillary) as the proteins being studied. Figure 5 demonstrates the consistency between capillaries by plotting the inverse of the relative migration time (1/RMT) against the corresponding molecular weight log (log MW). The logarithmic curve fittings have an average R2 greater than 0.99. This intercapillary consistency allows the user to run only 1 MW size ladder in 1 well and apply the resulting calibration curve to the entire plate.
Figure 4. Inter-assay precision between 3 instruments. The numbers above each bar indicate the relative migration time and the error bar represents the standard deviation.
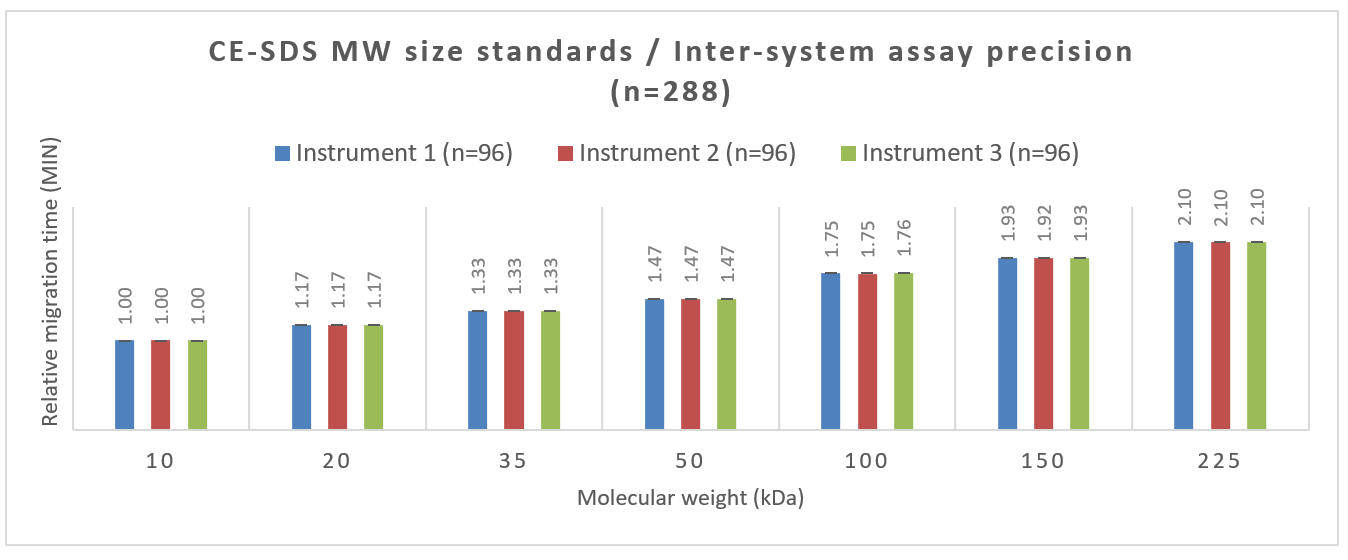
Figure 5. Inter-capillary 1/RMT vs log MW for molecular weight calculation.
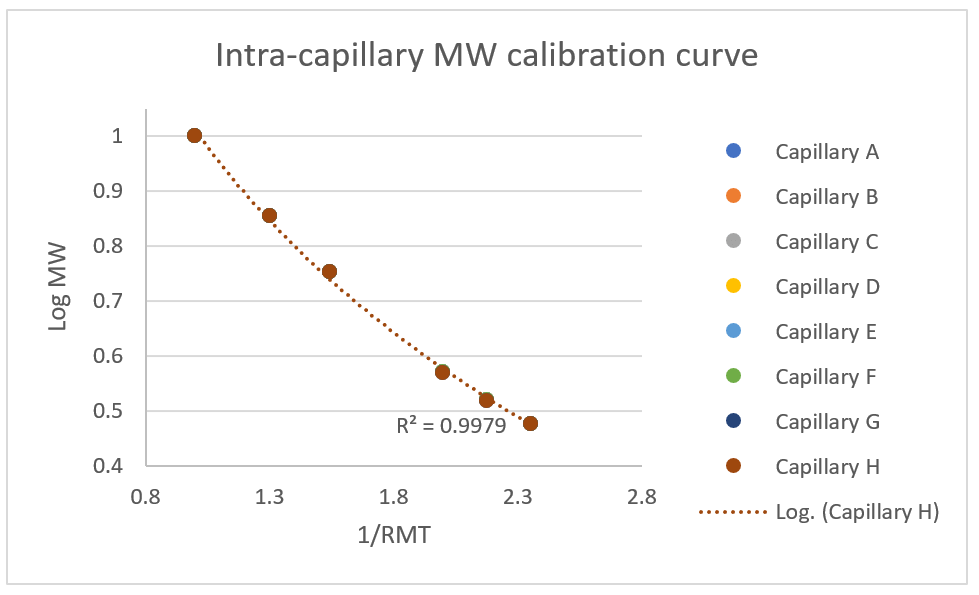
Figure 6 visually verifies these findings by displaying the overlay of 8 representative electropherograms corresponding to the first and last injections performed for this study from 1 instrument. The x and y axes show relative migration time and absorbance units, respectively.
Table 3. Intra and inter-capillary average values for relative migration time, for the molecular weight size standard. N=288
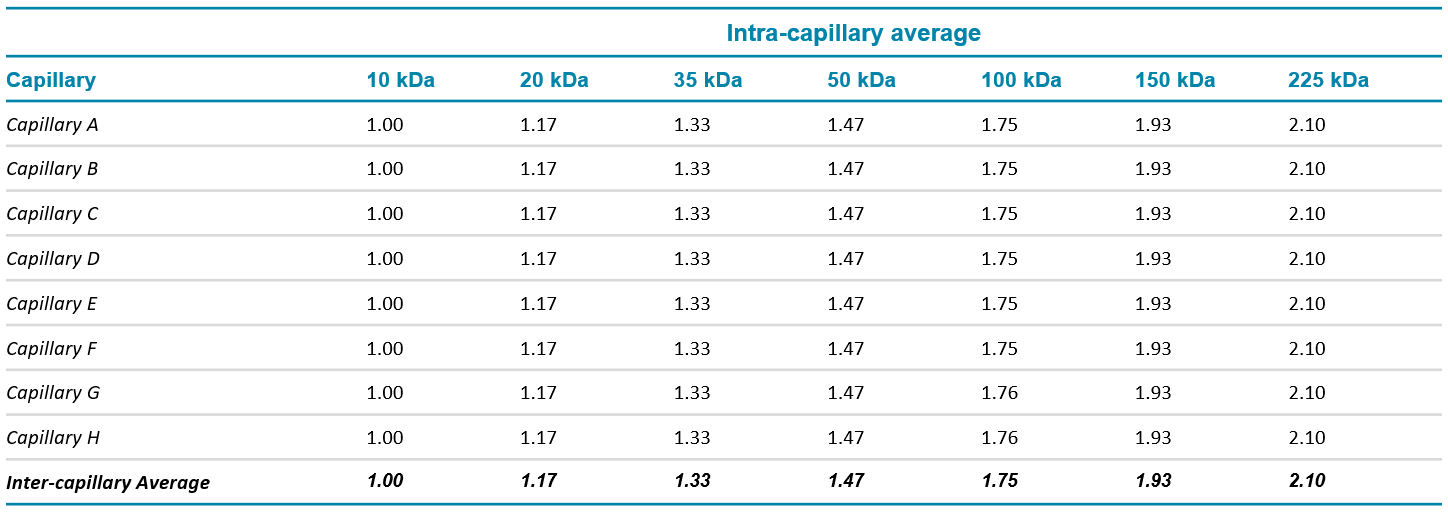
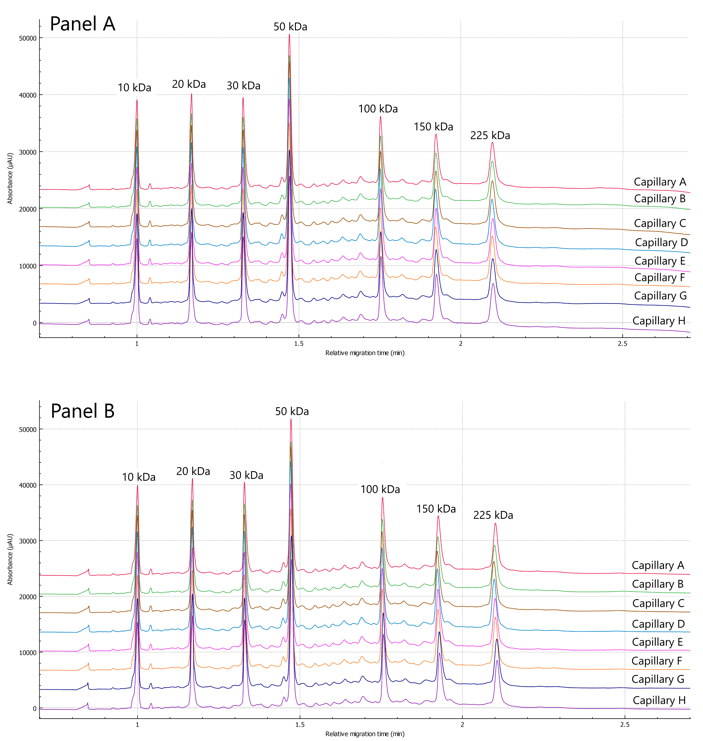
Figure 6. Figure 6. Representative electropherograms of the MW size standards. A) Electropherograms from a representative first run on 8 capillaries.; Panel B: last or (12th) set of 8 runs.
Conclusion
- Excellent inter- and intra-capillary reproducibility for RMT and CPA% for LC, ng-HC and HC between all parameters studied, illustrating robustness and consistency across BioPhase 8800 systems, cartridges and chemistry kits
- The intra-capillary MW standards calibration curve demonstrated a R2 of log MW to 1/RMT better than 0.99
- The multi-capillary environment of the BioPhase 8800 system allowed for an extensive intermediate precision study to be completed efficiently over the course of 3 days relative to a single capillary format
- The combination of a complete chemistry kit and preassembled cartridge facilitated the throughput and robustness of this study content here
References
- R. R. Rustandi, M. W. Washabaugh, Y. Wang; Applications of CE SDS gel in development of biopharmaceutical antibody-based products; Electrophoresis 2008, 29, 3612–3620.
- J. Zhang, S. Burmana, S. Gunturia, J. P. Foley; Method development and validation of capillary sodium dodecyl sulfate gel electrophoresis for the characterization of a monoclonal antibody; Journal of Pharmaceutical and Biomedical Analysis 53 (2010) 1236–1243.
- N. A. Lacher, R. K. Roberts, Y. He, H. Cargill, K. M. Kearns, H Holovics, M. N. Ruesch; Development, validation, and implementation of capillary gel electrophoresis as a replacement for SDSPAGE for purity analysis of IgG2 mAbs; J. Sep. Sci. 2010, 33, 1–10
- R-M. Lu, Y-C. Hwang, I-J. Liu, C-C. Lee, H-Z. Tsai, H-J. Li & H-C. Wu; Development of therapeutic antibodies for the treatment of diseases; Journal of Biomedical Science volume 27, 1 (2020)
- A. Beck, H. Diemer, D. Ayoub, F. Debaene, E. WagnerRousset, C. Carapito, A. Van Dorsselaer, S. SanglierCianférani, Analytical characterization of biosimilar antibodies and Fc-fusion proteins; TrAC Trends in Analytical Chemistry, Volume 48, 2013, 81-95.
- Kai Zheng, Christopher Bantog, and Robert Bayer; The impact of glycosylation on monoclonal antibody conformation and stability; MAbs. 2011 Nov-Dec; 3(6): 568– 576.