Introduction
Oligonucleotides longer than 70 nucleotides (nt) are increasingly used in applications such as gene therapy and next-generation sequencing (NGS). The length and integrity of these long oligonucleotides are critical quality attributes of these products. Oligonucleotide length analysis is also important in measuring poly(A) tail length to ensure the efficacy of mRNA vaccines. 1-2 Compared to short oligonucleotides, such as antisense oligonucleotide drugs, characterizing the length and integrity of long oligonucleotides by mass spectrometry is challenging because they do not readily fragment by collision-induced dissociation (CID) MS/MS. Identification is mainly performed by determining their accurate mass. Here we describe a robust workflow that uses the SCIEX ZenoTOF 7600 system to analyze the length, integrity, and purity of long oligonucleotides.
In this example, we determine the molecular weight (MW) and analyze the purity of a 70-mer DNA sequence with a 3’ dT overhang that is linked through a phosphorothioate group in the 5’… GATC*T construct. This type of long oligonucleotide is often used as an adapter for NGS library preparation and the presence of 3’ dT is important for NGS data quality. The detection and quantification of the loss of the overhang *T are important but challenging due to the length of these oligonucleotides. Capillary electrophoresis with optical detection can be used to screen for impurities that differ by 1 nucleotide from the full-length product (FLP). 3-4 However, this technique cannot differentiate between the loss of the *T and the loss of another nucleotide. Using highresolution TOF MS spectra and the chromatographic separation of the -*T impurity from the FLP and -A and -G impurities – the two most challenging impurities due to their very small mass differences with the -*T impurity – positive identification of the impurities and the FLP was achieved with high (<2 ppm error) mass accuracy. Relative quantification of spiked-in impurities was achieved at 1% of the FLP with excellent precision and accuracy.
Key features of the ZenoTOF 7600 system and SCIEX OS software for MW confirmation and impurity analysis
- Accurate MW confirmation for length and integrity of long oligonucleotides and their impurities using high resolution TOF MS data with excellent mass accuracy and intact mass reconstruction
- Full isotope resolution after reconstruction for confident, unambiguous confirmation of MW
- Easy and accurate quantification using reconstructed mass in SCIEX OS software for quick determination of relative amounts of impurities
Methods
Samples and reagents: A 70-mer DNA oligonucleotide with 1 phosphorothioate bond at the 3’ end (Seq70) was custom synthesized by Integrated DNA Technologies (IDT) and used as the FLP. Three impurity structures were obtained from IDT, including structures with loss of an internal A (Seq70-A), loss of an internal G (Seq70-G) and loss of the 3’ phosporothioate T (Seq70-*T). The FLP was desalted, and the impurities were HPLC purified and desalted. Samples were dissolved in a 10 mM Tris, 0.1 mM EDTA solution (IDTE solution, IDT) and diluted with mobile phase A to a 5 µM solution of the FLP with impurities spiked in at 1%, 2%, 3% or 5%. The ion-pairing reagents 1,1,3,3,3-hexafluoroisopropanol (HFIP, ≥99.8%, PN: 105228) and diisopropylethylamine (DIEA, ≥99.5%, PN: 387649) were used for HPLC separation and were purchased from SigmaAldrich.
Chromatography: A Shimadzu Nexera XS inert HPLC system was used with water as mobile phase A and 50/50 (v/v) water/methanol as mobile phase B, both containing 15 mM DIEA and 50 mM HFIP. A gradient from 39–44% B in 10 min with a 4 min wash step at 95% B was used with a flow rate of 0.25 mL/min. The column was a Waters ACQUITY PREMIER Oligonucleotide C18 (2.1 × 150 mm, 1.7 µm, 130 Å) kept at 60ºC. The injection volume was set to 5 µL, resulting in a total of approximately 500 ng of oligonucleotides on column.
Mass spectrometry: A SCIEX ZenoTOF 7600 system was used in negative polarity mode. The TOF MS parameters used are summarized in Table 1.
Data processing: Data were processed using SCIEX OS software, version 3.0. Mass reconstruction to confirm MW was performed using the Bio Tool Kit module of the SCIEX OS software. Relative quantification of the spiked-in impurities was performed using the Analytics module with the intact mass quantification option.

Confirmation of MW
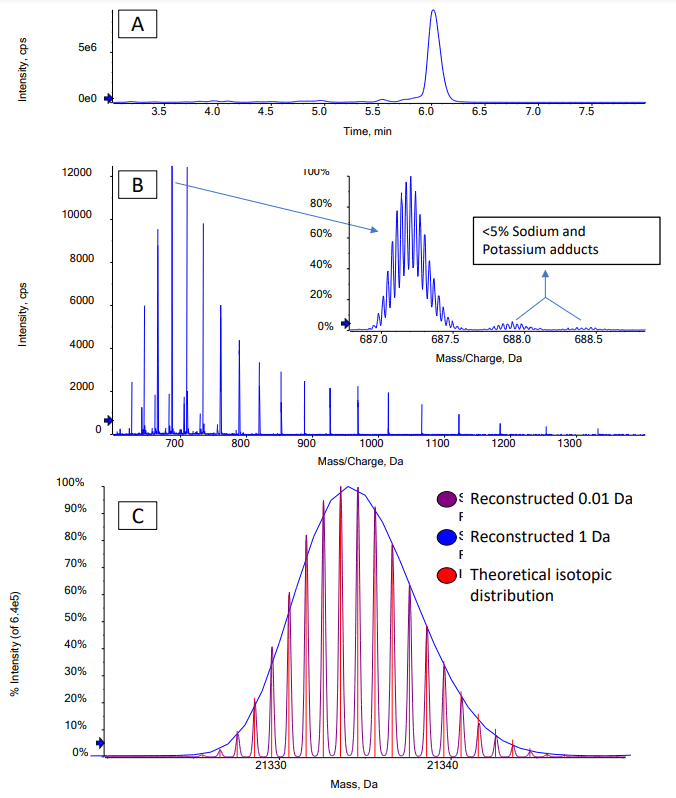
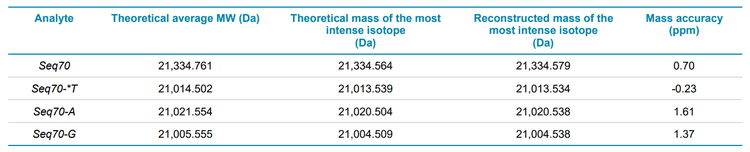
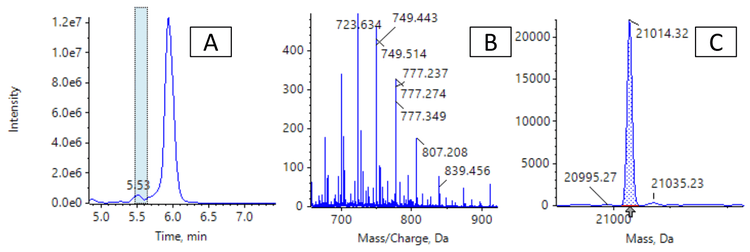
Confirming the MW of large oligonucleotides by mass spectrometry becomes more difficult as the MW increases because the resolution of the mass spectrometer can limit the ability to separate the main isotopes after reconstruction. Determining the average MW from an unresolved reconstructed spectrum is possible, but typically results in poor mass accuracy because reconstructed spectra for large oligonucleotides are often non-gaussian. For the 70-mer oligonucleotides studied in this technical note, the spectra acquired using the ZenoTOF 7600 system had sufficiently high resolution to determine the masses of the most intense isotopes with excellent mass accuracy. High-resolution TOF MS spectra were acquired for the FLP and for the 3 impurities. Figure 2 shows the extracted ion chromatogram (XIC) and spectrum of the Seq70 FLP. The Bio Tool Kit module in the SCIEX OS software was used to reconstruct the intact MW with the charge states shown in Figure 2 as input. Reconstruction with a step size of 0.01 Da was used to obtain full baseline resolution of the isotopes of the FLP and impurities. Mass accuracy was calculated by comparing the observed mass to the theoretical mass of the most intense isotope. Excellent mass accuracy (<2 ppm) was observed for each oligonucleotide (Table 2). The measured isotope pattern was highly correlated to the theoretically calculated pattern, further aiding the confident confirmation of the oligonucleotide structures (Figure 2).
Identification of impurities
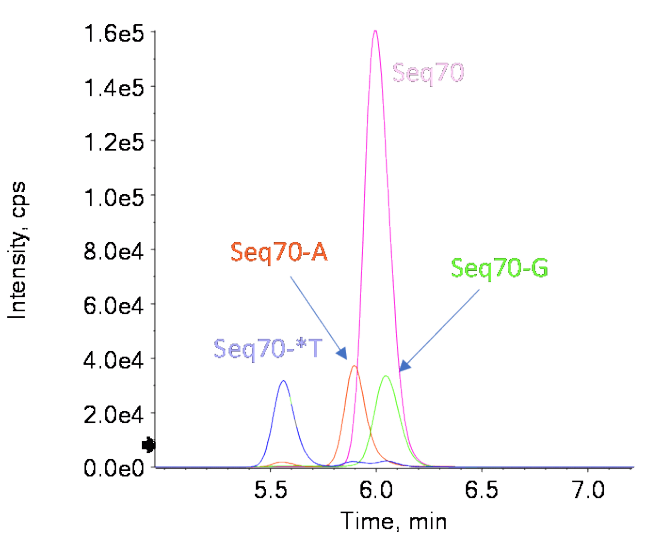
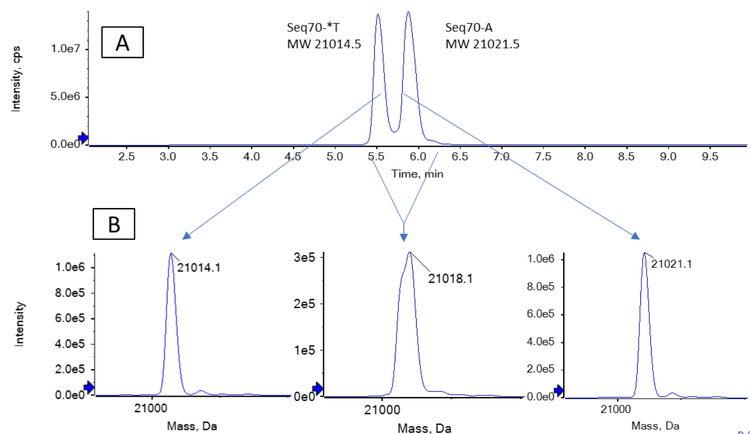
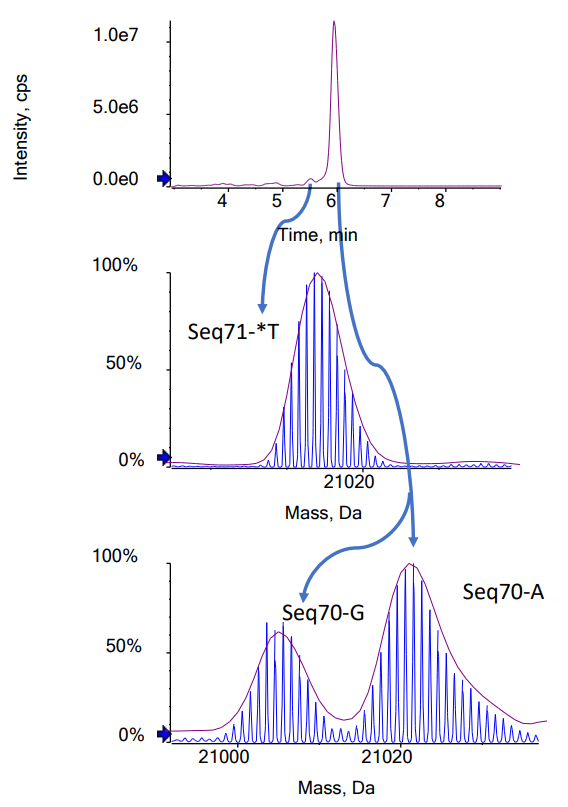
While the FLP and the most observed impurities have different MWs, the difference in mass between Seq70-*T and Seq70-A of only 7 Da is not sufficient to separate them using mass spectrometry. Figure 3B shows that the Seq70-*T and Seq70-A impurities could not be differentiated from each other when reconstruction was performed using the spectra of both impurities, which simulated no chromatographic separation. When the impurities were chromatographically separated, however, the correct reconstructed masses for these 2 impurities were measured. The low methanol content of mobile phase B (50%) helped to generate the shallow gradient needed to separate the Seq70-*T and Seq70-A impurities. Figure 1 shows the separation of all 4 oligonucleotides. Figure 4 shows the reconstructed spectra for the 3 impurities spiked in at the 2% level. All 3 separated impurities could be confidently identified based on the TOF MS data.
Relative quantification of impurities
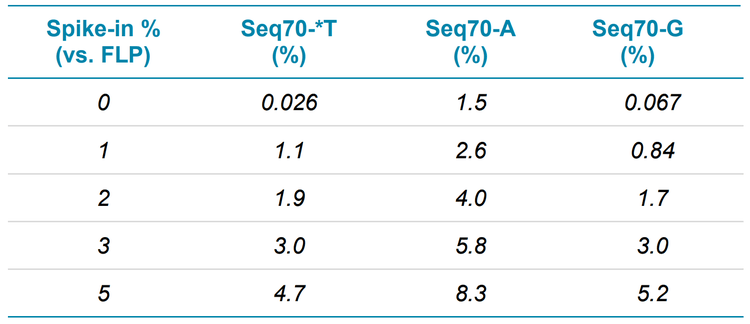
Using the intact quantification option in the SCIEX OS software, the areas of the impurity mass peaks were calculated relative to the FLP for 5 µM samples of FLP spiked with 0%, 1%, 2%, 3% and 5% of the 3 impurities. Each sample was analyzed in triplicate. Figure 5 shows the area of the XIC that was reconstructed, the average spectrum and the integrated reconstructed mass spectrum for the 2% spike-in sample. The measured values found were in good correlation with the spikedin amounts (Table 3). The Seq70-A impurity was present in the FLP, causing the values for this impurity to be higher than the spiked-in amount.
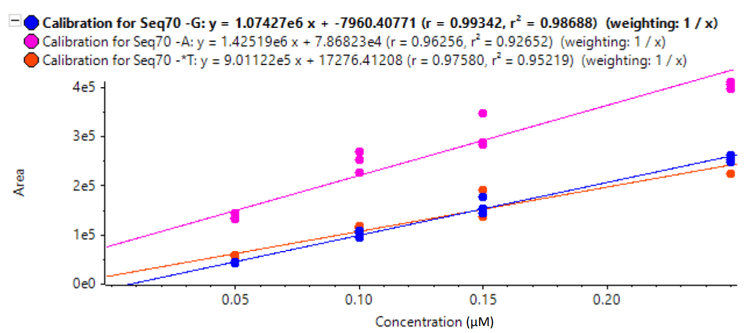
Table 4 summarizes the average accuracy and precision for the different spiked-in amounts using a linear calibration, and Figure 6 shows the calibration curves for the impurities between the 1% and 5% spike-in levels. Accuracies were excellent, and precision was better than 15%, except for the 3% Seq70-*T spike-in level, which had a precision of 21%.

Conclusion
- The MWs of a 70-mer oligonucleotide and 3 of its (n-1) impurities were determined using the ZenoTOF 7600 system
- Full isotopic resolution and reconstructed mass accuracy of <2 ppm were achieved using high-resolution TOF MS data
- Impurities that could not be distinguished by mass spectrometry only, were separated chromatographically and correctly identified and quantified
- Accurate and precise relative quantification of 3 spiked (n-1) impurities in the range from 1-5% were achieved using the easy-to-use intact quantification feature of the SCIEX OS software.
- The workflow described for an NGS adapter can be used to analyze the length and integrity of poly(A) tails for mRNA vaccines and for single guide RNA for CRISPR content here
References
- Jalkanen AL, Coleman SJ, Wilusz, J (2014) Determinants and implications of mRNA poly(A) tail size – Does this protein make my tail look big? Semin Cell Dev Biol. 34: 24– 32.
- Schlake T, Thess A, Fotin-Mleczek M et al. (2012) Developing mRNA-vaccine technologies. RNA Biol. 9(11):1319-30.
- RNA Analysis for CRISPR by capillary electrophoresis with laser-induced fluorescence detection. SCIEX technical note, RUO-MKT-02-10432-B.
- Capillary electrophoresis of oligonucleotides. (2011) Integrated DNA Technologies (IDT).