Quantification of antisense oligonucleotides in plasma using direct inject microflow LC-MS/MS
Increasing sensitivity for oligonucleotide quantification using the M5 MicroLC system, powered by SCIEX OS software
Remco van Soest, Eshani Nandita and Ebru Selen
SCIEX, USA
Abstract
This technical note describes the quantification of antisense oligonucleotides (ASOs) in rat plasma using a direct inject microflow LC method paired with a high-performance triple quadrupole mass spectrometer. A simple and easy direct inject workflow was developed for the analysis of oligonucleotides, demonstrating accurate quantitative performance with %CV values <15%. The M5 MicroLC system and the SCIEX 7500 system were operated using a single platform for method development and data management with the SCIEX OS software.

Introduction
Oligonucleotide-based therapeutics and gene therapies are rapidly gaining attention as their potency improves and delivery challenges are addressed. Modalities such as ASOs are becoming more important due to their high specificity and ability to reach formerly undruggable targets. Sensitive and robust methods for the quantitative analysis of oligonucleotides are needed to support the development of ASO therapeutics. LCMS/MS can provide the required selectivity, sensitivity and ability to analyze multiple oligonucleotides in a single assay. However, sensitivity can still be insufficient for studies with a limited sample, such as preclinical pharmacodynamic studies in rats or mice. Bioanalysis workflows for oligonucleotides that feature a simple method setup while maintaining the desired sensitivity and low carryover remain challenging to achieve. Here, a direct inject microflow LC system was paired with the SCIEX 7500 system to quantify several ASOs in rat plasma.
Key features of the microflow workflow using the SCIEX 7500 system for oligonucleotide quantification
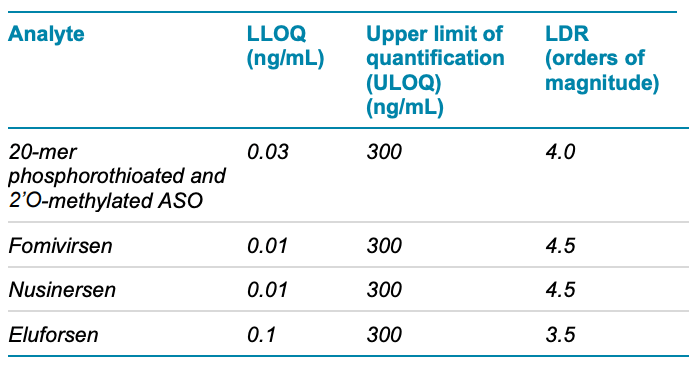
- Low-level quantification: Achieve low-level (10–100 pg/mL) lower limits of quantification (LLOQs) for ASOs in rat plasma for pharmacokinetic studies with limited sample availability using the SCIEX 7500 system (Table 1)
- Enhanced sensitivity with microflow LC: Perform sensitive, quantitative analysis of oligonucleotides with a simple and easy-to-operate direct inject microflow LC platform
- Robust analytical performance: Achieve accurate quantitative performance with %CV values <15% at all concentration levels across a linear dynamic range (LDR) spanning ≥3.5 orders of magnitude
- Single software control: Easily develop and optimize quantitative workflows using the M5 MicroLC system with seamless integration into SCIEX OS software. Employ a single platform for streamlined method development, data acquisition, processing and management with SCIEX OS software.
Table 1. Quantitative results for different ASOs in rat plasma using a direct inject microflow LC method and the SCIEX 7500 system.
Methods
Samples and reagents: Fomivirsen, nusinersen, eluforsen, a model fully phosphorothioated 2’O-methylated oligonucleotide with the sequence mU*mA*mU*mC*mC*mG*mC*mC*mU*mC*mG*mU*mG*mA*m G*mA*mA*mG*mA*mU and an internal standard with the sequence CATGGTCCTGCTGGAAGTTCGTG were purchased from IDT. The ion-pairing reagents 1,1,3,3,3- hexafluoroisopropanol (HFIP, ≥ 99.8%) and diisopropylethylamine (DIEA, ≥ 99.5%) were purchased from Sigma Aldrich. Ethylenediaminetetraacetic acid (EDTA) was also purchased from Sigma Aldrich.
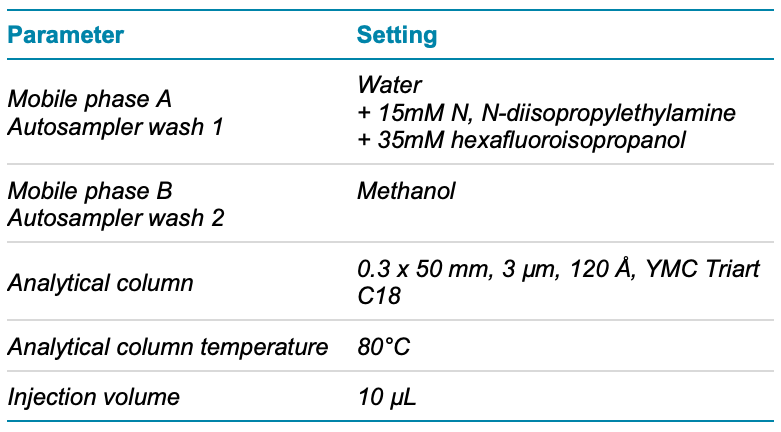
Sample preparation: Calibration curves were prepared by spiking analytes and internal standard (500 ng/mL) into extracted rat plasma (Sprague Dawley, K2 EDTA, BioIVT). The 1 mL plasma samples were extracted using Clarity OTX solid phase extraction (SPE) cartridges (Phenomenex) following the manufacturer’s protocol for extracting oligo therapeutics from biological samples. After drying with nitrogen gas at 40°C, the plasma extract was reconstituted in 1 mL of mobile phase A (Table 2) containing 100µM EDTA.
Chromatography: The M5 MicroLC system was used in direct inject mode with a 10 µL/min flow rate. The gradient and other chromatographic conditions used and column information are summarized in Figure 1 and Table 2. A volume of 10 µL of the reconstituted sample was loaded directly onto the microflow LC column.
Figure 1. LC method embedded in SCIEX OS software. Gradient table for analytical separation.
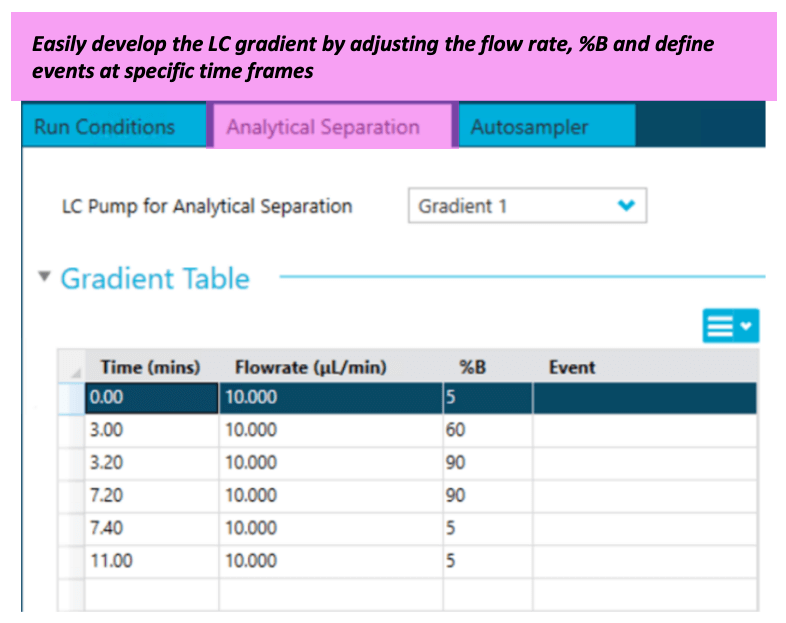
Table 2. Chromatographic conditions.
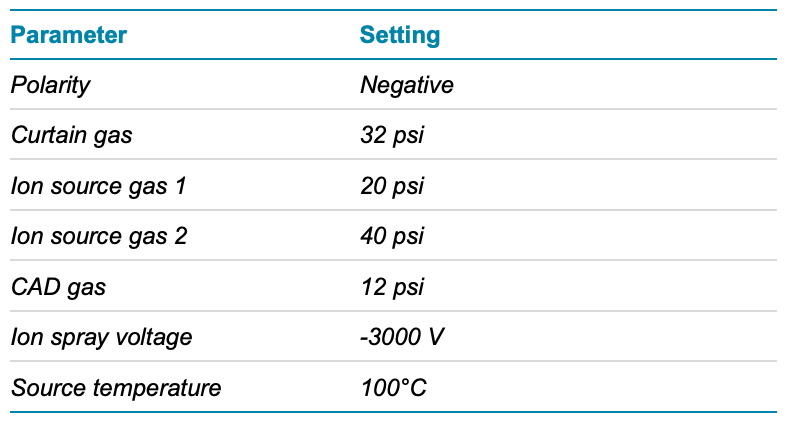
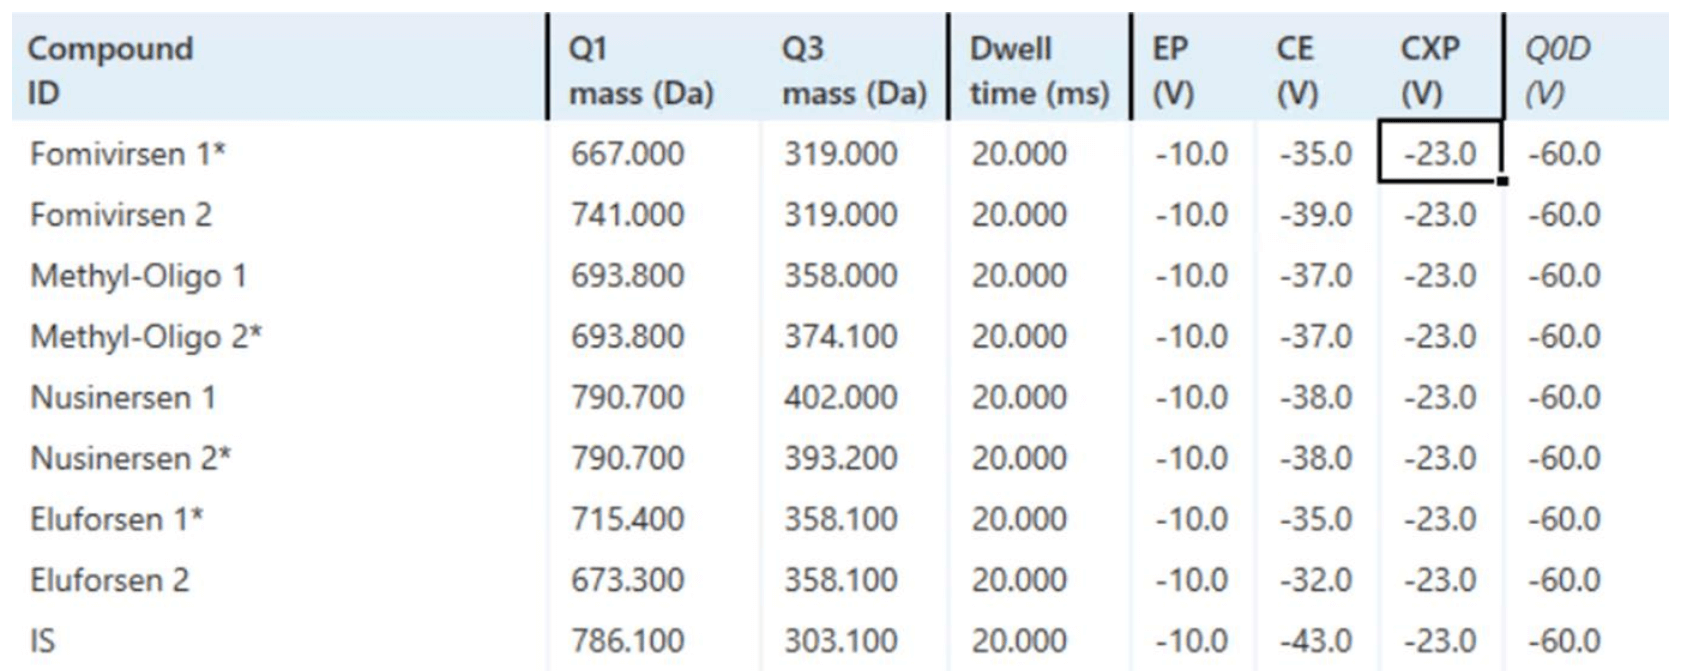
Mass spectrometry: A SCIEX 7500 system with an OptiFlow Pro ion source with an E Lens probe and a micro (low) electrode was used in MRM mode. All source and MS parameters were optimized (Table 3 and Figure 2). The MS method included 2 MRM transitions for each analyte and 1 MRM transition for the internal standard (IS).
Table 3. Source conditions.
Data processing: MRM data were processed with SCIEX OS software using the MQ4 integration algorithm. A 1/x2 weighting was used for quantification.
Figure 2. MRM transitions and parameters for the oligonucleotide quantification workflow. Compounds marked with an asterisk (*) were used for quantification.
End-to-end workflow for microflow LC-based analysis
The M5 MicroLC system is integrated with the SCIEX OS software, allowing users to control LC parameters in a single streamlined, user-friendly interface. The software is intuitive and allows for easy method development and optimization of important parameters. In the LC method module, users can view and control the instrument run conditions (Figure 3A), LC gradient (Figure 1) and autosampler parameters (Figure 3B). Users can also monitor real-time LC pressure traces for the microflow column to aid in diagnostics throughout the analysis.
Figure 3. M5 MicroLC system integration with SCIEX OS software enables users streamlined control of the LC system. A microflow LC method can be created and edited using the sub-modules of the LC module, including "Run Conditions," "Analytical Separation" and "Autosampler." The "Run Condition" module (A) allows users to view and edit instrument flushing parameters. The "Autosampler" module (B) provides parameters related to autosamplers, such as injection and wash.
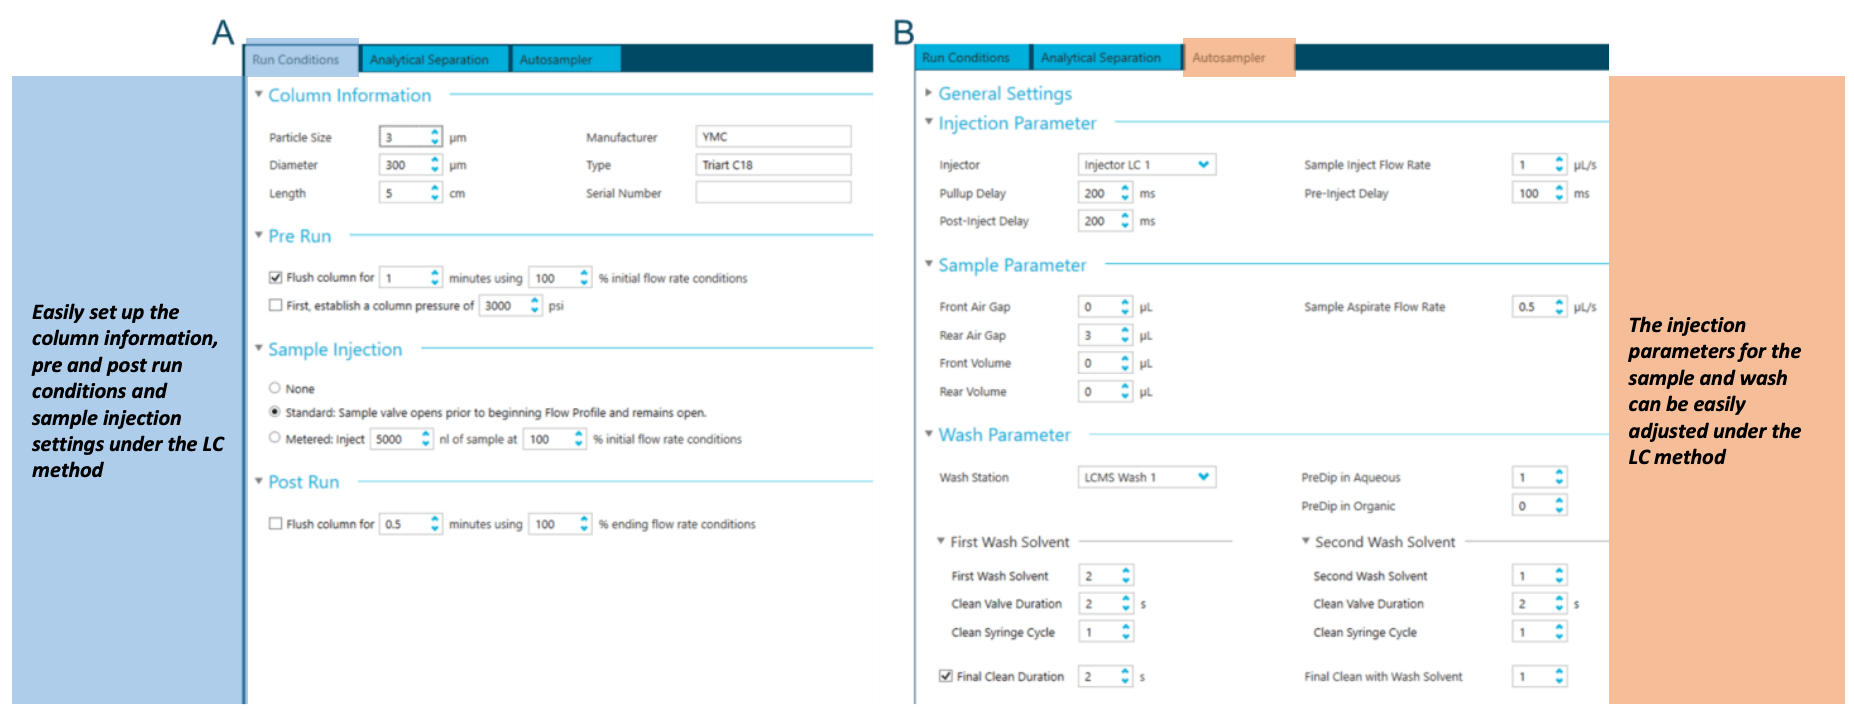
Figure 4. SCIEX OS software offers a single platform for method development, acquisition and data analysis. Easily perform data acquisition using features such as “Batch,” “Queue,” “MS Method,” “LC Method” and “MS Tune.” Evaluate the collected data using the Explorer and Analytics modules in SCIEX OS software.
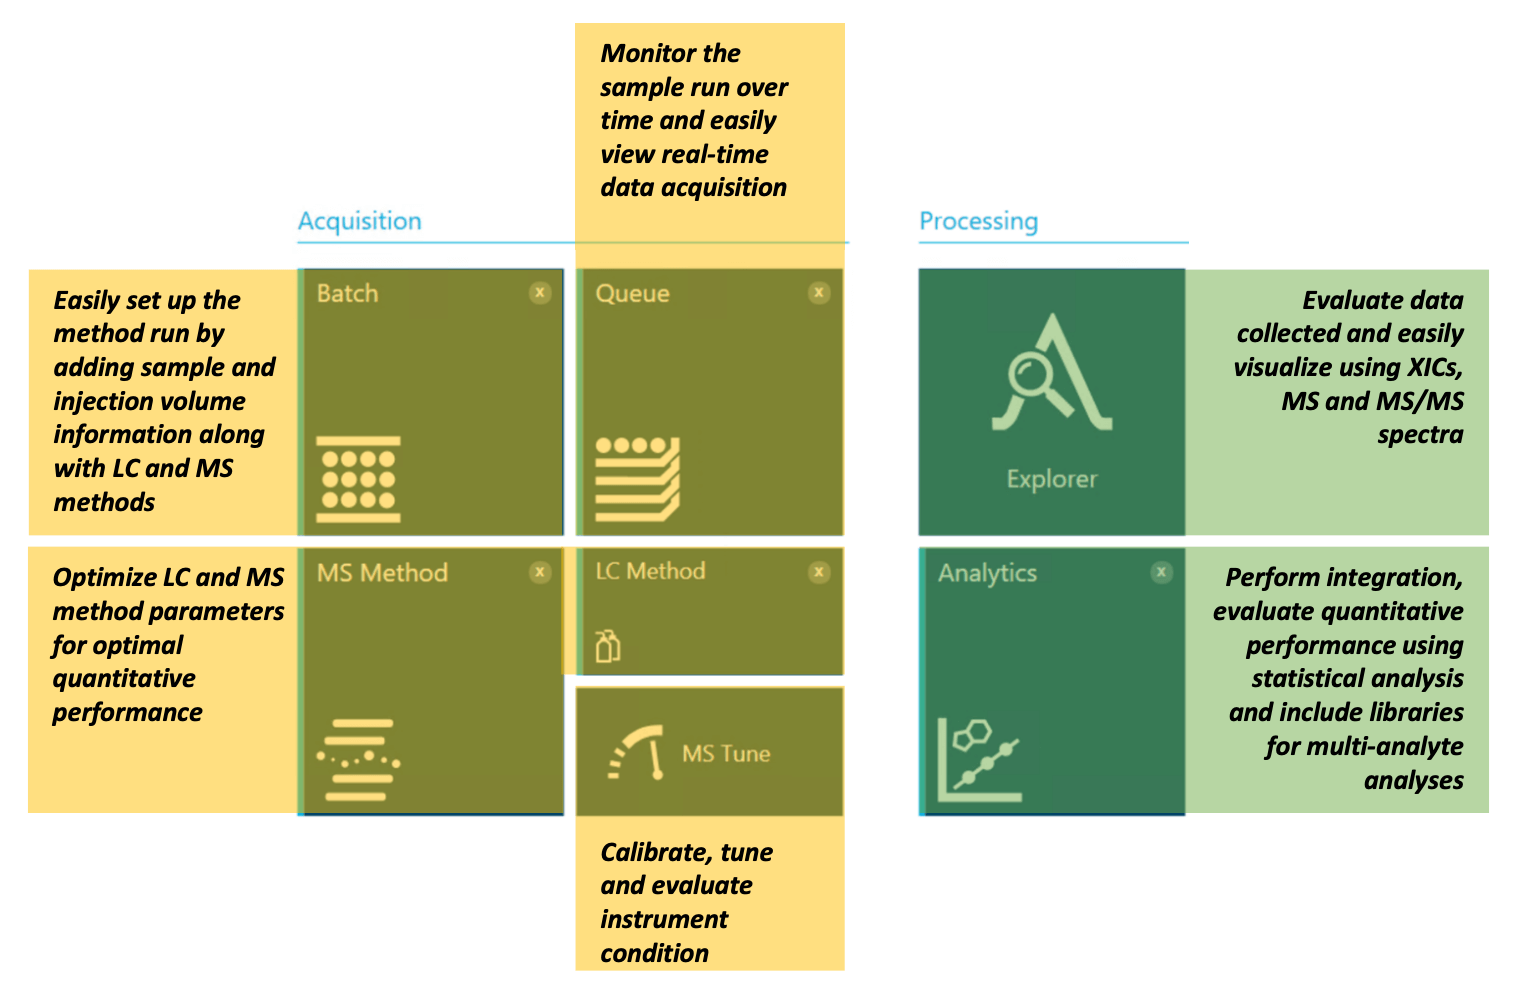
SCIEX OS software offers several controls for data acquisition and processing (Figure 4). Batch and Queue modules allow users to run and monitor samples during data acquisition. Acquisition controls further allow users to perform MS tuning, microflow LC and MS method setup. The processing component of SCIEX OS software contains tools for data analysis, including the Explorer and Analytics modules.
Results and discussion
Baseline separation was achieved for the 4 oligonucleotides and the internal standard (Figure 5). The MRM transitions used for the quantification of oligonucleotides and their metabolites or impurities often share the same fragment. Additionally, there can be overlap among precursors because many charge states have similar intensities. These confounds therefore necessitate the chromatographic separation of all analytes and the internal standard.
Figure 5. Extracted ion chromatograms (XICs) for the MRMs of 4 ASOs and the IS. Two MRM transitions were used for each analyte and 1 MRM transition was used for IS. Baseline separation was achieved using a 3 min gradient.
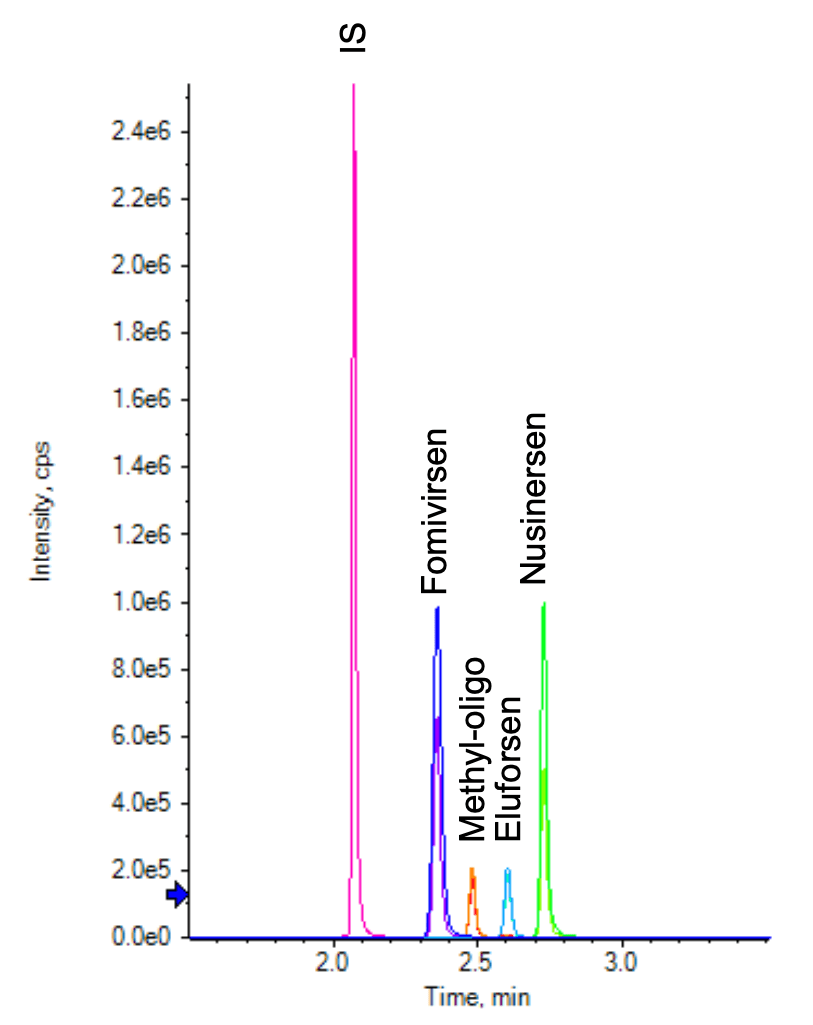
Figure 6. Calibration curves based on IS-adjusted XIC areas for each of the oligonucleotides. Linear dynamic ranges spanned 3.5 to 4.5 orders of magnitude.
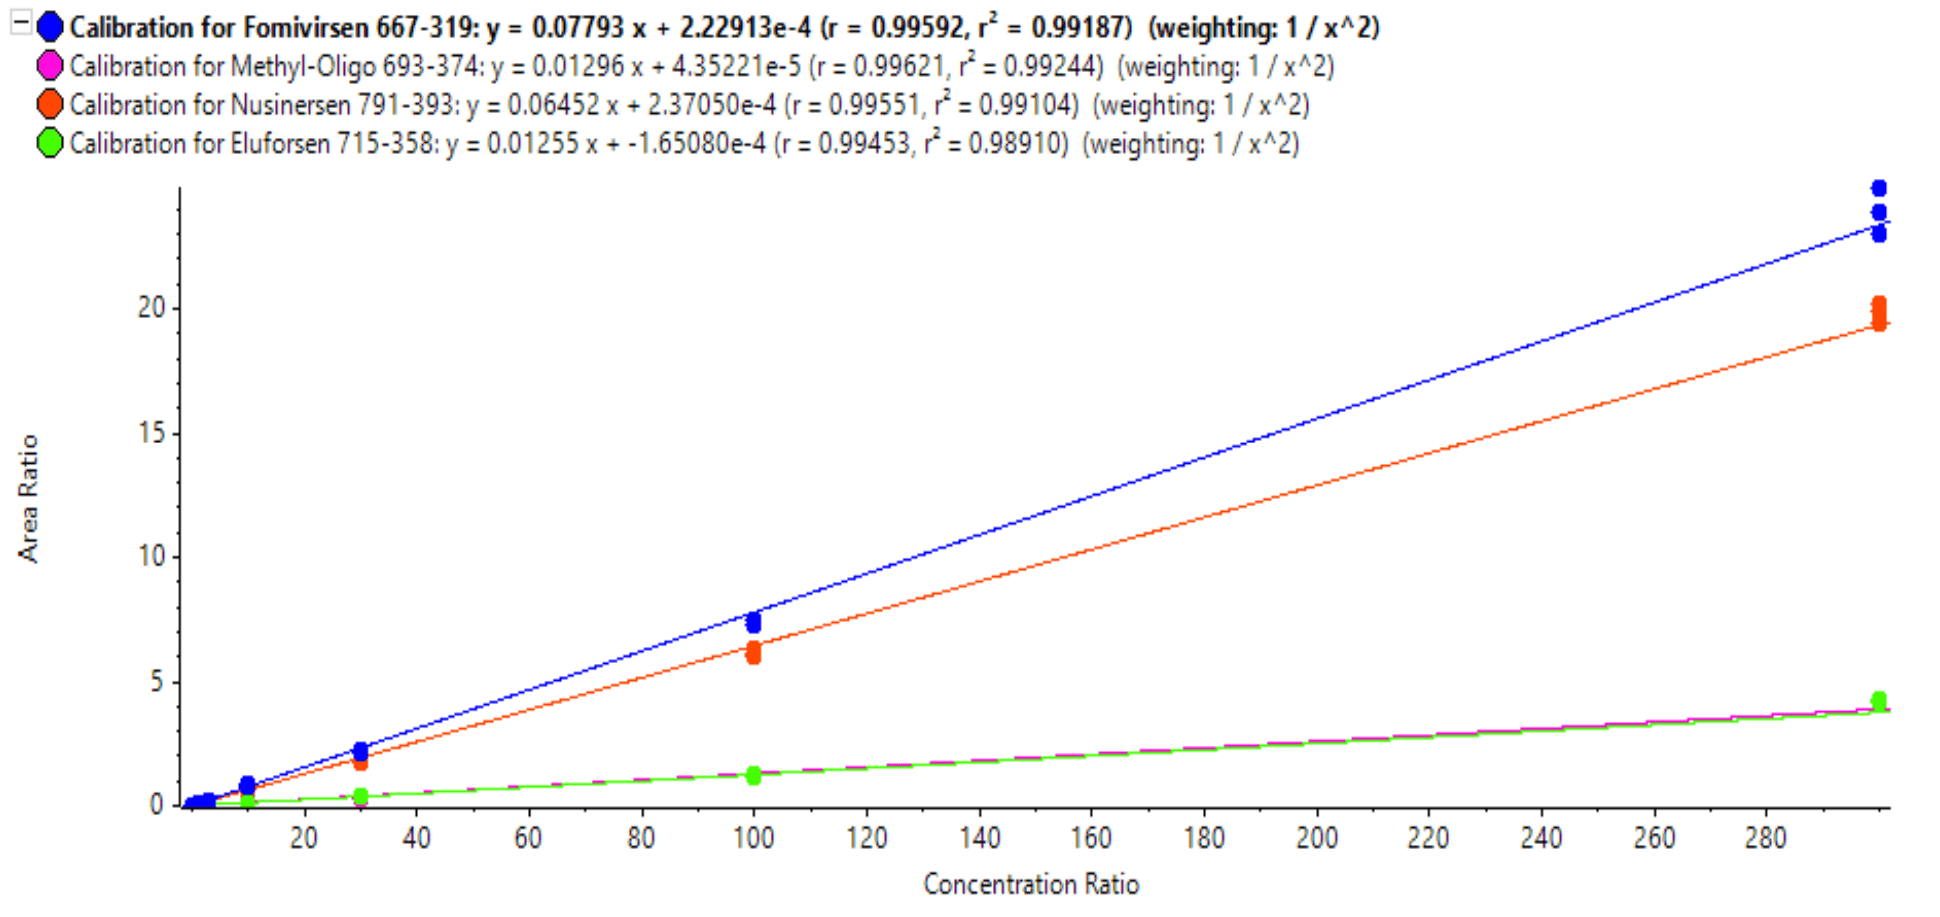
Calibration curves were measured in triplicate for all the analytes by spiking the analytes into plasma extract at concentrations ranging from 0.01 ng/mL to 300 ng/mL (Figure 6). LLOQs and linear calibration curve ranges were determined based on precision and accuracy calculations (Table 4). The %CV of the calculated mean of the concentration was expected to be <20% at the LLOQ and <15% at all higher concentrations. Additionally, the accuracy of the calculated mean was expected to be between 80% and 120% at the LLOQ and between 85% and 115% at higher concentrations.
The LLOQs for fomivirsen and nusinersen were 0.01 ng/mL. The observed LLOQs matched the LLOQ observed using 30 µL of sample and the trap-and-elute method, as previously described. 1 However, the S/N ratio observed using the 10 µL direct injection method described in this technical note was 3–4x lower than the S/N ratio previously observed. As a result, the LLOQs observed here for fomivirsen and nusinersen are theoretically lower than those previously measured. 1 Together, these results indicate that the direct inject workflow offers a highly sensitive method to analyze and quantify ASOs.
Table 4. Calculated concentration, precision and accuracy for each oligonucleotide at each concentration.
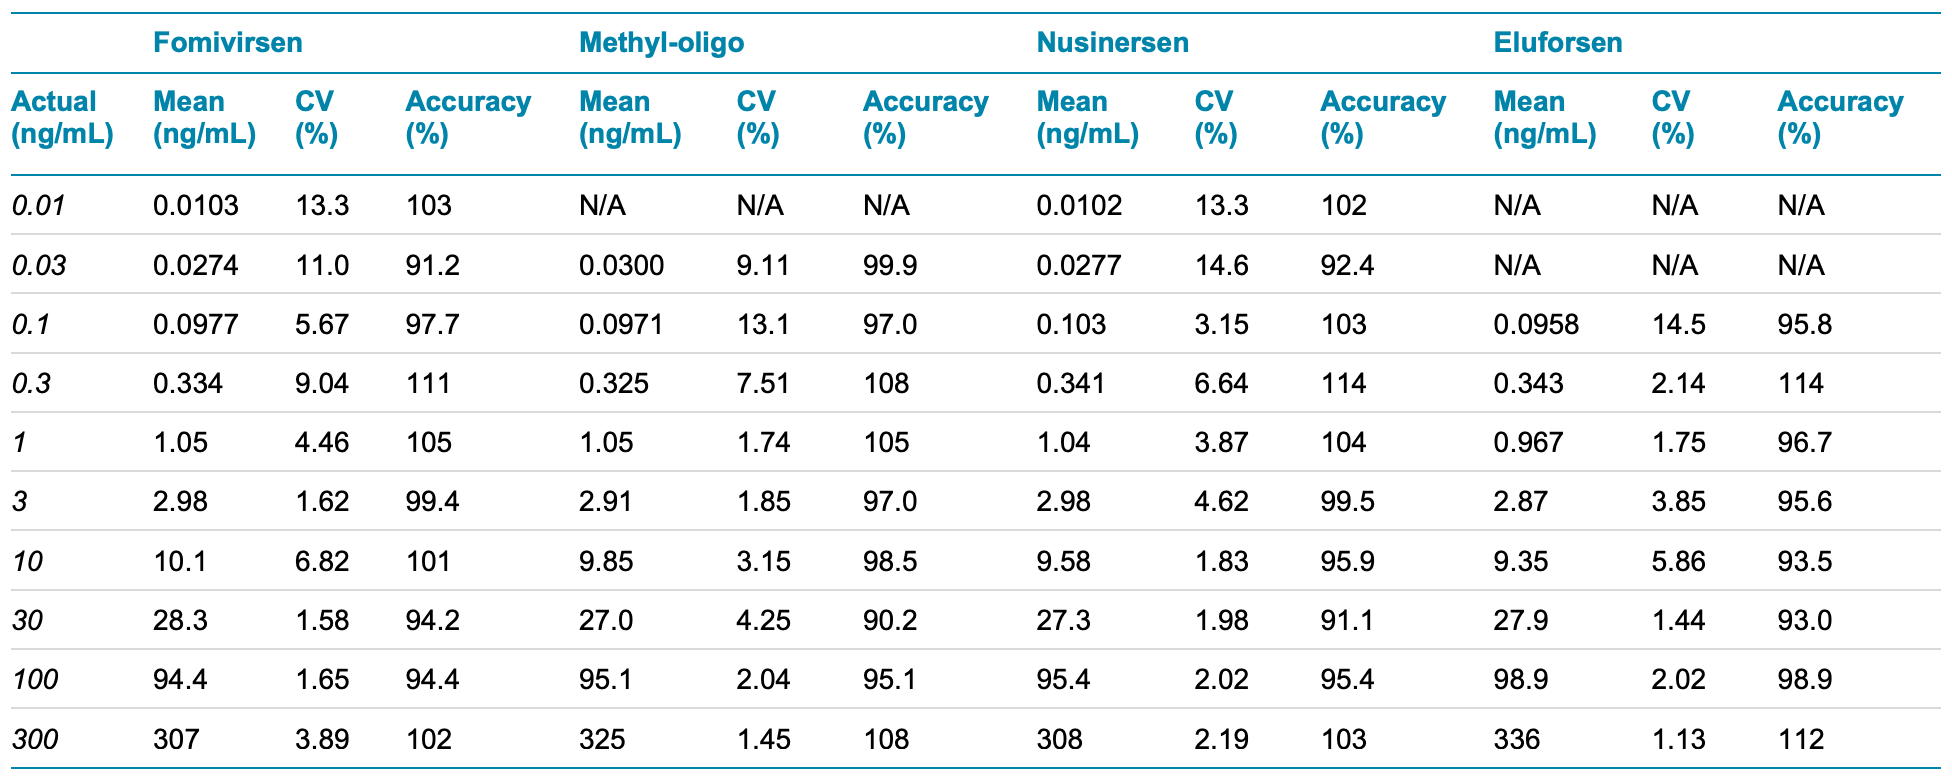
Figure 7. XICs for the MRM transitions of each analyte. XICs for blanks injections of extracted plasma (left) and ASOs at their respective LLOQs (right) are shown. No noticeable interferences were observed in the matrix blanks.
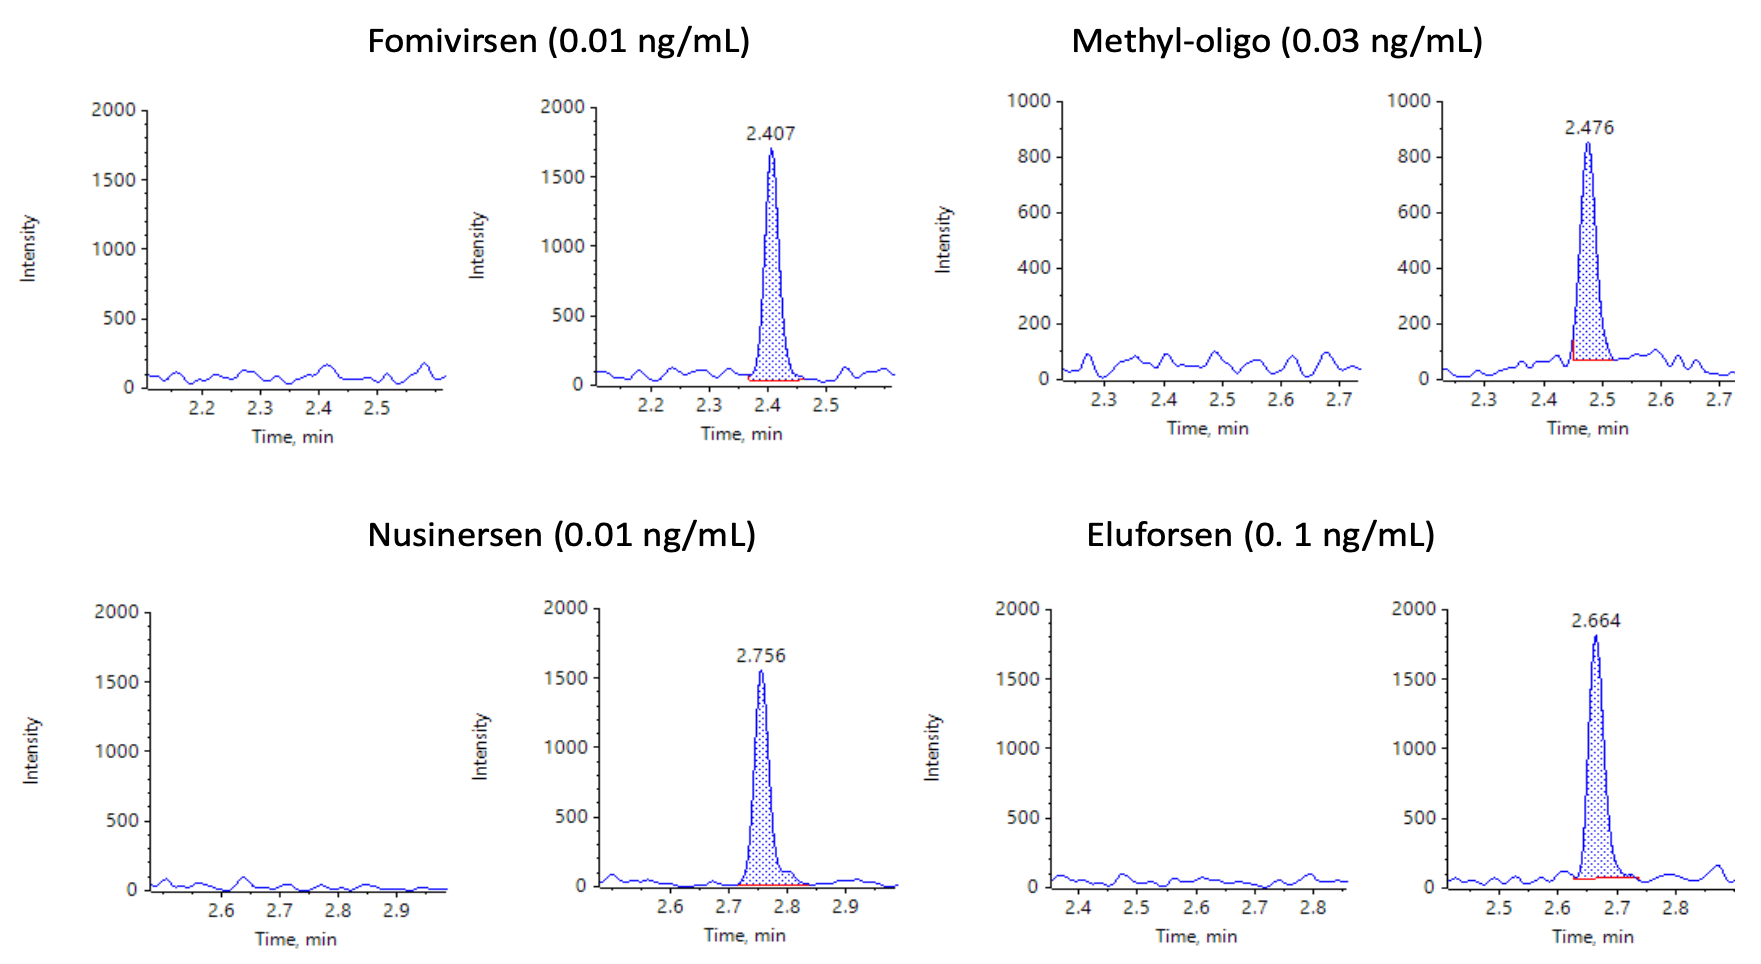
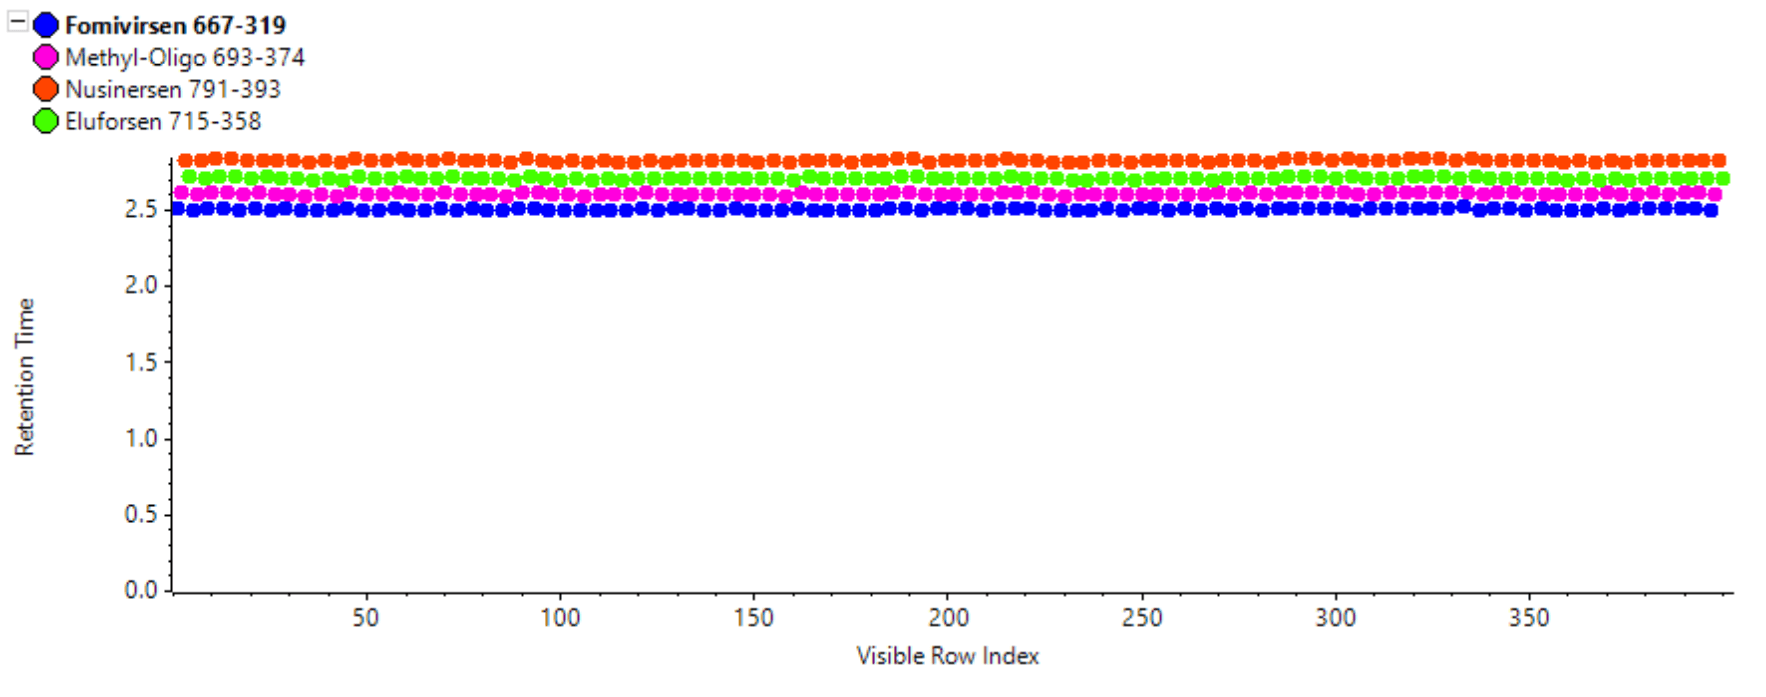
Figure 8. Retention time as a function of 100 consecutive injections. The observed RSD was <0.3% for each oligonucleotide.
For the methyl-oligo and eluforsen, the LLOQs and S/N ratios observed were 3x lower than the trap-and-elute method, 1 which corresponds to the smaller sample volume injected. ULOQs were also higher by a factor of 3 and the LDR spanned 3.5–4.5 orders of magnitude.
Figure 7 shows the XICs of all analytes for a blank extracted plasma injection (left) and at their respective LLOQ levels (right). No significant interferences were observed, illustrating efficient clean-up of the plasma matrix using the Clarity OTX SPE cartridges.
Carryover of approximately 0.3% was observed in the first blank after injecting the ULOQ sample. While still high, the observed carryover was lower than the 0.5% carryover that was previously reported with the trap-and-elute method.1 The carryover was not from the autosampler and instead originated in the column and/or tubing. The carryover observed in this workflow might have been lower than that in the trap-and-elute method because an additional trap column was not required. The carryover could be further reduced by adding additional wash steps in the gradient method if the full linear range is required or alternatively, the ULOQ could be lowered. To evaluate the robustness of the direct inject method, 100 consecutive injections of the rat plasma spiked at the 10 ng/mL level were performed. Figure 8 illustrates a retention time stability of <0.3% RSD, which was achieved for all 4 analytes.
Conclusion
- Low LLOQs (10–100 pg/mL) were achieved for ASOs in rat plasma using a direct inject microflow LC method and the SCIEX 7500 system
- A simple direct inject microflow LC method was developed for the quantification of ASOs in rat plasma
- Up to 25–50x lower solvent consumption compared to an analytical flow method resulting in significant savings in expensive, high-purity modifiers, such as hexafluoroisopropanol
- Lower solvent consumption promotes robustness by reducing the level of ion-pairing reagents introduced into the mass spectrometer
- A seamless integration of the M5 MicroLC system with SCIEX OS software was demonstrated for the quantification of oligonucleotides
- User-friendly and streamlined integrated data acquisition, processing and reporting were performed using the SCIEX OS software as a single platform
References
- Achieving best in class sensitivity for antisense oligonucleotides in plasma using trap-and-elute microflow LC. SCIEX technical note, RUO-MKT-02-13206-A.