Abstract
Insulin is a peptide hormone responsible for maintaining blood glucose levels. Disulfide bonds link the alpha and beta chains of insulin together. The reducing agent, tris(2- carboxyethyl)phosphine (TCEP) is commonly used to break the disulfide bonds and produce the free alpha and beta chains. The presented study rapidly analyzed 70 nL of sample for insulin and its alpha and beta chains. The assay successfully quantified insulin at 82.2 pM for 2 different charge states via the Echo® MS+ system with Zeno TOF 7600+ system at a rate of 7 seconds per sample.
Key features of the rapid analysis of reduced insulin
- Low-ng/mL level quantitation of insulin: Detect insulin at concentrations as low as 82.2 pM for 2 charge states
- Rapid analysis: Perform TOF MS scans on 70 nL of sample at a rate of 7 seconds per sample on wide peak mode to obtain high-quality data for insulin and its alpha and beta chains.
- Linear quantitation via acoustic ejection: A linearity ranging 8.4 to 168.4 µM was achieved through rapid quantitation for insulin
- Disulfide reduction analysis: Reduce disulfide bonds to produce free alpha and beta chains for quantitation and/or characterization
Introduction
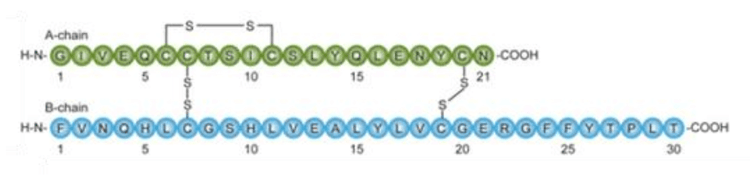
Insulin is a dipeptide hormone that maintains blood glucose levels by facilitating cellular glucose uptake. Insulin also regulates carbohydrate, lipid and protein metabolism, and promotes cell division and cell growth. The alpha and beta chains of insulin are linked by disulfide bridges and contain 21 and 30 amino acids respectively1 (Figure 2).
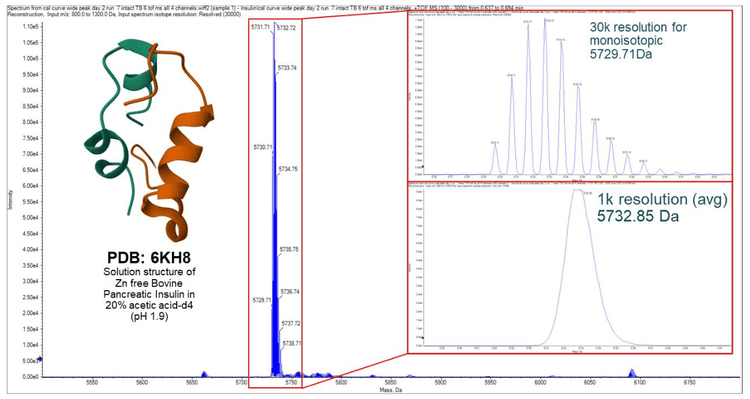
The Echo® MS+ system with ZenoTOF 7600+ system enables fast characterization of proteins, sensitive quantitation of small and large molecules and efficient evaluations of kinetic reactions while consuming only nanoliters of sample. Here, a high throughput method for analyzing insulin was developed, and data was acquired at a rate of 7 seconds per sample. An insulin concentration curve was analyzed utilizing the TOF-MS scan. The mass reconstruction workflow enabled insulin quantitation based on all 5 of its charge states rather than commonly used MRM methods which quantify insulin based on one charge state.
The reducing agent TCEP was added to insulin to drive its reduction into alpha and beta chains. The process was rapidly monitored across 6 different concentrations of insulin in water.3 The conversion from insulin to its individual alpha and beta chains was analyzed and the data was processed in Explorer and Analytics within SCIEX OS software using the mass reconstruction workflow.
Methods
Sample preparation: Using INTEGRA Biosciences (Hudson, New Hampshire, USA.), a 2-fold serial dilution of insulin was created across an Echo® MS+ system qualified 384-well plate. Insulin concentrations ranged from 86.2 µM to 41.1 pM. For the kinetic study, insulin (bovine pancreas Sigma I5500) was diluted in water to make concentrations of 1.68, 8.42, 16.8, 42.1, 84.2, and 168 µM. A total of 50 µL of aliquot of each concentration was plated to an Echo® MS system qualified 384-well plate with 10 µL of either water (control) or TCEP (test case) was added to the well. The plate was then centrifuged at 3000 rpm for 5 minutes to ensure no air bubbles and a flat meniscus before shaking.
Acoustic Ejection: A total of 70 nL of the sample was acoustically ejected using wide peak mode with an ejection interval of 7 seconds. A flow rate of 550 µL was selected for the carrier solvent which consisted of 30:30:40 (v/v/v), acetonitrile/methanol/water with 0.1% formic acid.
Mass spectrometry: A TOF-MS method was developed and optimized to detect the 5 charge states of insulin (Tables 1 and 2). This same method was employed to detect the charge states of the insulin beta chain after reducing insulin with TCEP.
Data processing: Data was qualitatively processed using Explorer within SCIEX OS software. A quantitative method of insulin was optimized using mass reconstruction workflow in the Analytics of SCIEX OS software.


Insulin TOF-MS
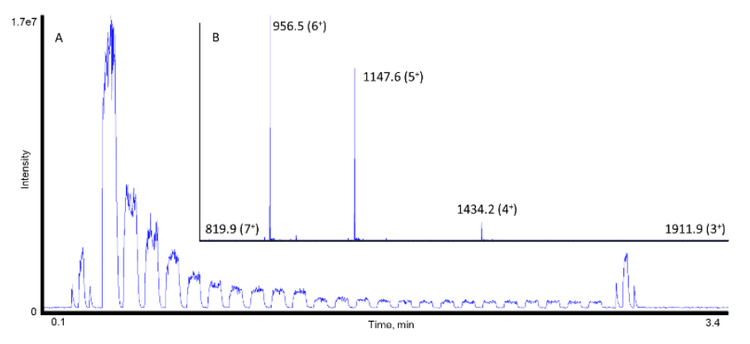
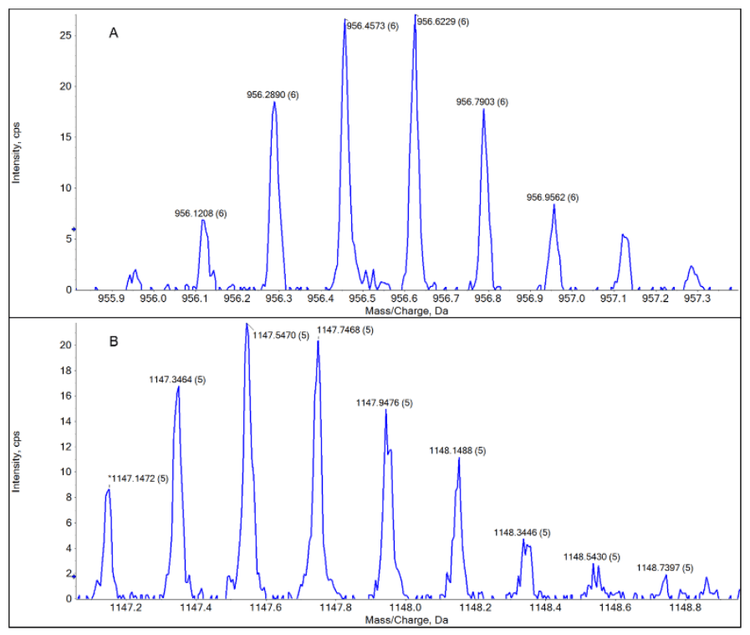
Insulin was analyzed using the TOF-MS acquisition method as detailed in Table 1. Within the Echo® MS+ system with ZenoTOF 7600+ system, the insulin samples were ejected and analyzed at 24 different concentrations ranging from 41.1 pM to 86.2 µM. Insulin’s 5-different charge states were clearly observed after a 7-second acoustic ejection using the Echo® MS+ system with ZenoTOF 7600+ system (Figure 3). The total analysis time was 3.5 minutes. The lowest quantifiable peaks for 2 of insulin’s 5 charge states were detected at 82.2 pM (Figure 4).
Disulfide reduction study
The reduction was performed to show that protein reaction kinetics can be rapidly monitored with the Echo® MS+ system with ZenoTOF 7600+ system. The controls and the test cases were added to the Echo® MS+ system qualified 384-well plate as described in the “sample preparation” section. The plate was shaken for 15 minutes at 37°C and was subsequently analyzed using the same acoustic ejection and TOF-MS methods as previously described.
After TCEP treatment, the disulfide bond was broken on all 6-standards and a concentration curve of the insulin beta chain, charge state 1141.6 (3+), was observed (Figure 5).


Conclusions
- Achieved a high-throughput quantitative analysis of intact and reduced insulin
- Analyzed insulin samples at a rate of 7 seconds per sample using wide peak mode
- Quantitation was performed using the mass reconstruction workflow in Analytics of SCIEX OS software
References
- G. Wilcox. Insulin and Insulin Resistance. Clin Biochem Rev. 2005 May; 26(2): 19-39.
- G. Litwack. Chapter 6 – Pancreatic Hormones: Insulin and Glucagon. Fourth Edition, Academic Press, 2022; Pages 123-157.
- W.R. Gray. Disulfide Structures of Highly Bridged Peptides: A New Strategy for Analysis. Protein Science. 1993, 2, 1732-48.
- INS - Insulin - Bos taurus (Bovine) | UniProtKB | UniProt