Abstract
This technical note highlights the utility of SCIEX's flexible solution for intact MAM within SCIEX OS software. This example shows the drug antibody ratio (DAR) monitoring for antibodydrug conjugates (ADCs). The streamlined MAM data flow from data acquisition to data processing in compliance-ready SCIEX OS software will also be demonstrated.
Introduction
ADCs are biotherapeutics composed of small molecule drugs conjugated to an antibody scaffold. An ADC molecule consists of three components: monoclonal antibody, linker, and cytotoxic drug. As a result, ADCs have a very complex molecular structure with macromolecules and small molecule characteristics. The information about the average DAR is essential for assessing ADC qualities. For instance, a low DAR could reduce the efficacy of a drug. Therefore, DAR values are one of the critical quality attributes (CQAs) for the therapeutic index of ADCs.
In this technical note, we demonstrate SCIEX's intact MAM workflow in DAR determination of a cystine-linked ADC from monkey and mouse plasma. A time course study was performed to showcase the streamlined LC-MS based workflow, combining SCIEX high-resolution QTOF mass spectrometry with user-friendly data analysis software.
Key features of SCIEX's intact MAM solution for DAR monitoring
- High throughput: DAR monitoring for a large sample set
- Intuitive software: Powerful product attribute definition, tracking, and quantification with flexible custom calculations for CQAs based on specific user needs.
- Streamlined solution: Complete software solution for acquisition and quantitative tracking of DAR changes.
- Compliance-ready: DAR quantification and monitoring are performed in compliance-ready SCIEX OS software.content here
Methods
Sample preparation:
Vorsetuzumab Mc-VC-PAB-MMAE ADC was purchased from Creative Biolab Inc., (Shirley, NY). Human, monkey, mouse plasma, and PBS samples were incubated with vorsetuzumab MMAE ADC (30 µL, 0.1 mg/mL) for time intervals of 0, 24, 48, and 72 hrs. These samples were diluted with HBS-EP buffer (260 µL), followed by the addition of biotinylated human CD27 ligand as antigen of vorsetuzumab (10µL of 0.2 mg/mL aqueous solution). The mixture was incubated at room temperature for 15 minutes to generate conjugates with biotinylated human CD27 and vorsetuzumab MMAE ADC. Subsequently, streptavidin immobilized magnetic beads (Dynabeads M-280 streptavidin) were suspended into the resulting mixture and incubated at room temperature for 15 minutes with continuous mixing. After incubation, the resulting magnetic beads collected from the mixture were washed with HBS-EP buffer twice.
The biotinylated vorsetuzumab MMAE ADC was released from the streptavidin magnetic beads using a pre-mixed PNGaseF reaction solution (1uL of rapid PNGaseF diluted with 37°C prewarmed MilliQ water). Then it was incubated at 37°C for 60 minutes to conduct on-bead deglycosylation. After collecting the magnetic beads from the rapid PNGaseF reaction mixture, the beads were washed with HBS-EP buffer. The vorsetuzumab MMAE ADC captured on the beads was eluted with 50 uL of acetonitrile/MilliQ water/formic acid (10/90/0.01 V/V/V). The eluates were treated with 10 mM TCEP at a final concentration for 30 minutes at 37°C to reduce the intra-chain disulfide bond of the ADC. The reduced ADC sample was injected into a TripleTOF 6600+ system with a UPLC system.
Chromatography:
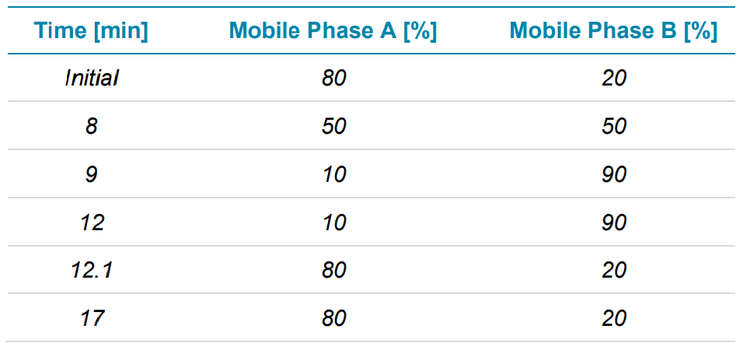
Subunits were separated using an ACQUITY BEH protein C4 1.7 um, 2.1 x 50 mm analytical column (Waters), which was kept at 80°C in the column oven of a Nexera 30A (Shimadzu) UHPLC system. Table 1 shows the LC gradient used for subunit separation at a flow rate of 0.3 mL/min with mobile phases A and B consisting of 0.1% formic acid in water and 0.1% FA in acetonitrile, respectively.
Mass spectrometry:
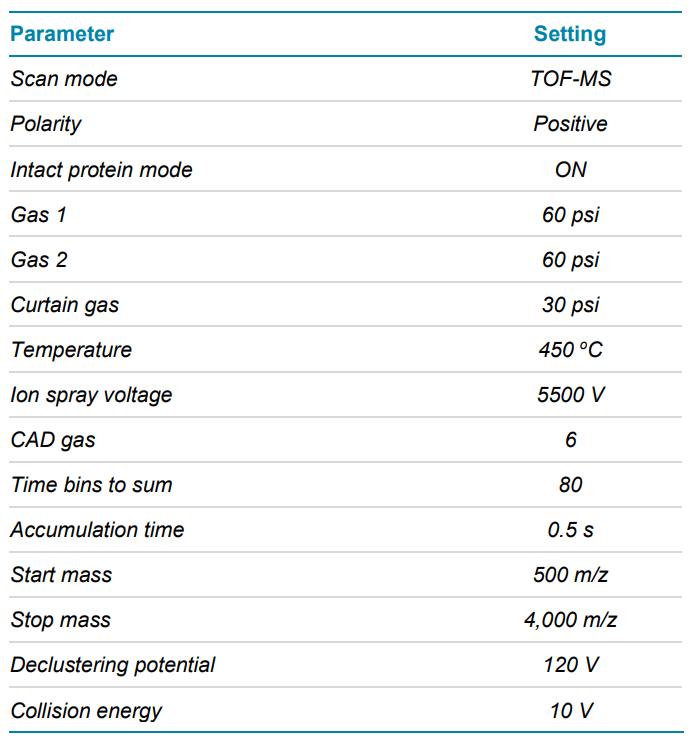
LC-MS data were acquired using the TripleTOF 6600+ system. The key TOF parameters are listed in Table 2.
Data processing:
Reconstruction and average DAR calculation of cystine-linked ADCs were performed in compliance-ready SCIEX OS software, version 2.2.
Data collection for DAR calculations
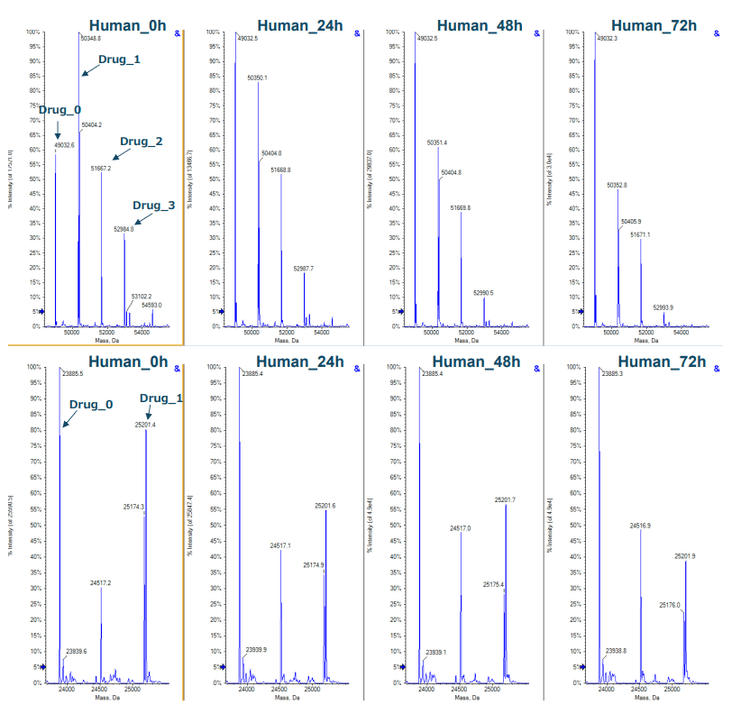
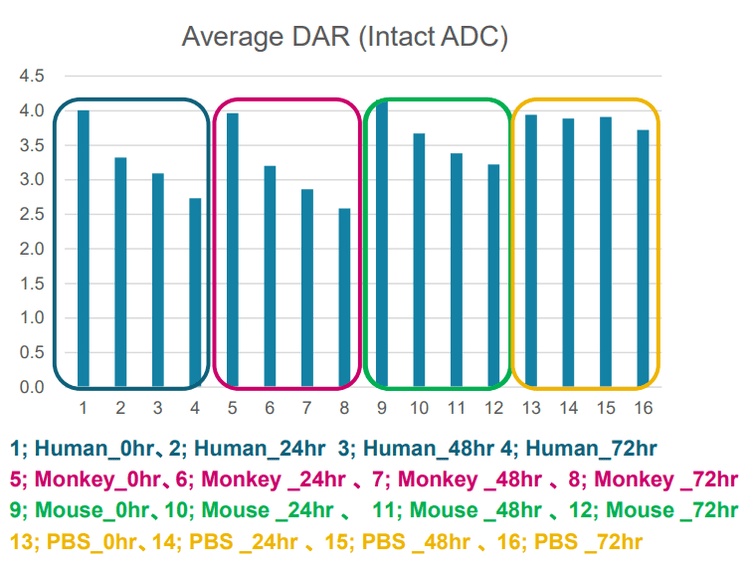
Compared to traditional antibodies, ADCs go through more potential biotransformations with a payload in vivo and in vitro, which can change DAR distribution significantly. 1 The change of in vivo DAR distribution of trastuzumab emtansine was recently reported in literature . 2,3 DAR is one of the CQAs that must be closely monitored during ADC manufacture and storage as it can affect drug efficacy and safety. In this work, a time course stability study was designed to investigate the changes of DAR distribution from incubation of vorsetuzumab in different plasma. Data were collected, evaluated, and reconstructed using SCIEX OS software over the time course study for vorsetuzumab MMAE ADC in human plasma, as shown in Figure 2. The ADC peaks with a different number of drug payloads were labeled in the reconstructed spectra. The dominant species observed for the heavy chain carried 0-3 drug molecules, while the light chain was mainly conjugated with 0 or 1 drug payload. The DAR distributions of both chains were shifted toward the lower payloads throughout incubation.
Method generation for DAR calculation
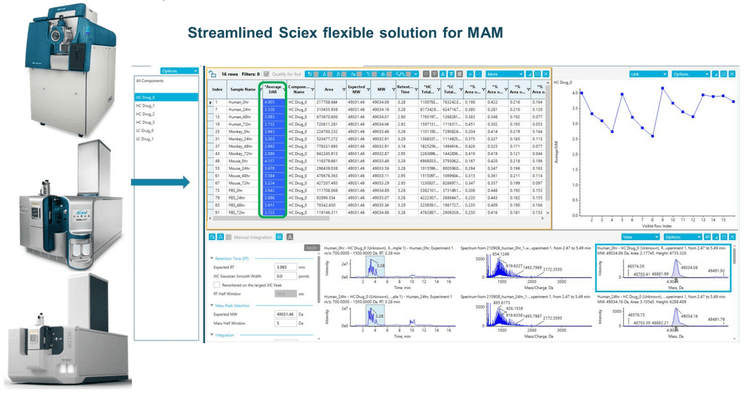
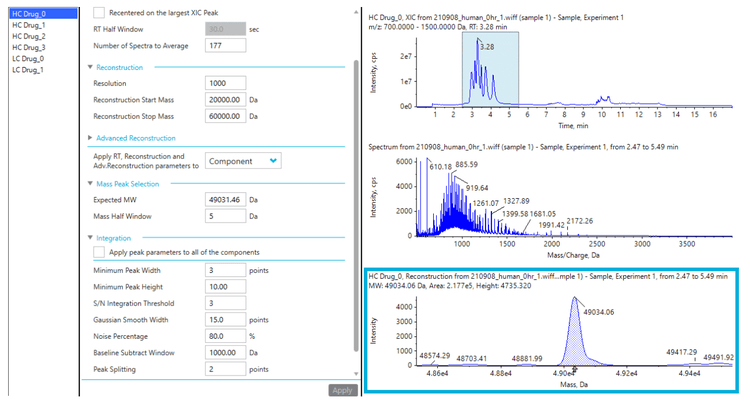
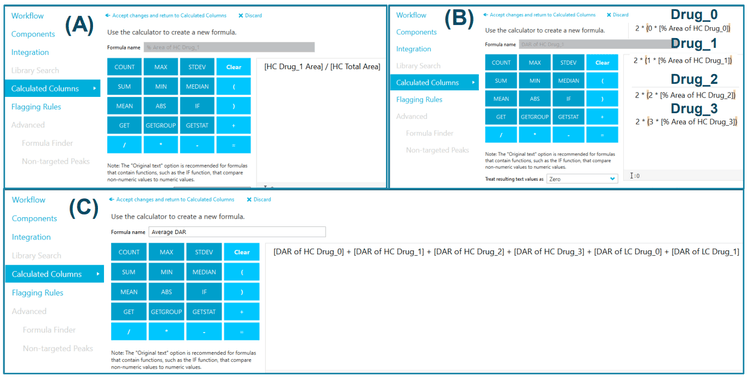
SCIEX OS software offers a simple and streamlined intact MAM solution4 . Attributes can be easily defined, and integration parameters for individual components can be adjusted to achieve accurate quantitation in SCIEX OS software, as shown in the previous technical note. 4 Figure 3 displays reconstruction and peak integration parameters for developing intact MAM. Using the advanced reconstruction parameters, the user can define the number of spectra to average, S/N threshold, resolution, and mass range for the assay. The attribute level can be calculated within each attribute group using flexible custom calculations. In this technical note, a method was built for automated DAR calculation, as shown in Figure 4. The percentage of peak area for each payload from each subunit was calculated using the formula displayed in Figure 4A. As vorsetuzumab MMAE ADC has two heavy chains and two light chains, the total ratio of each payload needs to be multiplied by 2, as shown in Figure 4B. Finally, the average DAR was calculated by adding all the ratios from each payload (Figure 4C).
Intact MAM for automated DAR monitoring
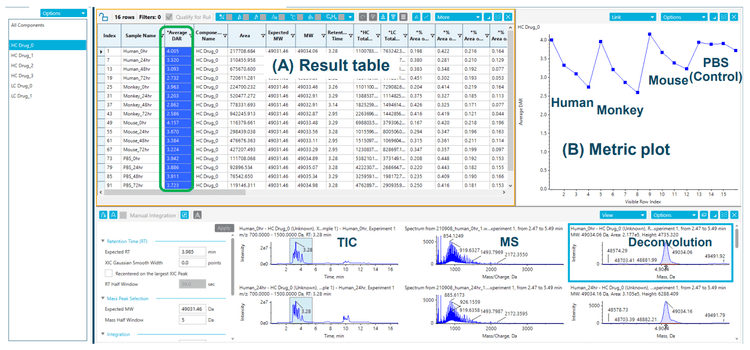
Vorsetuzumab MMAE ADC samples incubated with plasma were purified through immunocapture. On-bead reduction and deglycosylation were performed to reduce sample complexity, and a TripleTOF 6600+ system was employed to measure the ADC's heavy chain and light chain. Molecular mass and quantitative information of each subunit were obtained using SCIEX's intact MAM solution. The average DAR of the entire ADC can be calculated by building a custom formula within SCIEX OS software, as illustrated in Figure 4. Detailed result tables can be obtained and customized for accelerating data review (Figure 5). The table includes all the quantification results from intact MAM workflow, such as the ADC's absolute and percentage peak areas with a different number of drugs and average DAR (Figure 5A). The results can be sorted by sample, targeted attribute, or modification event.
Conclusion
- SCIEX's flexible solution for intact MAM within SCIEX OS software offers a powerful workflow for ADC analysis by providing a streamlined and compliant software package, from data acquisition through data analysis
- The combination of SCIEX high resolution mass spectrometry and streamlined software presents a cuttingedge solution for attribute monitoring in process development, enabling faster decision making
- The TripleTOF 6600+ system and SCIEX OS software provide an excellent DAR monitoring tool.
References
- Simone, chadt et al. (2019) Are Biotransformation Studies of therapeutic proteins needed? Scientific considerations and technical challenges. Drug Metab Dispos. 2019 Dec;47(12):1443-1456.
- Keyang, Xu et al (2013) Characterization of the drug-toantibody ratio distribution for antibody–drug conjugates in plasma/serum. Bioanalysis. 2013 May;5(9):1057-71.
- Kaur, Surinder (2013) Bioanalytical assay strategies for the development of antibody–drug conjugate biotherapeutics Bioanalysis. 2013 Jan;5(2):201-26
- Compliant Attribute Monitoring for Biopharmaceutical Product Quality Attributes Employing Intact Mass Analysis. SCIEX technical note, RUO-MKT-02-11314-A.