Subunit analysis of NISTmAb by capillary electrophoresis-sodium dodecyl sulfate (CE-SDS) and capillary isoelectric focusing (cIEF)
Marcia Santos
SCIEX, USA
Abstract
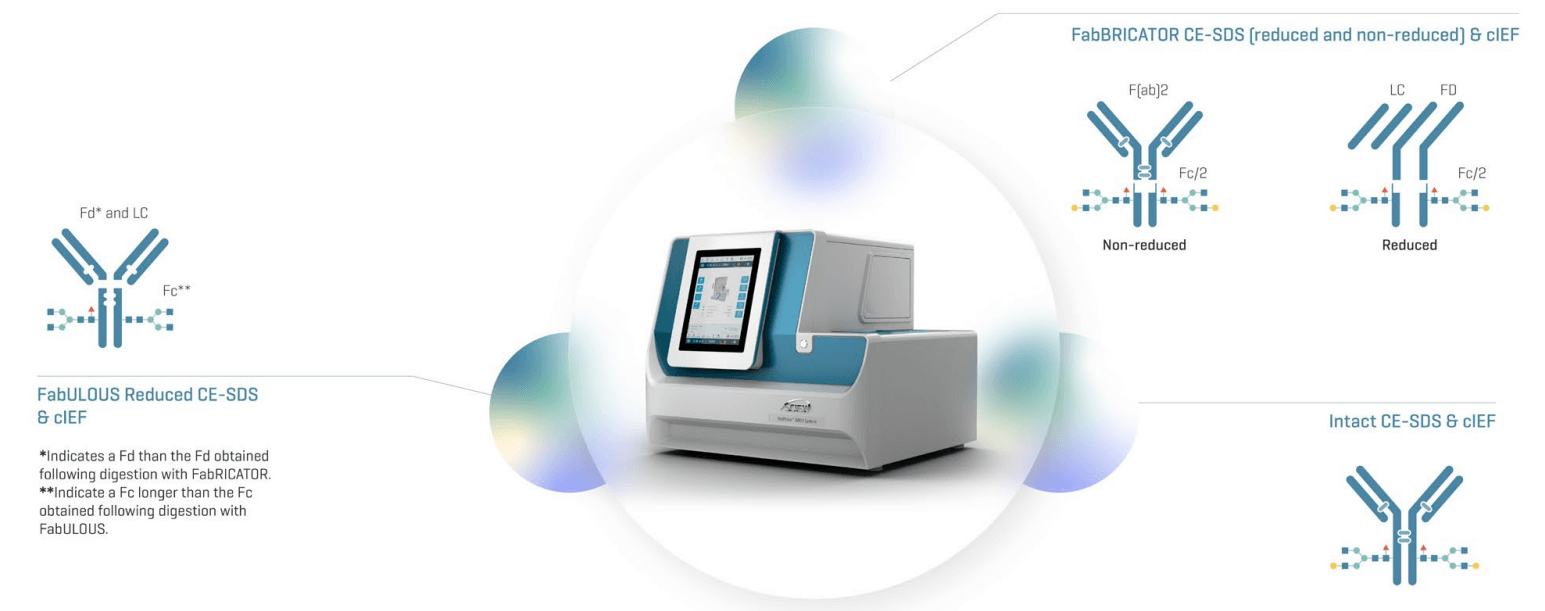
This technical note demonstrates a simple and effective workflow for characterizing the critical quality attributes of a protein therapeutic using CE-SDS and cIEF with UV detection. In this study, NISTmAb as a surrogate molecule employs intact and subunit strategies using the BioPhase 8800 system (Figure 1).
CE-SDS and cIEF with ultraviolet (UV) or laser-induced fluorescence detection (LIF) are well-known biochemical assays applied from discovery and screening through cell culture optimization, pre-clinical and clinical trials, to commercial release, as represented by the BioPhase 8800 and PA 800 plus systems.
In this workflow, we illustrate the importance of orthogonal assays and demonstrate how CE-SDS of subunits can assist in peak assignments of cIEF for subunit NISTmAb.
This experimental approach utilizes the Genovis Smart Enzymes FabULOUS and FabRICATOR for targeted digestion at and below the hinge region.
This procedure can be applied to other complex biotherapeutic proteins, particularly those requiring custom modifications for their clinical purpose.
Figure 1: Subunit characterization approach of NIST using CE-SDS and cIEF.
Key features of the intact and sub-unit analysis using CE-SDS
- Easy method development: Fast and efficient experimental conditions screening (CE-SDS and cIEF) reduces method development time from months to weeks
- Simple workflow: Easy-to-follow workflow enables sample digestion and preparation for CE analysis on the same day
- Comprehensive analysis: The flexibility of cIEF chemistry allows the separation under both native and denatured conditions
- Seamless method adoption: Workflow can be applied to both the BioPhase 8800 system and the PA 800 plus system
- Streamline development: rapid subunit analysis of common PTMs better enhances the ability to interpret and attribute charge heterogeneity shifts
Introduction
Protein therapeutics, including monoclonal antibodies (mAbs) and next-generation Ab molecules, are pivotal in enhancing health and quality of life for many. However, the analytical characterization of these molecules requires cutting-edge tools that provide reliable and robust methods to understand critical quality attributes. These attributes include common but noteworthy post-translational modifications such as oxidation, deamidation, glutamic acid cyclization, glycosylation, and C-terminal lysine clipping.1 Expression systems, such as cell line type or cell culture conditions, can induce these modifications, consequently impacting product safety, quality and efficacy.
Liquid chromatography (LC) combined with high-resolution mass spectrometry (HRMS) of intact or digested molecules is widely employed in the industry. However, despite the resolving power of these technologies, fully characterizing these molecules' complex heterogeneity still requires orthogonal strategies. Techniques such as cIEF and CE-SDS are instrumental in understanding structural changes due to post-translational modifications (PTMs) or fragmentation resulting from stability issues or production processes.2
In this study, NISTmAb was used as the test compound. It was analyzed by CE-SDS under non-reduced and reduced conditions before and after digestion with the Smart Enzymes from Genovis—FabRICATOR and FabULOUS. cIEF experiments were conducted to demonstrate this workflow with intact NISTmAb at near-native conditions (without urea) and NISTmAb subunits (figure 1).
The multi-capillary capabilities of the BioPhase 8800 system were instrumental in enabling the screening of reducing agents, CE-SDS sample buffer composition and pH, cIEF master mix conditions like ampholyte composition, urea concentration, focusing time for both intact and subunit analysis, significantly reducing overall development time.
In this work, the digested samples were split between CE-SDS and cIEF assays. Utilizing 2 BioPhase 8800 systems, the characterization process, following optimization, was completed within 2 weeks, encompassing the repeatability of sample preparation (results not shown).
Methods
Samples: NISTmAb, Humanized IgG1k Monoclonal Antibody (P/N: 8671) was from NIST (Gaithersburg, MD).
Reagents: The BioPhase CE-SDS Protein Analysis Kit (P/N: C30085) and cIEF Charge Heterogeneity analysis kit (P/NC30101) were from SCIEX. The Dithiothreitol (DTT) (P/N D5545 ), β-mercaptoethanol (β -ME) (P/N: M3148-25ML) and iodoacetamide (IAM) (P/N: I6125) were from Sigma-Aldrich (St. Louis, MO). The ampholyte mixtures 3-10 and (narrow range) were from Cytiva (Marlborough, MA).
Capillary cartridges: For the BioPhase 8800 system, the CE-SDS analysis was performed using a BFS capillary cartridge – 8 x 30 cm (P/N: 5080121) from SCIEX. The cIEF experiments were performed using a neutral coated capillary cartridge – 8x30 cm (P/N 5080119) also from SCIEX.
Capillary electrophoresis instrument and consumables: The BioPhase 8800 system (P/N: 5083590F) and a plate starter kit (P/N: 5080311) were from SCIEX. CE-SDS analysis was performed using UV detection at 220 nm, and cIEF at 280 nm.
Instrument methods:
The CE-SDS capillary conditioning, separation and shutdown methods were used as described in the CE-SDS application guide3. The cIEF capillary conditioning and shutdown methods were used as described in the cIEF applications guide4, except for the separation method, which used 1hz and 8s for data rate and peak width at half height. All other parameters remain the same as described in the cIEF application guide4.
Software: BioPhase software, version 1.2 e-license, was used to create methods and sequences for data acquisition and data analysis on the BioPhase 8800 system.
Sample preparation for CE-SDS analysis under reducing and non-reducing conditions: 2 μL of 10 kDa marker 83 μL of SDS sample buffer pH 9 were added to 10 μL of the NISTmAb (10mg/mL) sample. Then 5 μL of β -ME or 250mM IAM for reduced and non-reduced conditions were mixed well. The mixtures were heat-denatured at 70oC for 10 minutes (min) before CE-SDS analysis.
Sample preparation for cIEF analysis: In a 5 mL microcentrifuge tube, 200μL of cIEF gel (no urea added) was mixed with 25 μL of cathodic stabilizer, 12 μL of Ampholyte mixture 3-10, 3μ od cathodic stabilizer and 2 μL of pI markers 10 and 4.1.
NISTmAb digestion for subunit analysis using FabRICATOR:
In a 0.5 mL microcentrifuge tube, 10 ml of 10 mg/mL NISTmAb was mixed with 10 mL of Fabricator (10 U/mL) and 2 uL of 220 mM of DTT. The mixture was incubated at 37 oC for 2 hours.
NISTmAb digestion for subunit analysis using FabULOUS:
10 ml of 10 mg/mL NISTmAb was mixed with 10 mL of FaBULOUS (10 U/mL) and 2 uL of 220 mM of DTT. The mixture was incubated at 37 oC for 2 hours.
Results and discussion
The digested samples were prepared and divided for the CE-SDS reduced and non-reduced conditions as well as cIEF analysis. These samples were analyzed using 2 BioPhase 8800 systems to ensure sample preparation consistency and repeatability.
CE-SDS OF NISTmAB digested with FabRICATOR
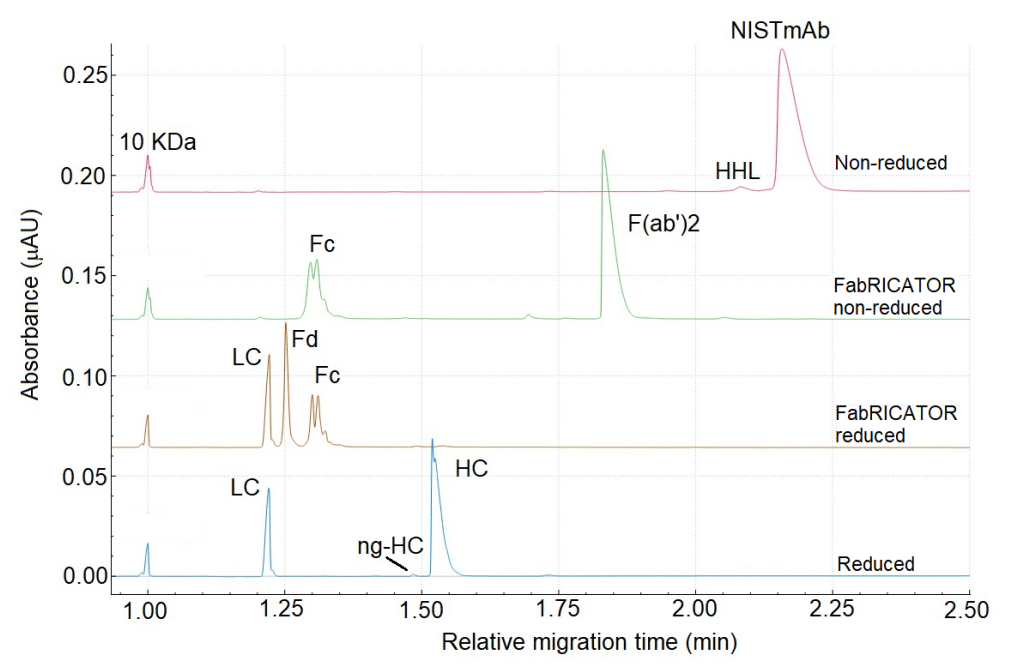
Figure 2 shows an overlay of the electropherograms obtained from NISTmAb under reduced and non-reduced conditions and digested with FabRICATOR. The electropherogram (e-gram) on the top shows the CE-SDS separation of NISTmAb under non-reducing conditions. As expected, the separation shows a major peak corresponding to the monomer of NISTmAb at approximately 2.2 minutes in relative migration time (RMT). The green trace shows a separation of NIST after digestion with FabRICATOR under non-reducing conditions. The separation indicates a complete digestion, as no monomer signal is detected. The 2 significant peaks correspond to the crystallizable fragment (Fc), and antigen-binding fragment (F(ab')2) at around 1.31 min and 1.83 min, respectively. The double peak observed for Fc is likely a result of the presence of different glycan species.5 The brown trace represents the NISTmAb that has been treated with FabRICATOR and subsequently reduced. As anticipated, the F(ab')2 fragment breaks into LC and Fd. The peak at 1.22 min is confidently assigned to the LC (light chain) because it overlays nicely with the LC of NISTmAB under reducing conditions (blue trace at the bottom). Therefore, the peak at 1.25 min is assigned to the Fd fragment by exclusion.
Figure 2: Overlay of electropherograms obtained of NISTmAb under different conditions.
CE-SDS OF NISTmAB digested with FabULOUS
Figure 3 presents an overlay of the electropherograms of NISTmAb under reducing conditions treated with FabULOUS. The digestion site for FabULOUS is above the hinge region, and cleavage occurs under reducing conditions, producing Fc, LC, and Fd fragments (excluding the hinge region). Notably, the Fc and Fd* fragments generated by FabULOUS exhibit slight size differences compared to those produced by FabRICATOR. Due to FabULOUS cleaving above the hinge region, the Fd* fragment is a few amino acids (aa) shorter, while the Fc fragment is a few aa longer, compared to the Fc and Fd subunit FabRICATOR produces.
Figure 3: Overlay of e-gram obtained from NISTmAb under different conditions.
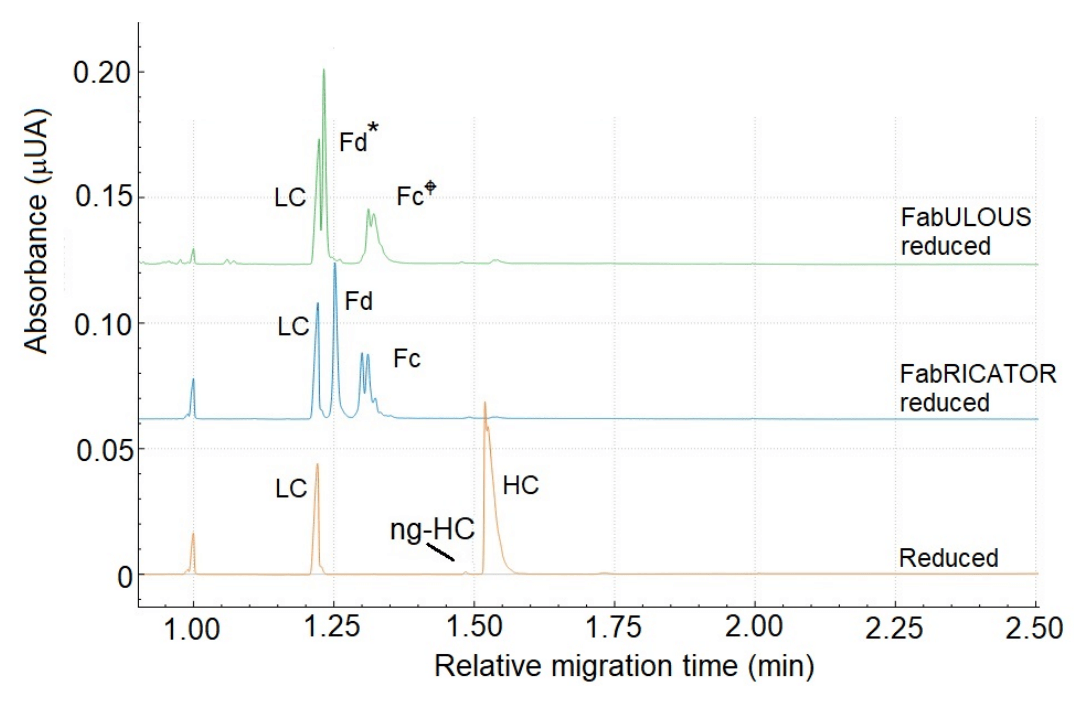
Peak assignment was conducted by comparing the e-gram of the sample digested with FabULOUS (green trace) to those of NISTmAb digested with FabRICATOR under reducing conditions (blue trace) and the reduced NISTmAb (brown trace). As expected, the e-gram of NISTmAb digested with FabULOUS and FabRICATOR display very similar profiles, as both reactions yield comparable fragments. However, the Fc fragment from FabULOUS digestion migrates slightly later than the Fc from FabRICATOR due to its longer length. Conversely, the shorter Fd* fragment migrates faster than the Fd from FabRICATOR. The final peak corresponds to the LC, assigned based on the comparison with reduced NISTmAb.
cIEF NISTmAB digested with FabRICATOR and FabULOUS
Monoclonal antibodies (mAbs) generally exhibit posttranslational modifications (PTMs) such as deamidation, isomerization, oxidation, glycosylation, and C-terminal lysine clipping, etc.1 These modifications alter the overall charge of the antibody. However, enzymatic digestion can significantly simplify the charge heterogeneity profile, enhancing mAb characterization.
cIEF is a high-resolution separation technique based on a protein's isoelectric point (pI). Interpreting cIEF separations can be challenging, as it is typically performed on intact molecules, resulting in an electropherogram that usually displays 1 main peak corresponding to the primary antibody variant. Acidic variants arise from modifications such as succinimide formation, C-terminal amidation, asialylation, and oxidation. Basic variants result from modifications like deamidation, sialylation, C-terminal lysine clipping, and glycation.
As discussed in the introduction, subunit analysis is essential for gaining insights into the structural changes that may occur in different domains of the antibody, which in turn induce changes in the charge heterogeneity of these molecules.
In this workflow, we illustrate the importance of orthogonal assays and demonstrate how CE-SDS of subunits can assist in the peak assignment of cIEF for subunit NISTmAb.
Figure 4 shows the e-gram of CE-SDS separation of NISTmAb after digestion with FabULOUS under reducing conditions and FabRICATOR under non-reducing conditions. These conditions were selected based on the optimal working conditions for the enzymes. Since the same samples were used for both CE-SDS and cIEF analysis, the species observed in CE-SDS e-gram should also appear in the cIEF separation, which was performed without urea.
Figure 4: Comparison between CE-SDS runs of NISTmAb digested with FabULOUS and FabRICATOR under non-reduced conditions.
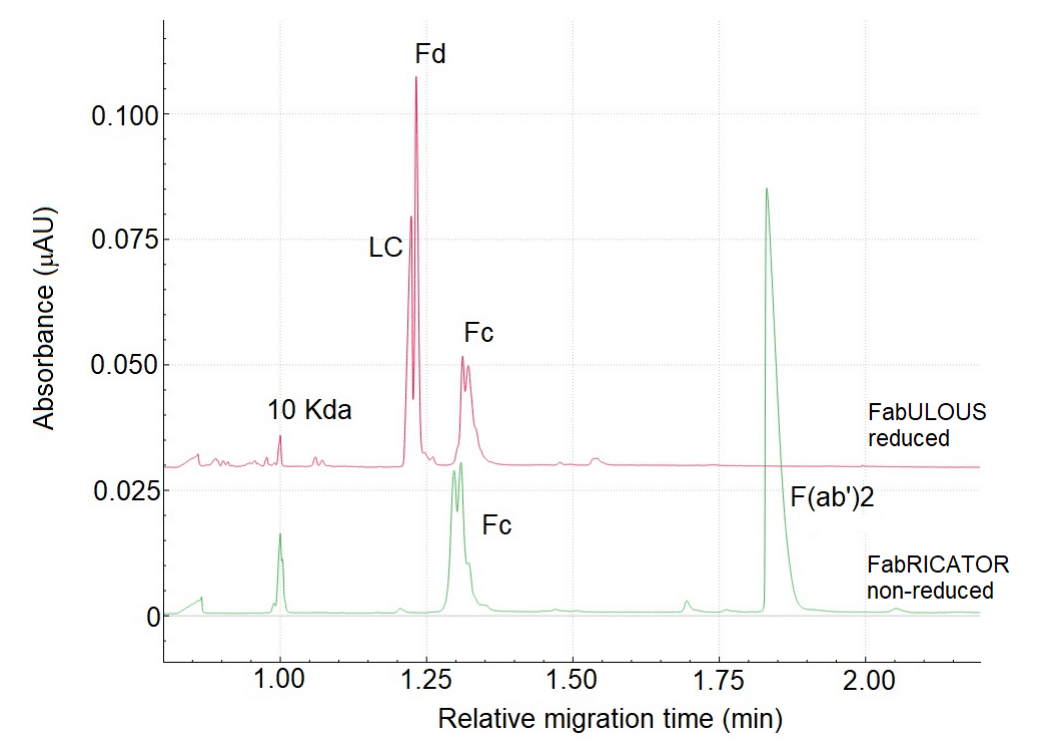
Figure 5 shows 4 major subunit species in the e-grams: F(ab)2, Fc, Fd and LC. Fc and F(ab)2 are produced from the FabRICATOR digest, while Fc, Fd, and LC are generated from the FabULOUS digest. As the Fc subunit is expected to be present after digestion using both enzymes, the prominent peak observed in both cIEF separations at a pI of approximately 9.5 can be attributed to the Fc subunit. The second most prominent peak in the red trace at around pI 7.5 can be attributed to the other subunit F(ab') 2, from the FabRICATOR digest.
Figure 5: Overlay of cIEF runs of undigested NISTmAb, and digested with FabRICATOR (non-reduced) and FabULOUS (reduced). The focusing time for the undigested sample was 30 minutes and 25 minutes for the FabRICATOR and FabULOUS digested samples.
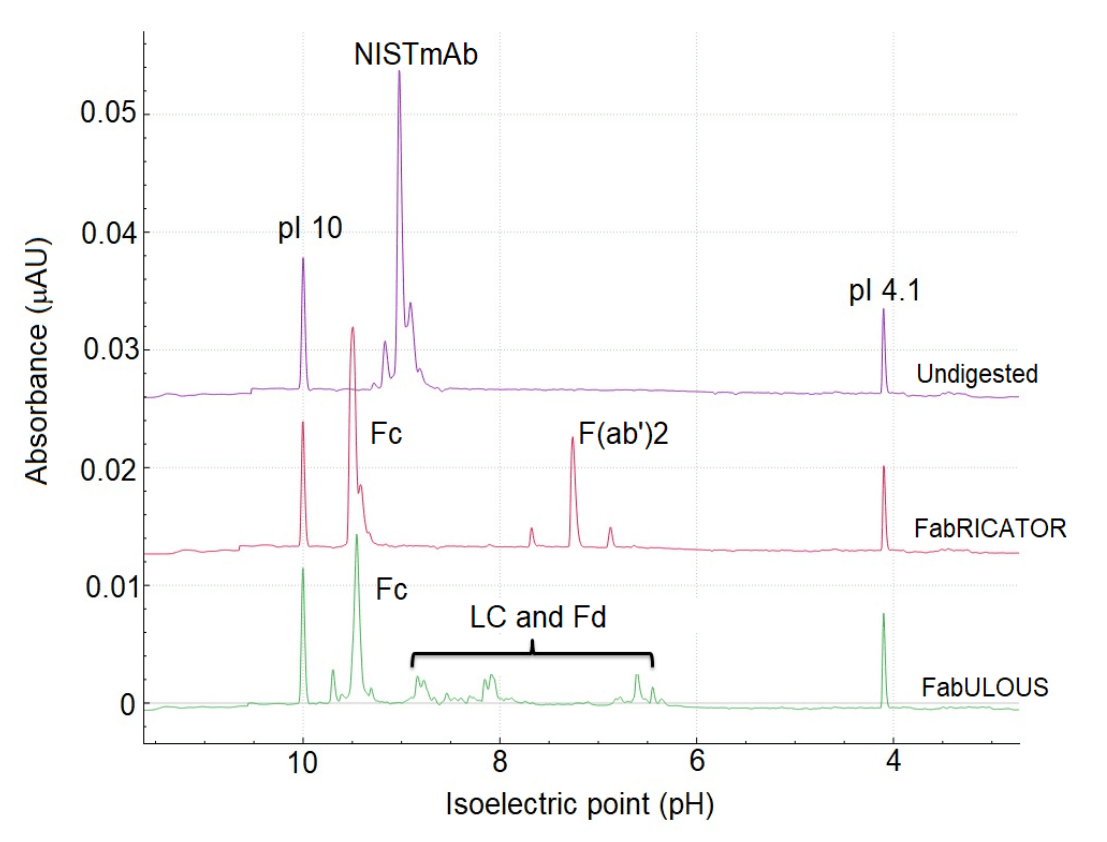
For the cIEF separation of the NISTmAb sample treated with FabULOUS, the peak detected at approximately pH 9.5 is attributed to the Fc region. This assignment is based on comparing the FabRICATOR and FabULOUS digests, as this peak is consistently observed in the e-gram of both digests. The smaller species are attributed to the LC and Fd variants, whose identities will need to be confirmed through future icIEF-UV/MS analyses.
Conclusion
- A straightforward workflow for subunit analysis using CE-SDS and cIEF was developed for peak assignment.
- The BioPhase 8800 facilitated rapid screening of conditions to aid in the development of CE methods.
- Batch sample preparation for both cIEF and CE-SDS analysis ensures sample preparation consistency.
- Subunit analysis with CE-SDS gives insight into the structural changes that may occur to different domains of the antibody.
- Subunit information from CE-SDS can assist in attributing PTMs to changes in the charge heterogeneity of these molecules.
References
- Benchaar, S. et al. (2015), Structural Elucidation of Chemical and Post-translational Modifications of Monoclonal Antibodies, ACS Publications, Washington, DC, [online].
- Banerjee, S. BioProcess International 22(4)I, April, 2024.
- CE-SDS Protein analysis kit for BioPhase 8800 system – Application guide.
- Capillary isoelectric focusing (cIEF) for the BioPhase 8800 system – Application guide.
- Krupke, A. et al. Intact NIST monoclonal antibody characterization —Proteoforms, glycoforms—Using CE-MS and CE-LIF, Cogent Chemistry (2018), 4: 1480455