High-Resolution cIEF of Therapeutic Monoclonal Antibodies
A Platform Method Covering pH 4-10
Scott Mack, Ingrid D. Cruzado-Park, and Chitra K. Ratnayake
SCIEX, Brea, CA USA
Abstract
Many mAbs have charge isoforms with a pI in the basic range of the pH gradient. Basic compounds present a challenge in cIEF due to the inadequate nature of ampholytes comprising the basic region as well as decay of the whole pH gradient over time.1,2 Addition of cathodic and anodic stabilizers to the cIEF sample solution helps overcome these obstacles.3 Additionally, optimization of stabilizer solution volumes, focusing times, and ampholyte concentration allows for development of a single method that can be used throughout the complete pH range.4,5,6 This strategy allows for development of a single protocol for product pipeline characterization, also referred to as a platform method. This is an important point due to the need for simplicity and versatility of method development in the biopharmaceutical industry. The result of these efforts is the development of a robust analytical technique less prone to operator error or system variation allowing for easier portability.
Introduction
During a cIEF separation, a continuous pH gradient is formed by applying voltage across a capillary filled with carrier ampholytes (CA) whose opposing ends are submerged in acidic (anodic) or basic (cathodic) solutions. The electrical field generated drives the counter migration of hydronium and hydroxyl ions into the capillary, titrating amphoteric compounds towards their isoelectric points (pI). cIEF separation for characterization of therapeutic proteins has been increasingly adopted in recent years; pI determination adds a critical dimension to establishing identity, purity, post-translational modification and stability of therapeutic protein preparations. A significant proportion of cIEF analyses being performed in the biopharmaceutical industry involve characterization of monoclonal antibodies (mAbs). Many mAbs have charge isoforms with a pI in the basic range of the pH gradient. Basic compounds present a challenge in cIEF due to the inadequate nature of ampholytes comprising the basic region as well as decay of the whole pH gradient over time.1,2 Addition of cathodic and anodic stabilizers to the cIEF sample solution helps overcome these obstacles.3 Additionally, optimization of stabilizer solution volumes, focusing times, and ampholyte concentration allows for development of a single method that can be used throughout the complete pH range.4,5,6 This strategy allows for development of a single protocol for product pipeline characterization, also referred to as a platform method. This is an important point due to the need for simplicity and versatility of method development in the biopharmaceutical industry. The result of these efforts is the development of a robust analytical technique less prone to operator error or system variation allowing for easier portability.
Methods
Preparation of mAb Samples. A 500 µL volume of a basic therapeutic mAb (with a concentration in the range of 5-10 mg/ mL) was thawed and loaded into a Microcon* Ultracell YM 10 (p/n A11530, Millipore, Billerica, MA). Following centrifugation for 5 min in a Microfuge™ 18 (p/n 367160, Beckman Coulter, Inc., Fullerton, CA) at 12 k RCF, the filtered volume was replaced with 20 mM Tris buffer pH 8.0. Two additional cycles of centrifugation and buffer replacement were performed and the desalted sample was aliquoted into approximately 50 µg fractions and stored at -20° C or below.
Capillaries and Reagents. A SCIEX 50 µm i.d. Neutral Capillary (p/n 477441) was installed in a Capillary Cartridge equipped with a 200 µm aperture. Prior to installation, the capillary was measured so that its total length is 30.2 cm and the length from inlet to detection window is 20 cm, and from the outlet to the detection window was 10 cm.
Anolyte solutions containing 200 mM phosphoric acid were prepared as a 50 mL bulk by making 0.685 mL 85% phosphoric acid to a total volume of 50 mL with DDI water.
Catholyte solutions containing 300 mM sodium hydroxide were prepared as a 50 mL bulk by making 15 mL of 1 M NaOH (Sigma 720820) to a total volume of 50 mL with DDI water.
Chemical mobilizer solutions containing 350 mM acetic acid were prepared as a 50mL bulk by making 1 mL of glacial acetic acid to a total volume of 50mL with DDI water.
Capillary cleaning solution was made as a bulk solution by dissolving 10.8 g of urea (Sigma p/n U0631) in 30 mL of DDI water. Capillary cleaning solution was mixed until all solids solubilized and then filtered through an Acrodisc* 25 mm syringe filter with a 5 μm pore (Pall p/n 4199) to remove particles.
A 3 M urea-cIEF gel solution was prepared by dissolving 1.80 g of urea (Sigma p/n U1250) in 7 mL of cIEF gel (p/n 477497). Once dissolved, this was made up to a total of 10 mL with cIEF gel, and then mixed for 15 min and loaded into a 30 mL syringe (Becton Dickenson p/n 309650), and then filtered using a 5 μm pore Acrodisc 25 mm syringe filter (Pall p/n 4199) to remove particles. The 3 M urea-cIEF gel solution was degassed at 2,000 RCF with an Allegra™ X 15 R centrifuge (Beckman Coulter p/n 392933) and stored at 2-8° C.
Cathodic stabilizer solution containing 500 mM L-Arginine was made as a 50 mL bulk by first dissolving 0.87 g of L-Arginine (98%) (Sigma p/n A5006) solid with 8 mL of DDI water in a 10 mL volumetric flask, then volumetric flask was shaken for 15 min to dissolve, and finally increasing the volume to 10 mL with DDI water.
Anodic stabilizer solution containing 200 mM iminodiacetic acid (IDA) was made as a a 10 mL bulk by first dissolving 0.27 g of iminodiacetic acid (98%) (Sigma p/n 220000) solid with 8 mL DDI water in a 10 mL volumetric flask. The mixture was shaken for 15 min to dissolve all solids and the volume was increased to 10 mL using DDI water.
The mAb buffer replacement solution which contained 20 mM Tris was made by diluting 4 mL of 50 mM Tris buffer at pH 8.0 (p/n 477427) with 6 mL of DDI water.
Table 1. Master Mix Preparation. A cIEF master mix solution was made by mixing the appropriate component volumes shown in Table 1. These volumes include a 20% overage volume to account for pipetting error. The single portion composition of the master mix contained 12 μL of Pharmalyte* 3-10 (GE Healthcare p/n 17-0456-01), 20 μL of 500 mM L-Arginine, 2 μL of 200 mM IDA, 1.0 μL of 1.25 mM peptide pI markers, and 200 μL of 3 M ureacIEF Gel
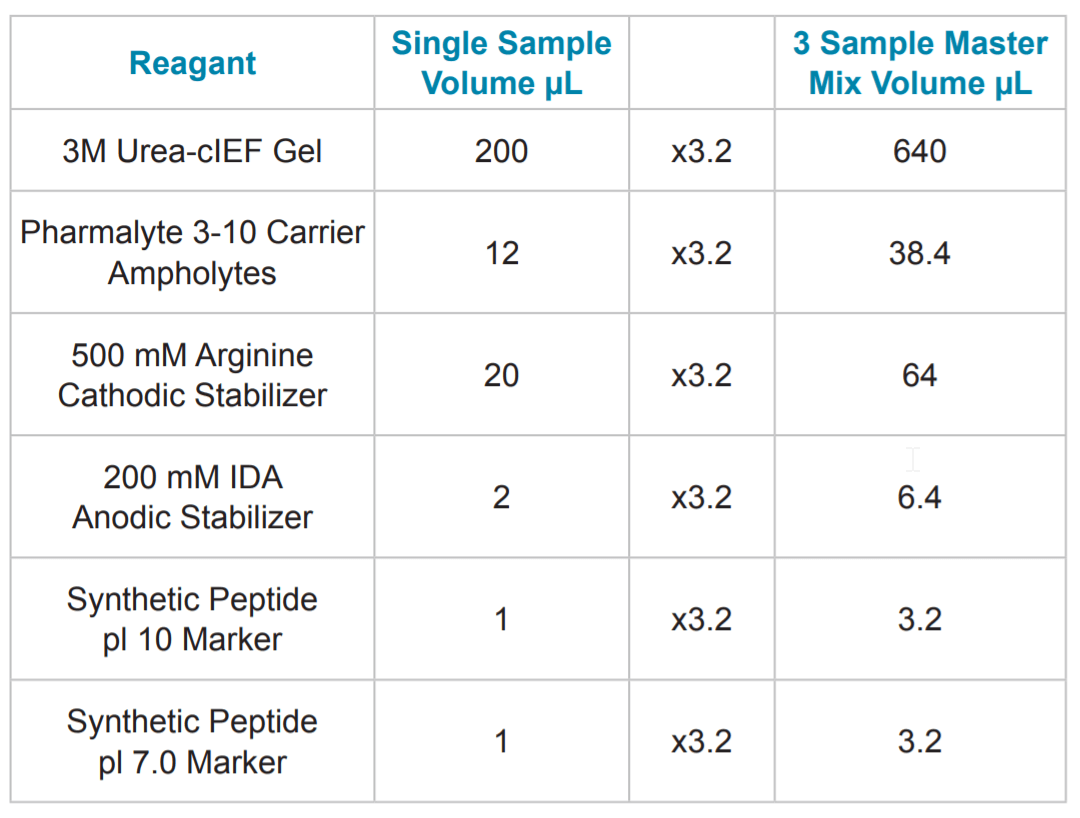
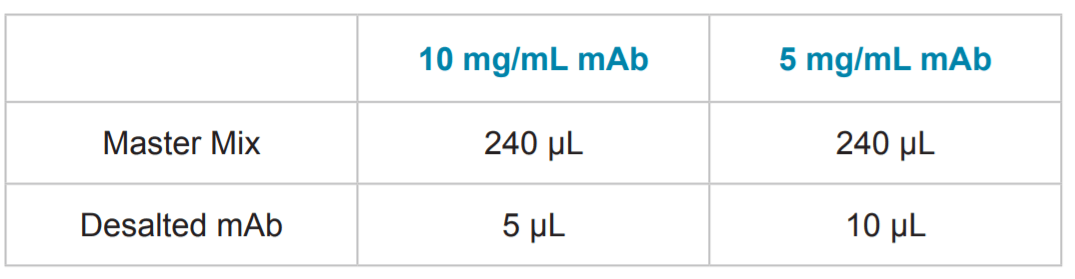
Table 2. Sample Preparation. Following mixing of the 240 μL master mix, it was added to a tube containing an aliquot of desalted mAb. The complete sample solution was then vortexed, 100 μL was transferred into a PCR tube, overlaid with a single drop of mineral oil (Sigma p/n 8410-5ML) and placed in a sample vial.
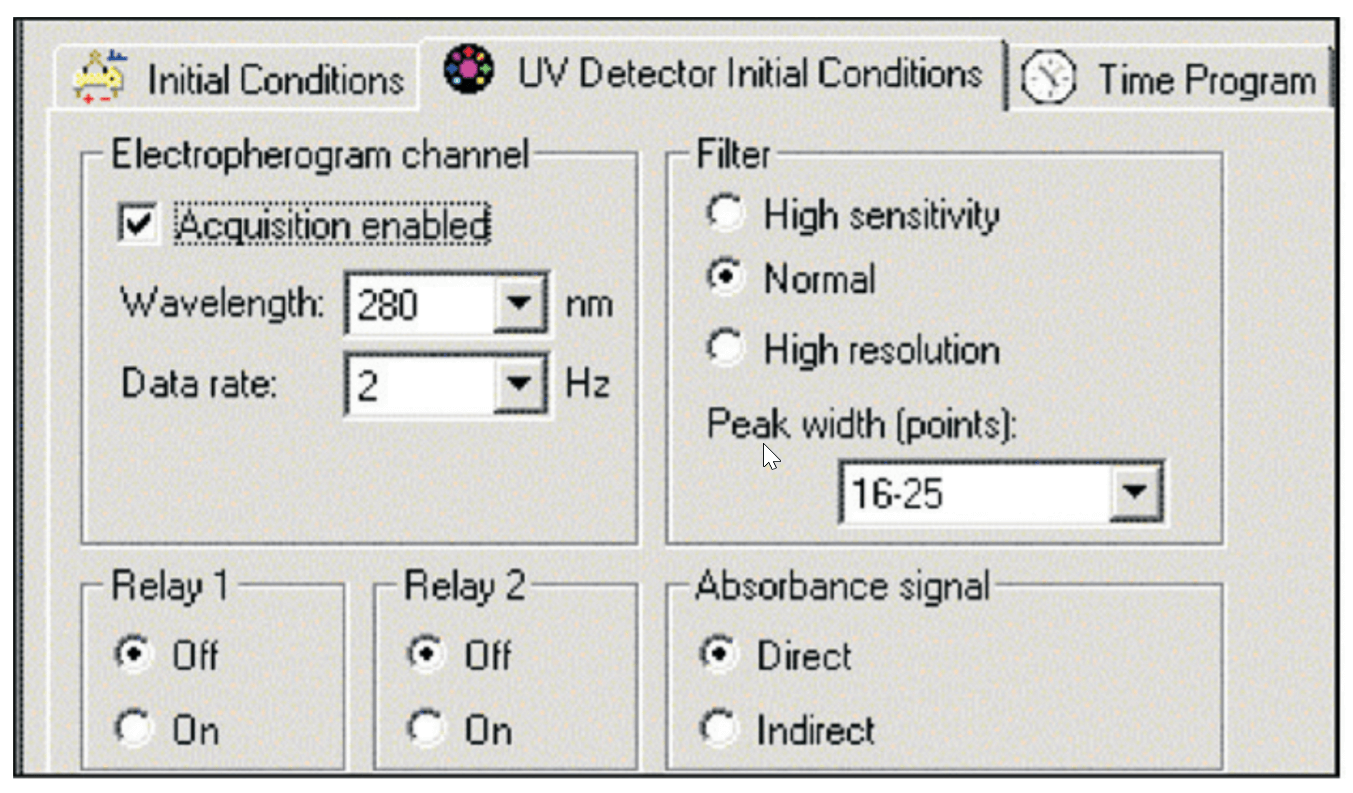
Instrument Configuration. All cIEF experiments were performed on a SCIEX PA 800 Series Pharmaceutical Analysis System equipped with a UV detector and a 280 nm filter with a band pass of +/- 10 nm. The detector was set to detect direct absorbance at a collection rate of 2 Hz. The electronic filter was set at the normal setting, with a peak width setting of 16 to 25. All separations were performed at a capillary temperature setting of 20° C. The system auto sampler was set to a temperature of 10° C.
Conditioning Method. After initial installation of the capillary cartridge, the neutral capillary was conditioned by first performing a water rinse by submerging the inlet of the capillary into a Universal Vial containing 1.5 mL of DDI water and applying 50 psi of pressure from the inlet side for 2 min. The extended water rinse was followed by a weak acid wash performed by submerging the inlet of the capillary into a vial containing 1.5 mL of chemical mobilizer and applying 50 psi of pressure from the inlet side for 2 min. Finally a conditioning rinse is performed by submerging the inlet of the capillary into a vial containing 1.5 mL of SCIEX cIEF gel and applying 50 psi of pressure from the inlet side for 5 min. During all the steps in the conditioning method the outlet of the capillary was placed in a waste vial containing 1.0 mL DDI water.
Figure 1. Initial Conditions.
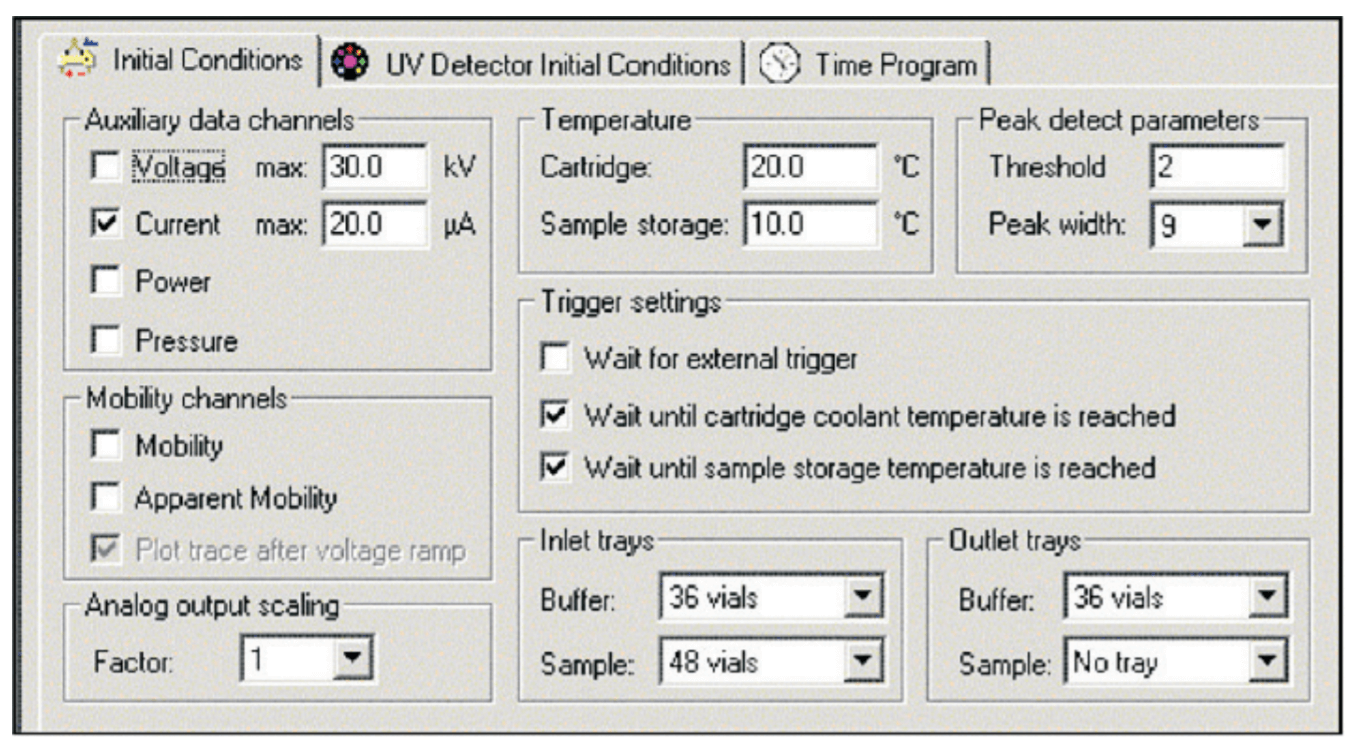
Figure 2. Detector Settings.
Platform cIEF Separation Method. The mAb samples were separated using the following separation method: Prior to loading a new sample, the capillary was cleaned by submerging the inlet of the capillary into a vial containing 1.8 mL of capillary cleaning solution and applying pressure at 50 psi from the inlet side for 3 min.
Following the capillary cleaning solution rinse step, the capillary was flushed with water by submerging the inlet of the capillary into a vial containing 1.5 mL DDI water and applying 50 psi of pressure from the inlet side for 2 min. The mAb CIEF sample solution was introduced into the capillary by applying 25 psi of pressure for 99.9 sec from the inlet side of the capillary. During the cleaning, water rinse and sample loading steps, the outlet side of the capillary was placed into a waste vial containing 1.0 mL DDI water.. Following sample injection, the gradient was focused by submerging the inlet side of the capillary into a vial containing 1.5 mL of anolyte and the outlet side of the capillary into a vial containing 1.5 mL of catholyte and applying a 25 kV electrical potential across the capillary for 15 min.
The focused peaks were mobilized by chemical means, during which the catholyte solution was replaced with a vial containing Figure 3. Buffer Trays Setup. 6 5 4 3 2 1 A DDI water DDI water Chem. Mob. Anolyte Cap. Clean Sol. cIEF Gel B C D BI (Inlet Buffer Tray) E F 6 5 4 3 2 1 A DDI water Waste Chem. Mob. Catholyte B C D BO (Outlet Buffer Tray) E F 1.5 mL of chemical mobilizer and applying a 30 kV electrical potential across the capillary for 20 min. Following completion of the mobilization step, data collection was stopped and a water rinse step was performed by submerging the inlet of the capillary into a vial containing 1.5 mL DDI water and applying 50 psi of pressure from the inlet side for 2 min. During the sample loading and all rinse steps in the method, the outlet of the capillary was placed in a waste vial containing 1.0 mL DDI water.
Shutdown Method. The instrument was shut down and the capillary was stored on the instrument at the end of the working day using a shutdown method that first equilibrated the capillary by submerging the inlet of the capillary into a vial containing 1.5 mL of DDI water and applying 50 psi of pressure from the inlet side for 2 min. The water rinse was followed by a conditioning rinse performed by submerging the inlet of the capillary into a vial containing 1.8 mL of SCIEX cIEF gel and applying 50 psi of pressure from the inlet side for 10 min. During both rinse steps in the shutdown method, the outlet of the capillary was placed in a vial designated for waste, containing 1.0 mL DDI water. The last step in the shutdown method included turning off the UV lamp and submerging each end of the capillary in a vial containing 1.8 mL of DDI water.
Figure 3. Buffer Trays Setup.
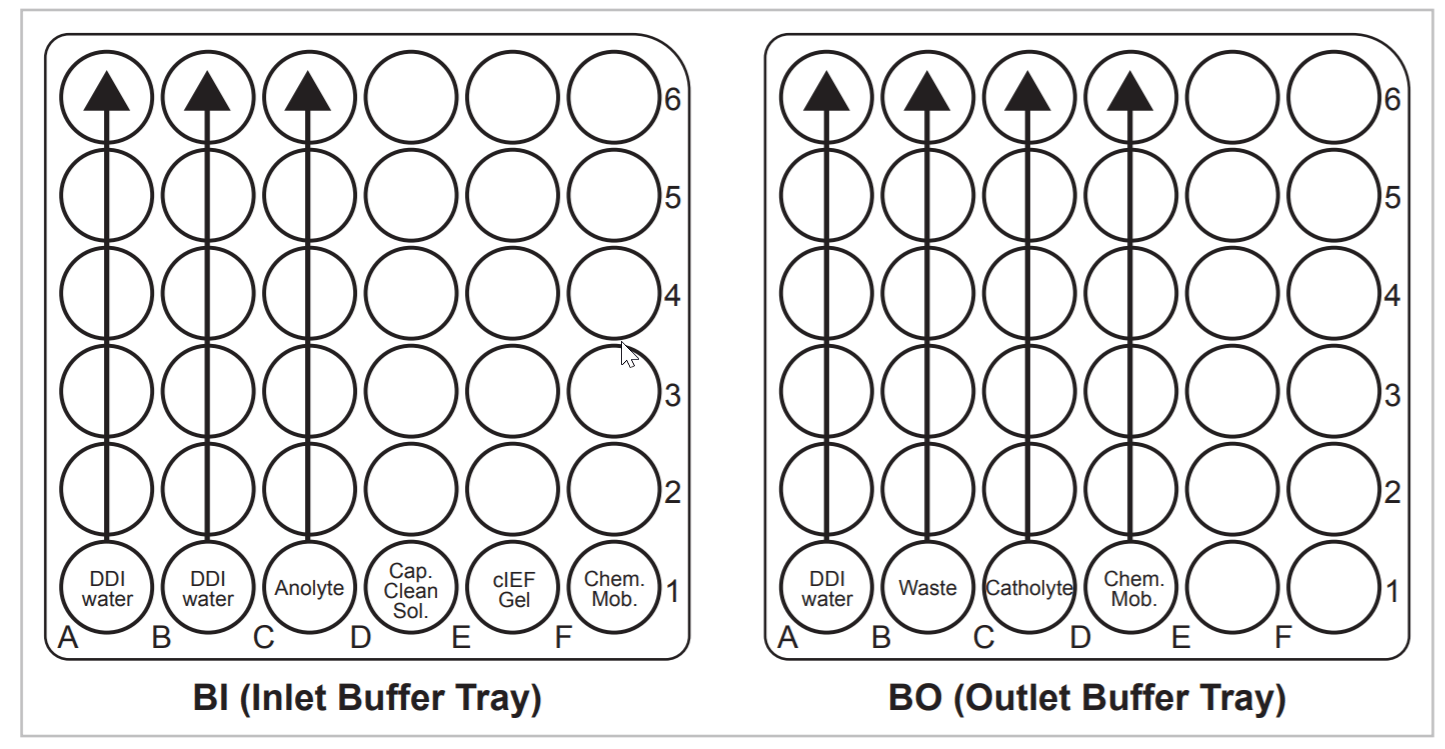
Buffer Tray Set-up. PA 800 Series universal vials containing 1.5 mL of cIEF separation reagents were placed in the buffer trays prior to separation in the order illustrated in Figure 3. The capillary cleaning solution is designated by the abbreviation “Cap Clean Sol.” and chemical mobilizer by “Chem. Mob.” Arrows indicate the reagents that are incremented by the Basic pH Gradient cIEF Separation Method and the direction of incrementing.
Results
pH Gradient Range and Linearity. The effective separation range and linearity for the ampholyte buffered pH are important factors in cIEF. cIEF methods that can produce a linear gradient over a wide pH range reduce the number of methods and internal standards an analyst must develop when working with multiple compounds.
The cIEF separations of a panel of synthetic peptide markers with pI points spanning the pH range of 4.1 to 10 (Table 3) were performed using the basic pH range method to assess linearity. This separation (Fig. 4) illustrates that the method has a wide functional range and is even capable of separating the acidic peptide markers when the mobilization time is extended. Incorporation of a slight modification can extend the method’s range to include a pI 3.4 peptide marker (See “Identification of System Parameters Critical for High-Performance cIEF,” Application Information Bulletin p/n RUO-MKT-02-6962-A). Analysis of pI versus detection time (Fig. 5) for the synthetic peptide markers shows that the gradient is linear between pH 10 and 4.1 with a correlation coefficient of 0.99.
Figure 4. cIEF Separations of Synthetic Peptide pI Markers. Contains an electropherogram of seven synthetic peptide markers using the basic pH gradient cIEF separation method. The mobilization step was extended from 35 minutes to 40 minutes to allow for the detection of the pI 4.1 marker.
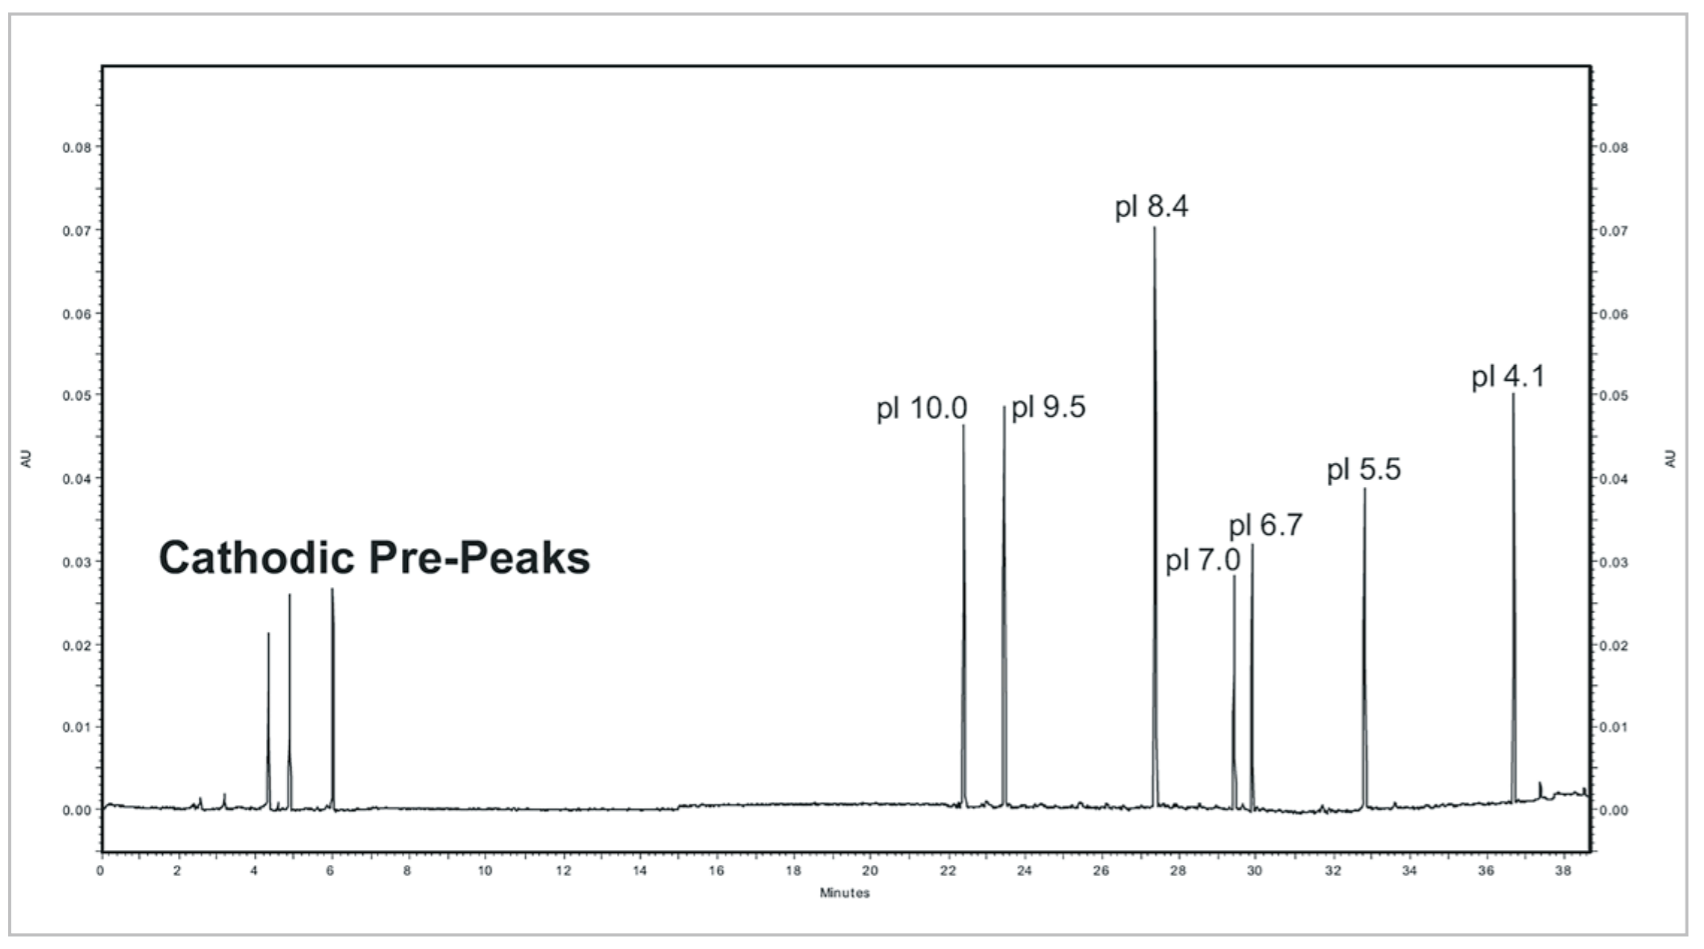
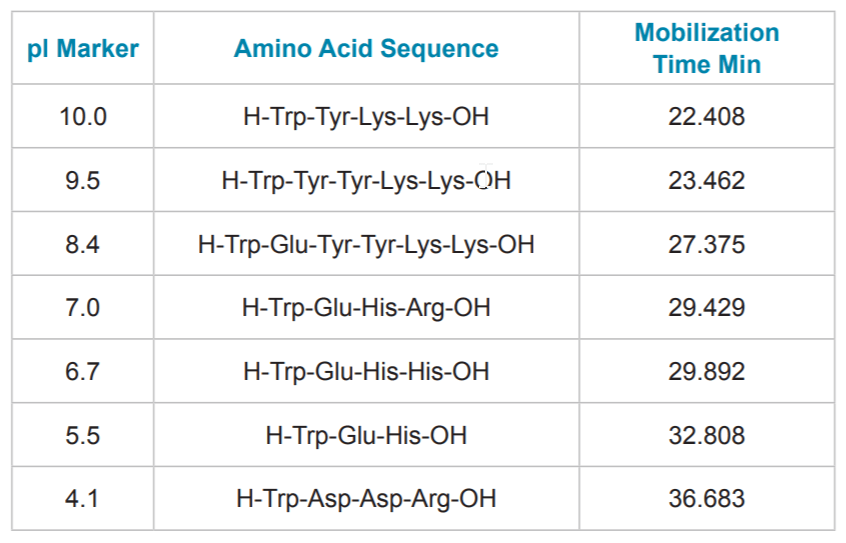
Table 3. pI Marker Detection Times. Contains the pI points, amino acid sequences and detection times for the pI markers separation in Figure 4.
Highly basic protein species not properly focused are sometimes mistaken as salt fronts. This is illustrated in Figure 4 as the cathodic pre-peaks. These peaks are actually a product of the bi-directional migration generated by the total capillary sample loading method employed by cIEF. These peaks are most prominent for compounds with basic pI points and can be quite useful as a diagnostic tool. Earlier detection times for cathodic peaks can be characteristic of a decrease in ampholyte concentration, increase of cathodic stabilizer volume, or increase in salt concentration in the sample solution. The opposite is true with increased detection times for cathodic peaks. Increased cathodic peak detection times may also be observed in older and/or expired capillaries, most likely due to the increase in the magnitude of electroosmotic flow (EOF).
Separation of Three mAbs. mAbs tend to generate complex charge isoform profiles when separated by cIEF. These profiles in addition to actual pI values for the peaks generate a “mAb” fingerprint. It is for this reason that cIEF can be a powerful tool in identification and characterization of separate mAb preparations. The unique peak profile for different mAbs shows that a single method using a broad pH 3 to 10 ampholyte mixture is capable of resolving differences in pI up to a few hundredths of 1 pH unit across the basic range of the gradient (Figure 6).
Reproducibility of mAb Separation. In order to test intermediate precision for this method, a panel of three antibodies was separated in triplicate on two instruments using two different lots of neutral capillary and reagents on six separate days. All data was integrated using 32 Karat™ software. pI was determined through the qualitative analysis tool using the detection times of pI 10 and 7 synthetic peptide markers. The peaks were clustered into one of three isoform groups for each mAb, basic, main and acidic, and a percent composition was calculated for each isoform group. The pI point of seven signature peaks and the percent composition of three isoform groups for each of the three mAbs tested were recorded. These recorded values were then used to calculate percent coefficients of variation (%CV) which were used to gauge assay reproducibility.
Figure 5. pI Marker Linear Model. A plot of pI values versus detection time observed for separation of synthetic peptides as summarized in Table 3. The mobilization of the pI markers fits a linear model with a correlation coefficient of 0.99 indicating that the mobilized pH gradient is highly linear.
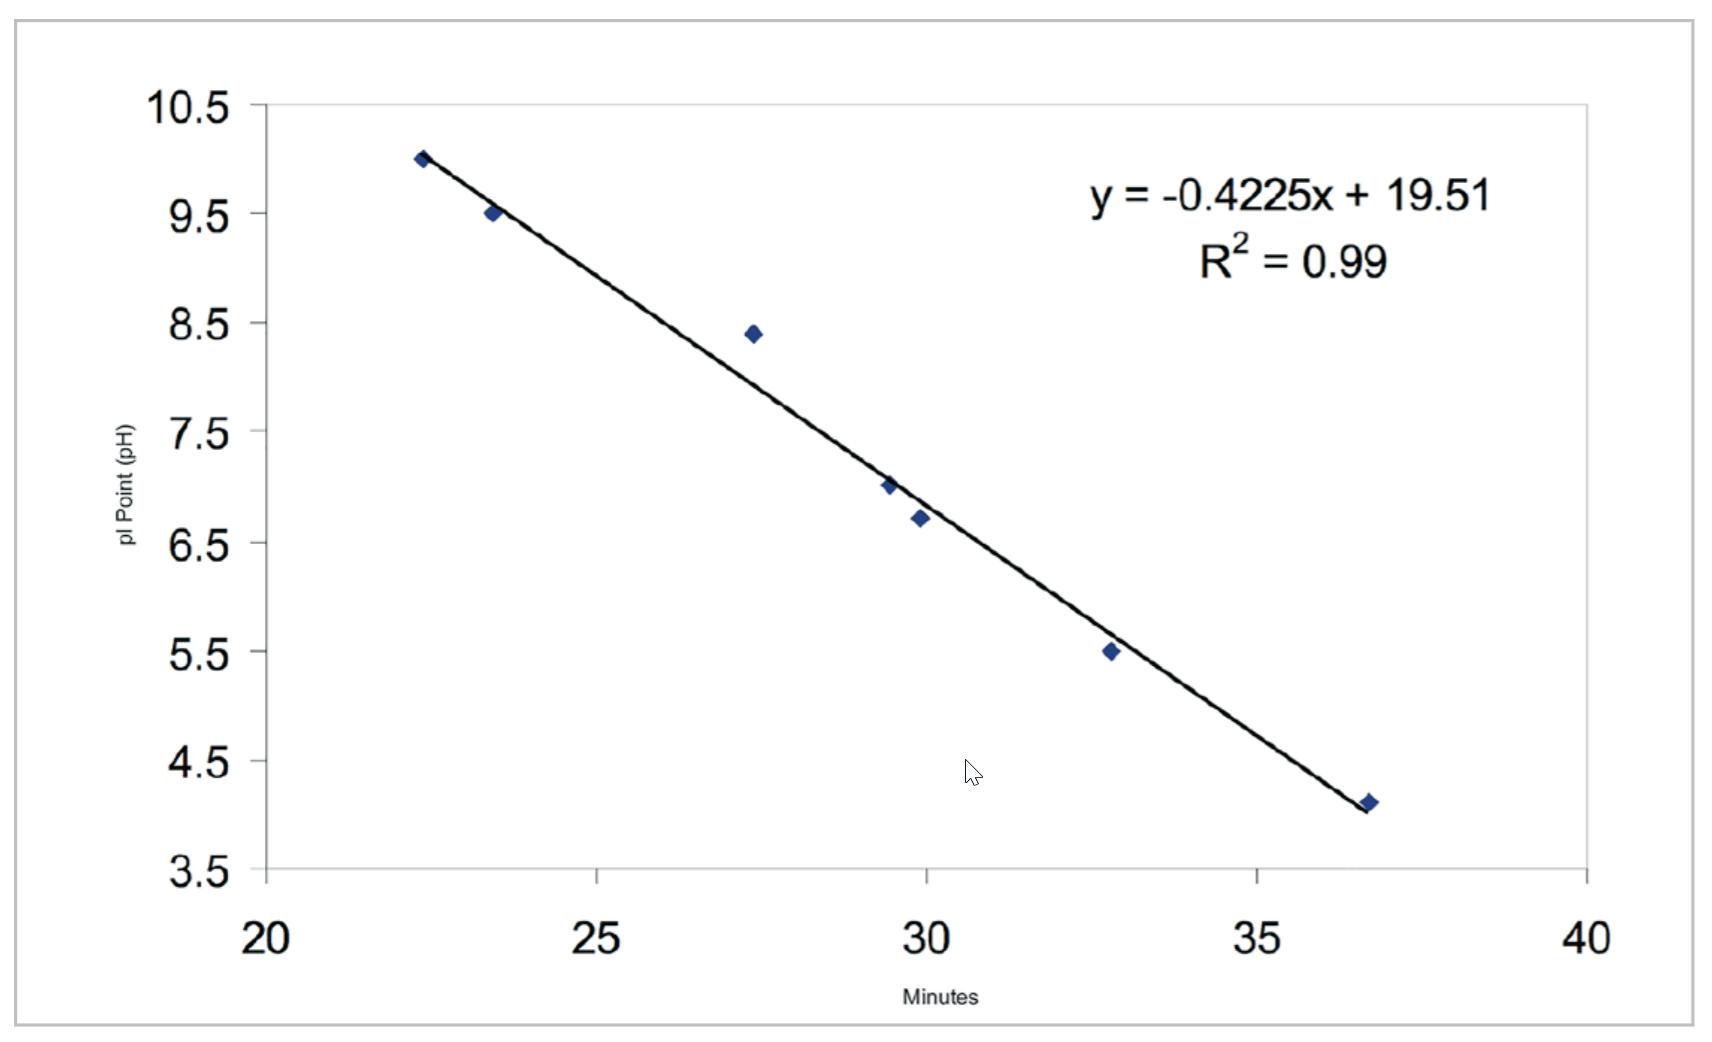
Figure 6. cIEF Separations of Three Basic mAb’s. Electropherograms for three basic mAbs separated by cIEF using the same conditions as shown in Figure 4.
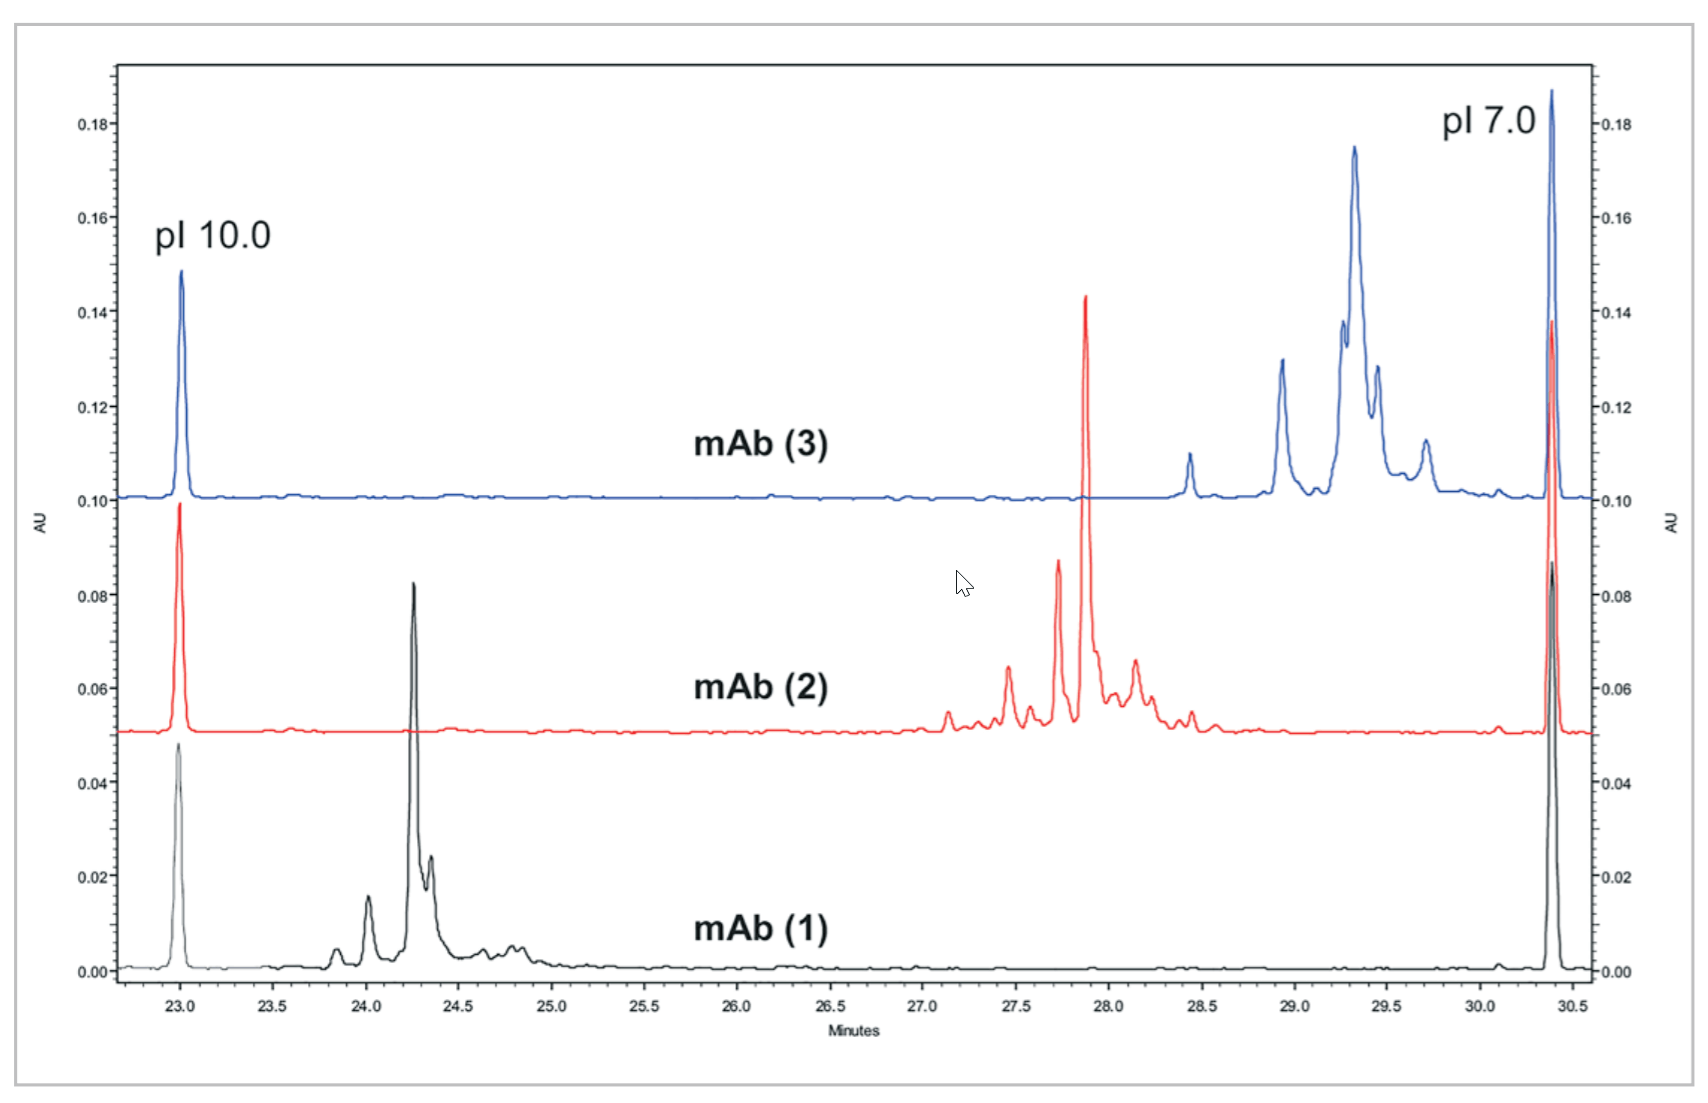
Figure 7. mAb (1) Peak Profile. A close up view of the mAb #1 cIEF separation
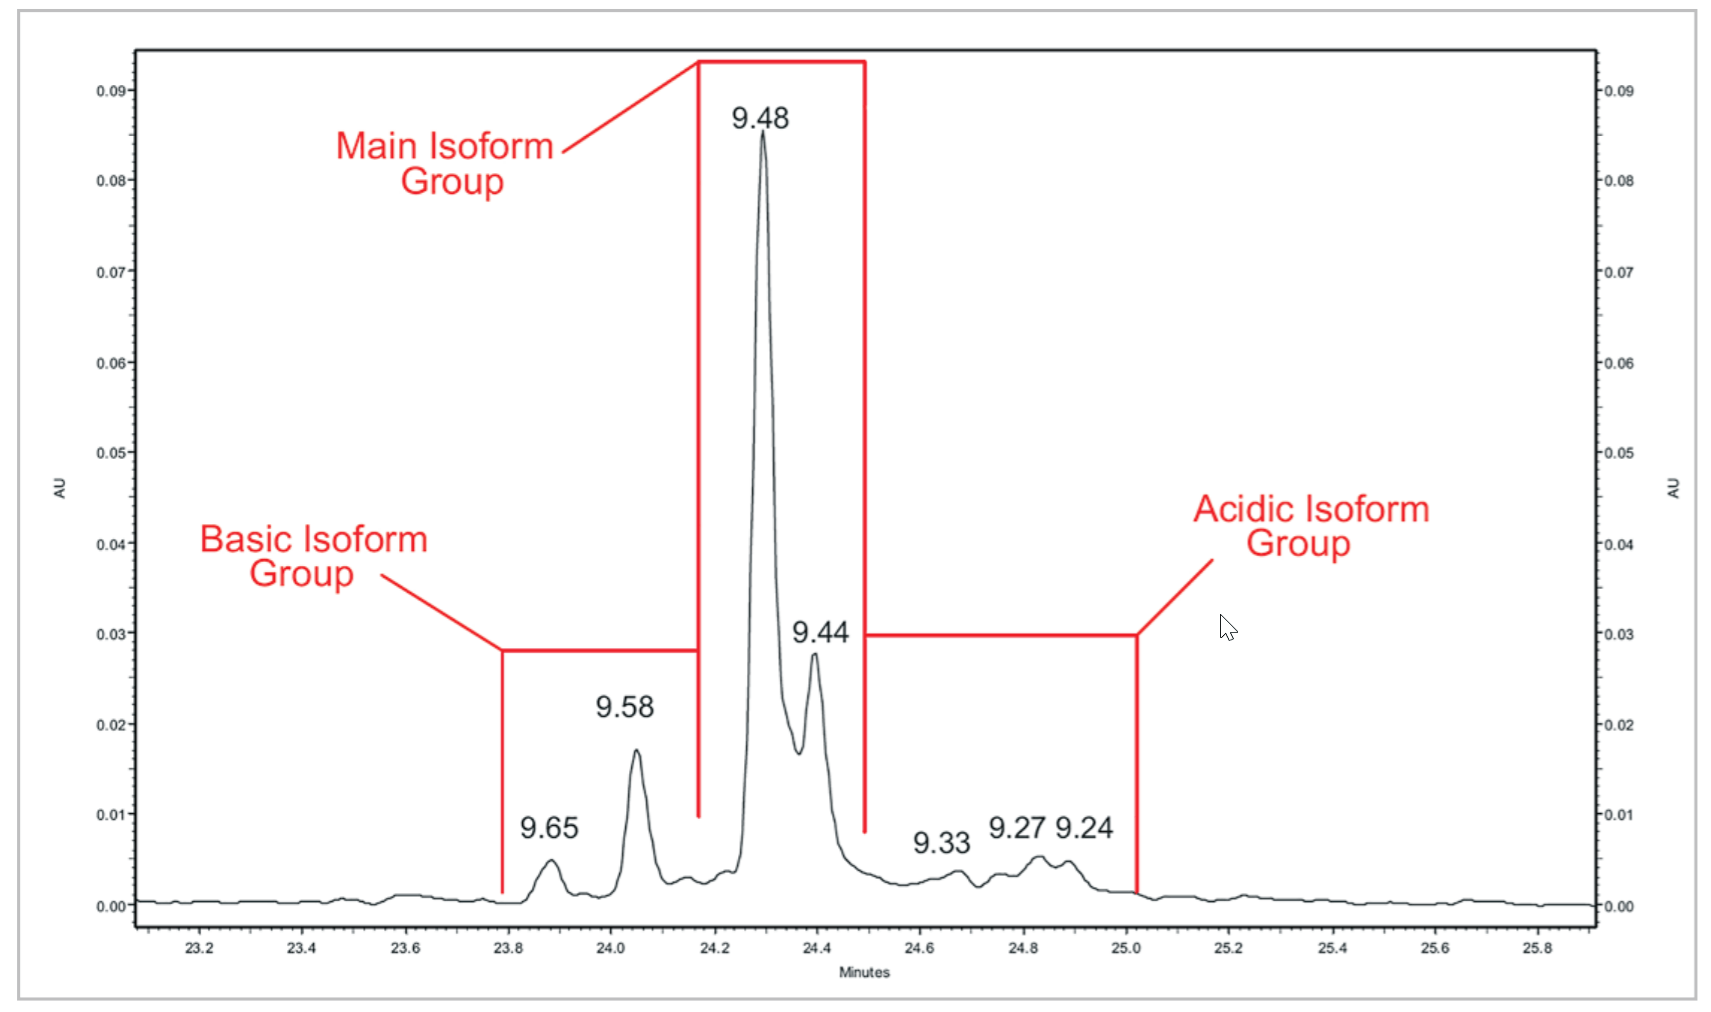
Table 4. Quantitative Analysis of mAb #1 cIEF Separation. Quantitative analysis was performed using the pI point of seven signature peaks and the percent composition of three isoform groups.
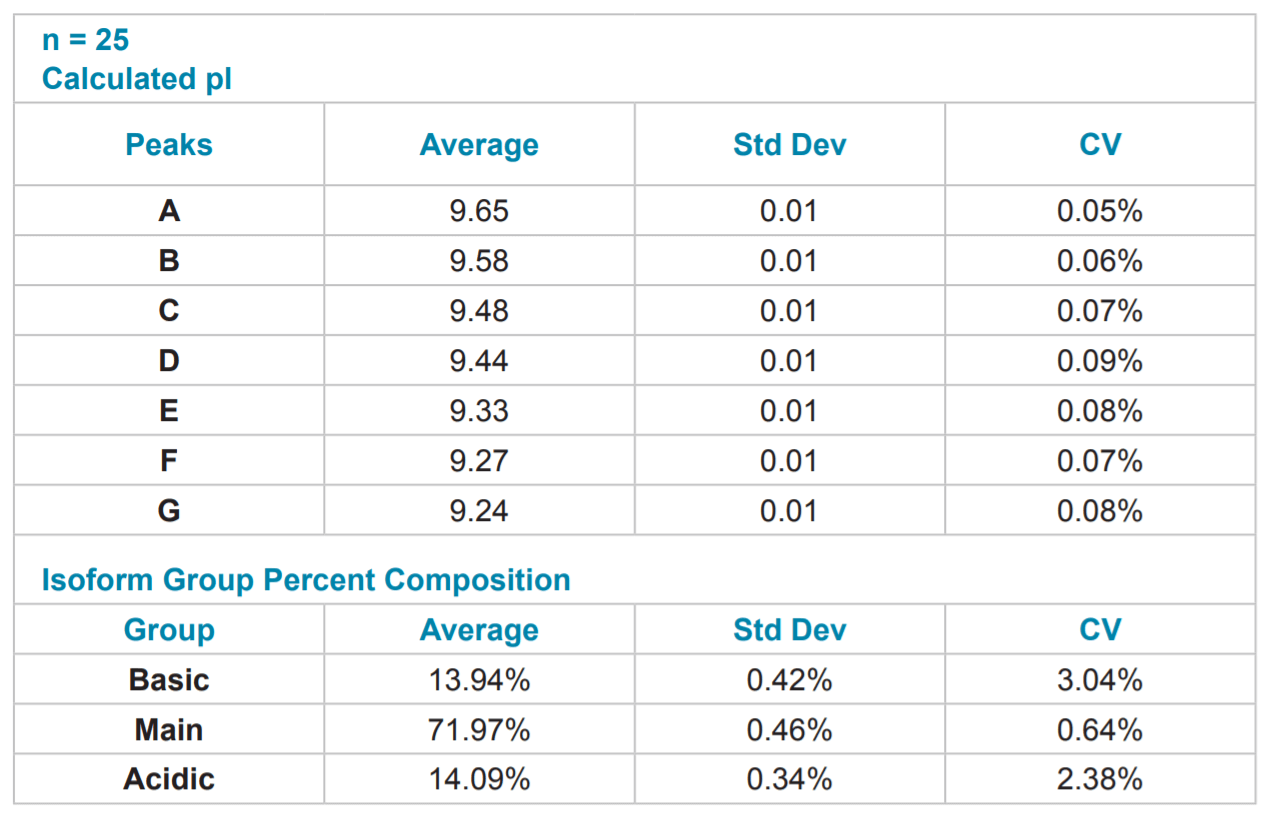
Figure 8. mAb #2 Peak Profile. A close up view of a mAb #2 cIEF separation.
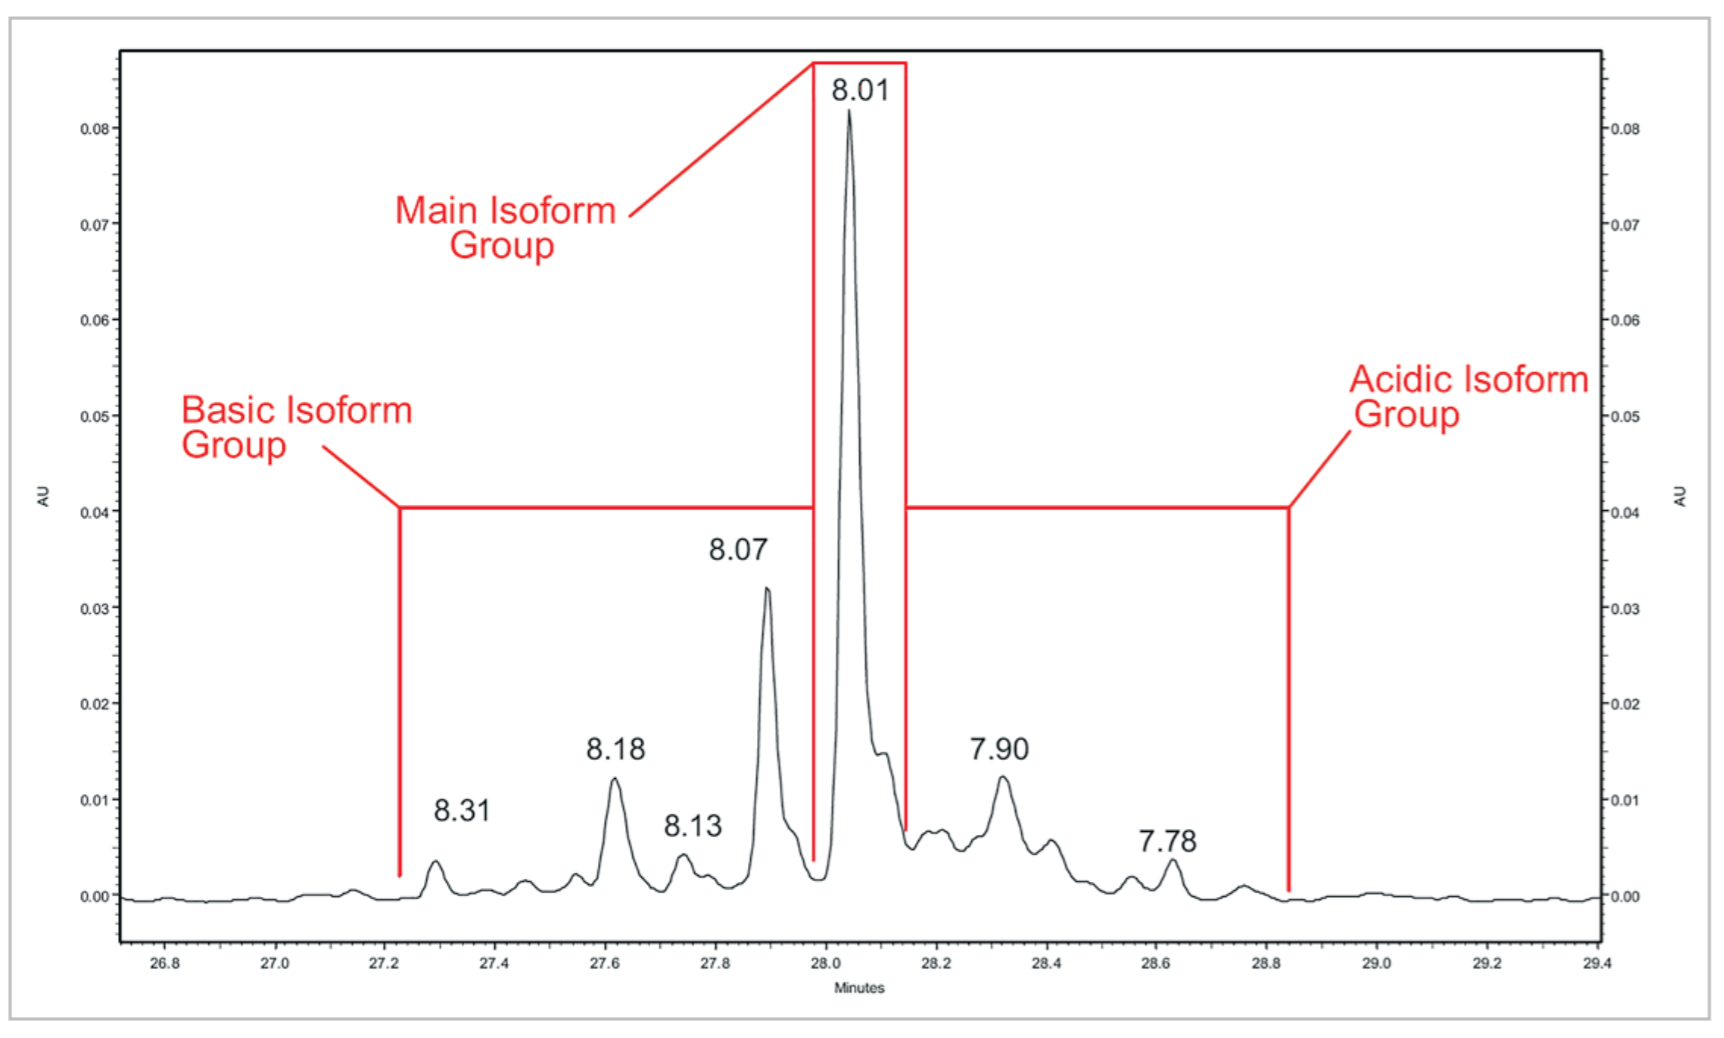
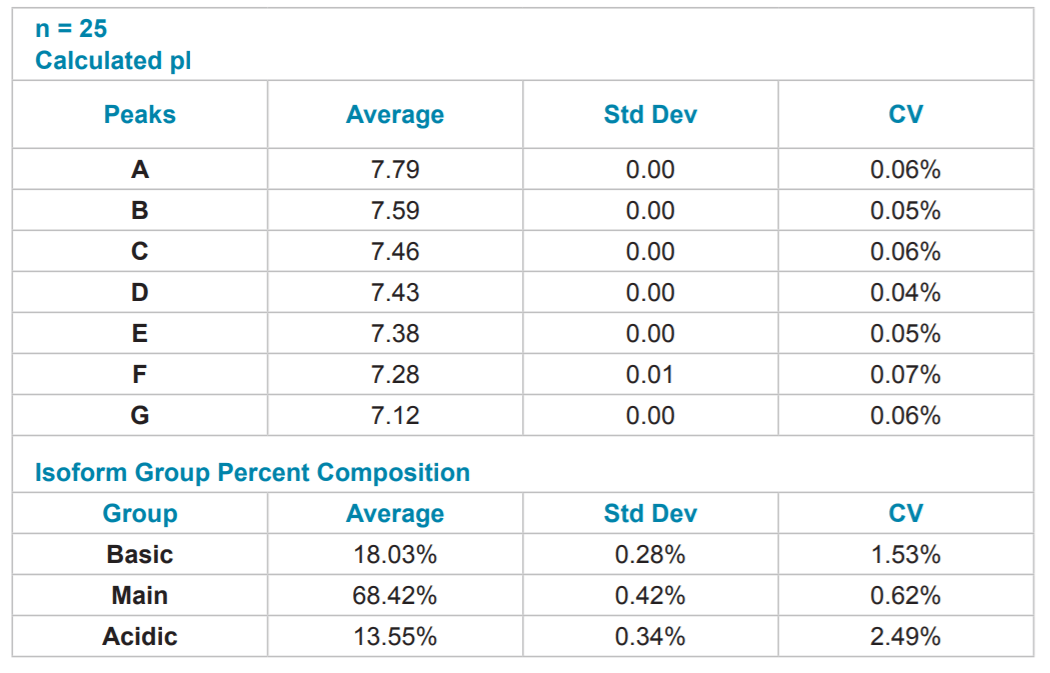
Table 5. Quantitative Analysis of mAb #2. Quantitative analysis was performed using the same method as mAb #1.
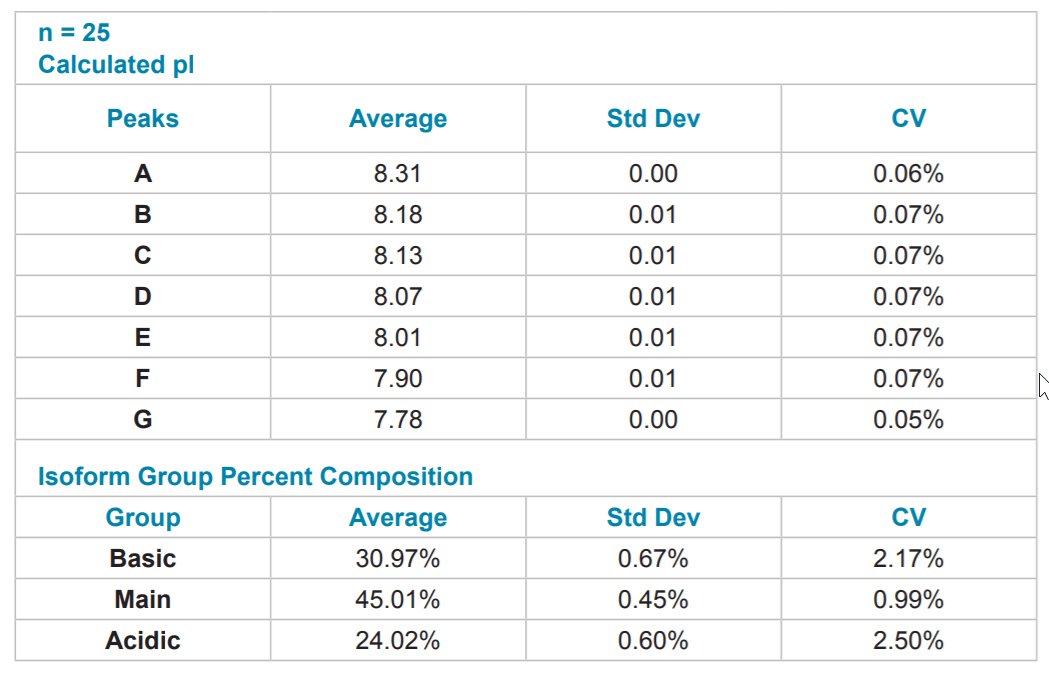
Figure 9. mAb #3 Peak Profile. A close up view of a mAb #3 cIEF separation.
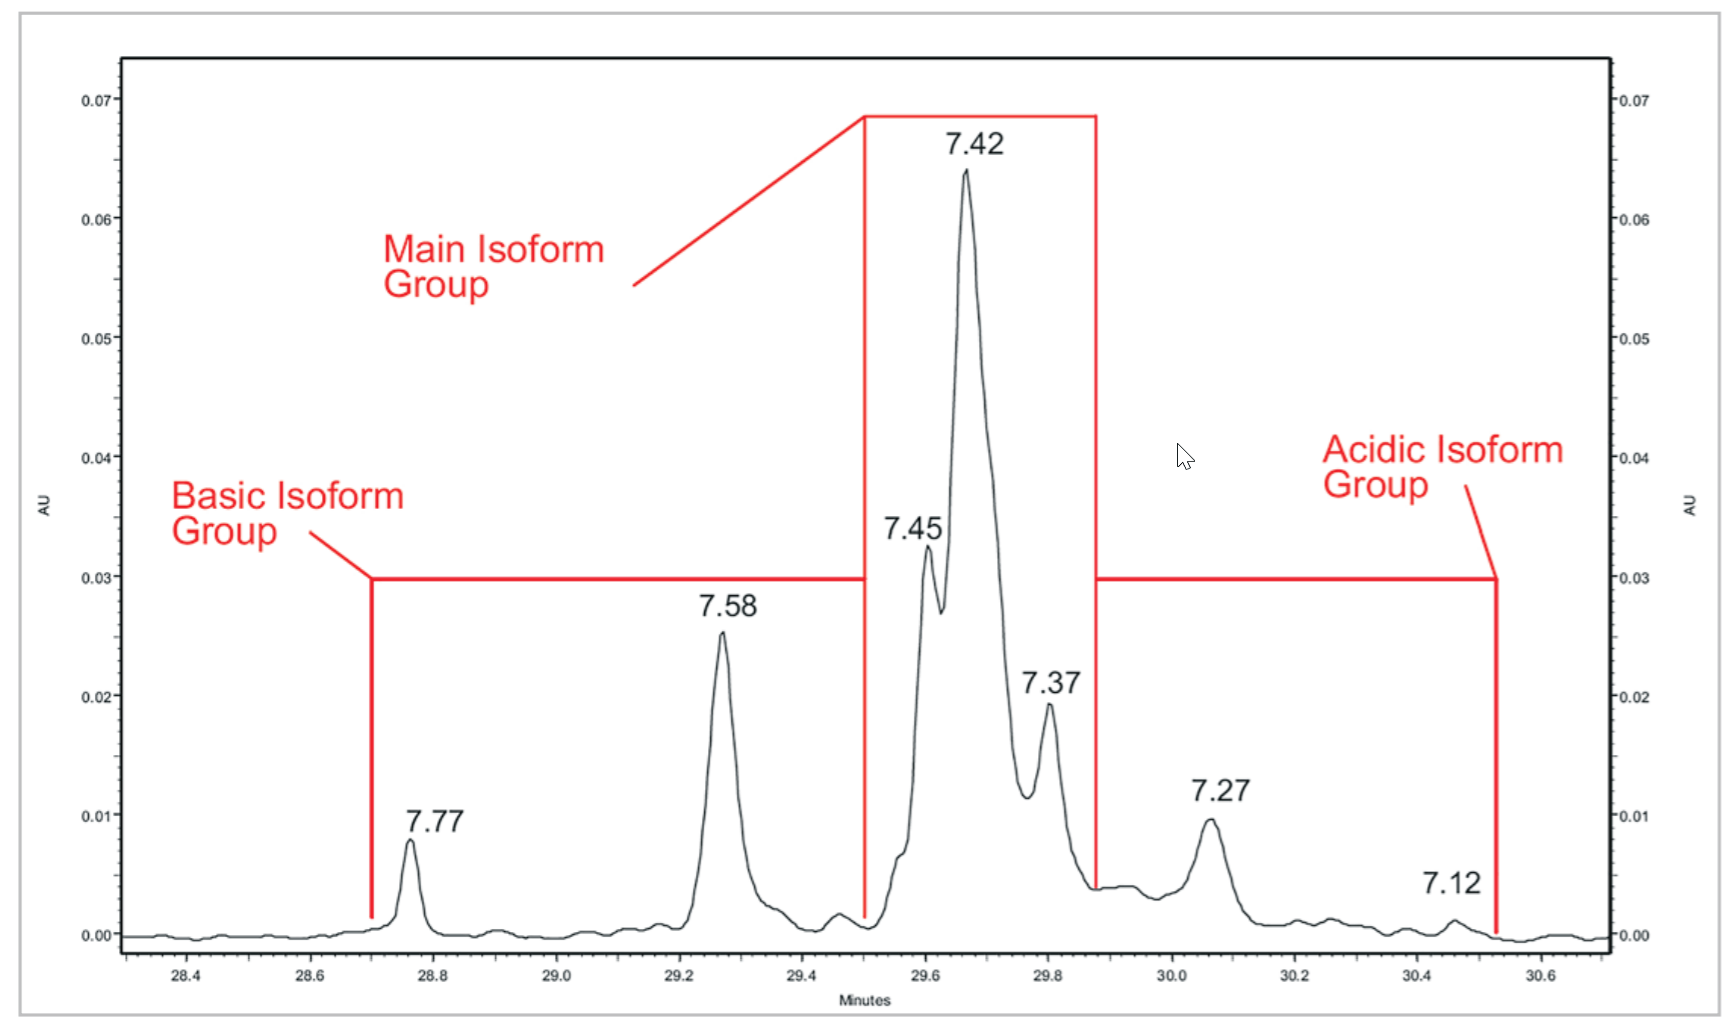
Table 6. Quantitative Analysis of mAb #3. Quantitative analysis was performed using the same method as mAb #1.
Conclusion
A single separation method can be employed to perform cIEF analysis of multiple mAbs across a broad pH range. The use of a single method allows for preparation of master separation mixes which can help reduce pipetting errors and inter-sample variability. Workflow is greatly simplified by the use of a platform method, reducing the chances for operator error and increasing overall efficiency in method development. The resulting reduction or elimination of method optimization also allows for easier scale up of cIEF analysis in routine use environments.
The analytical power of the cIEF separation technique is illustrated by the three very different peak profiles produced in each mAb separation. The reproducibility of the separation method was demonstrated by performing a series of separations on six separate days using multiple instruments with multiple lots of reagents. Statistical analysis of pI and isoform group percent composition confirms that highly reproducible cIEF separations of mAbs can be achieved even in the previously problematic basic region of the pH gradient.
References
1. Righetti P.G. “Determination of the Isoelectric Point of Proteins by Capillary Isoelectric Focusing.” J Chromatogr. 2004, 1037, 491-499.
2. Righetti P.G., Simo C., Sebastiano R., Attilio C. “Carrier Ampholytes for IEF, on Their Fortieth Anniversary (1967-2007), Brought to Trial in Court: The Verdict.” Electrophoresis 2007, 28, 3799-3810.
3. North R.Y., Vigh Gy. “Determination of the Operational pH Value of a Buffering Membrane by an Isoelectric Separation of a Carrier Ampholyte Mixture.” Electrophoresis 2008, 29 (in press).
4. Shimura K., Wang Z., Matsumoto H., Kasai K. “Synthetic Oligopeptides as Isoelectric Point Markers for Capillary Isoelectric Focusing with Ultraviolet Absorption Detection.” Electrophoresis 2000, 21, 603-10.
5. Cruzado-Park I., Mack S., and Ratnayake C. “Identification of System Parameters Critical for High-Performance cIEF.” Beckman Coulter, Inc. Application Information Bulletin, 2008. p/n RUO-MKT-02-6962-A.
6. Cruzado-Park I., Mack S., and Ratnayake C. “A Robust cIEF Method: Intermediate Precision for the pH 5-7 Range.” Beckman Coulter, Inc. Application Information Bulletin, 2008. p/n RUO-MKT-02-7256-A.
Who is SCIEX? SCIEX company’s global leadership and worldclass service and support in the capillary electrophoresis and liquid chromatography-mass spectrometry industry have made it a trusted partner to thousands of the scientists and lab analysts worldwide who are focused on basic research, drug discovery and development, food and environmental testing, forensics and clinical research. Who is SCIEX? SCIEX company’s global leadership and worldclass service and support in the capillary electrophoresis and liquid chromatography-mass spectrometry industry have made it a trusted partner to thousands of the scientists and lab analysts worldwide who are focused on basic research, drug discovery and development, food and environmental testing, forensics and clinical research.
Contact Us: sciex.com/contact-us