Native CZE-MS of proteins and protein complexes using a neutral OptiMS surface cartridge
Zhichang Yang1 , Zuzana Demianova1 , Fang Wang1 , Sahana Mollah1 , Kevin Jooss2 , Neil L Kelleher2
1SCIEX, Brea, CA, USA; 2Northwestern University, Evanston, IL, USA
Abstract
Native mass spectrometry (nMS) enables the characterization of protein compositions, structure, and interactions with ligands, metals, and drugs as it preserves the non-covalent interactions during analysis. Front-end separation of protein assemblies in native mode improves sensitivity and reduces sample complexity. Capillary zone electrophoresis (CZE) can be coupled online with MS to provide high-efficiency and highly sensitive separation of analytes, and more importantly, native separation of proteins using MS-compatible aqueous buffer is accessible. Here, a CESI 8000 Plus system has been coupled to a TripleTOF 6600+ system for native protein and protein complex characterization.
Introduction
Characterization of proteins in native mode is very important. A detailed description of protein functions requires the characterization of protein in the native state to understand the protein ensemble conformation, protein/protein interaction, and protein-ligand, metal, and drug binding. 2 Also, native conditions promote lower charge states, leading to increased m/z spacing, which facilitates the detection of smaller mass differences between proteoforms, 3 — for example, the identification and quantification of different drug-to-antibody ratio (DAR) populations of antibody-drug-conjugates (ADCs), and proteoforms with similar mass. 4
nMS provides an effective way to characterize protein in native mode. When analyzing complex protein mixtures by nMS, a front-end separation is necessary to reduce ion suppression and signal superposition. Typically, size exclusion chromatography (SEC), 5 hydrophobic interaction chromatography(HIC), 6 ionexchange chromatography (IEC), 7 and native Gel-Eluted Liquid Fraction Entrapment Electrophoresis (GELFrEE) 8 have been used for offline protein separation and fraction collection. Protein fractions are then cleaned and directly infused for nMS analysis, mainly because the buffer/electrolytes used in these techniques are not compatible with MS. CZE coupled to MS provides online separation of peptides and intact proteins with high separation efficiency and sensitivity. More importantly, analytes preserve their native structures when MS-compatible and volatile aqueous reagents are used in CE separation.
In this technical note, we coupled a CESI 8000 Plus to a TripleTOF 6600+ system, and demonstrated the separation and characterization of a standard protein mixture covering a wide molecular weight (MW) range from 30 kDa to 230 kDa in the native state. The two-period mode capability of the TripleTOF 6600+ system enabled fast parameter optimization in a single run for a balanced and optimized signal of proteins mixtures.
Key Features
- The capability of separating proteins with their native structure preserved by differences in electrophoretic mobility.
- Characterization of proteins in native mode. Identification of different proteoforms such as glycol- and truncated forms.
- High scanning speed of TripleTOF 6600+ system enables multi-period mode for fast MS parameters optimiztion.
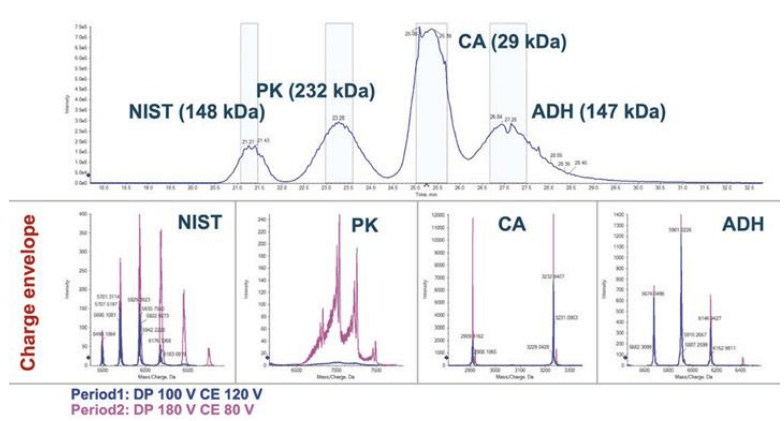
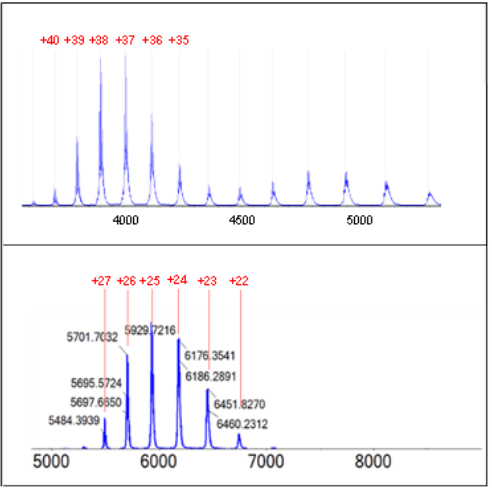
Figure 1. Analysis of protein mixture with two-period mode. Top panel shows the separation of the four proteins by CESI-nMS. The bottom panels show the MS 1 spectra of the four proteins. The two-period mode had different DP and CE settings applied.
Methods
Sample preparation: Protein stock solutions (10 mg/ml) were desalted, and buffer exchanged into 40 mM ammonium acetate (NH4Ac) (pH ≈ 6.8) using centrifugal MWCO filters. First, the filters were equilibrated with 500 μL of 40 mM NH4Ac and spun at 12,000g for 5 min. Each protein standard was then dispensed into the filter device individually and spun at 12,000 g until the sample was concentrated to a volume of 100 μL or less. In this work, ten consecutive buffer exchanges were performed by adding 40 mM NH4Ac up to 500 μL per spin. Individual protein samples and a protein mixture were diluted with 40 mM NH4Ac to final concentrations listed in Table 1.
Instrument configuration: CESI 8000 Plus system with the neutral OptiMS surface cartridge (SCIEX, P/N B07368) was coupled with the TripleTOF 6600+ system through a NanoSpray III source and a CESI adapter (SCIEX, P/N B07363). 32 Karat and Analyst TF software 1.8.1 were used to operate the CESIMS.
Native capillary electrophoresis and mass spectrometry: The separation conditions are listed in Table 2. Direct infusion using 15 kV voltage (positive polarity) with 5 psi supplemental pressure at both cartridge ends were applied to optimize the CESI sprayer position and spray stability per protein.
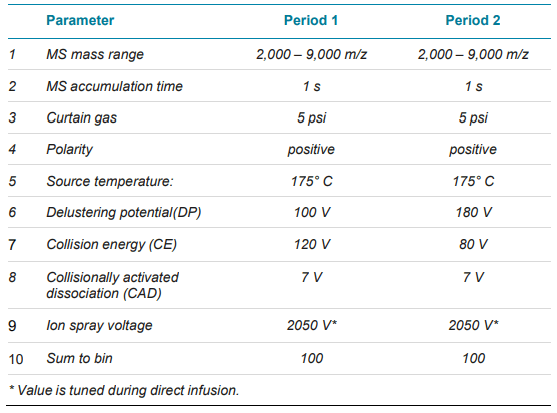
The final parameters are listed in Table 3. A two periods MS method was developed to obtain a high-resolution MS spectrum for each protein complex in the prepared mixture (Table 1).
Important: For cartridge longevity and clogging prevention, it is crucial to use a capillary clean-up method and to keep the CESI spray tip emerged in water. The cleaning method consists of rinsing the separation line of the cartridge at 100 psi with 0.1 M HCI for 10 min, followed by a water rinse of the separation and conductive lines for 10 minutes each.
Data Processing: SCIEX OS software was used to visualize and analyze measured data
Table 1. Experimental details of the protein mixture used in this study.
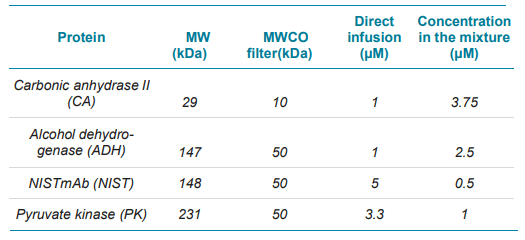
Table 2. CESI conditions were used to separate the protein mixture.
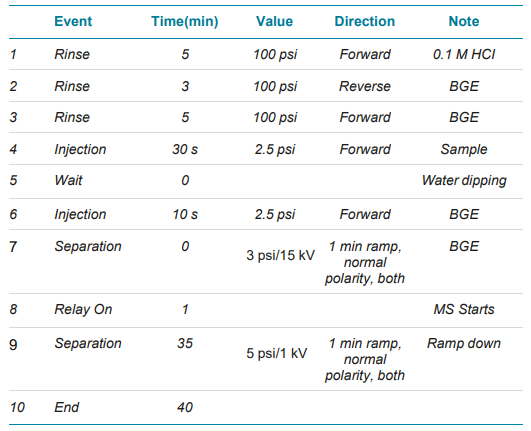
Table 3. Mass spectrometry method.
Results and discussion
CZE under native condition and the charge envelope
A standard protein mixture containing four proteins with MW ranging from 30 kDa to 230 kDa was analyzed by the CESI system coupled to a TripleTOF 6600+ system. The concentrations of the four proteins were adjusted to ensure sufficient signal for each analyte.
It has been demonstrated that increasing the ammonium acetate (NH4Ac) concentration improved the separation of the four proteins.3 However, the increased NH4Ac concentration also resulted in the separation current above the safety limit of 5 µA.3 Thus, 40 mM NH4Ac was selected as both background electrolyte (BGE) and leading electrolyte (LE) to preserve the native structure of the four proteins. The four proteins were separated by CESI (capillary electrophoresis electronspray ionization) as shown in the top panel of Figure 1. Under native conditions, fewer protonation events occur, leading to lower charge state envelopes and higher m/z range in MS spectrum. This phenomenon can be explained by (i) less protons available at higher pH and by (ii) preserving the tertiary and quaternary structure, where moieties of amino acid sequence is not accessible for protonation. Figure 2 illustrates this behavior. The upper panel shows the typical charge envelope of a denatured state recognized by the high charge state. In contrast, the bottom panel shows the native form of NISTmAb featured by the lower charge state.
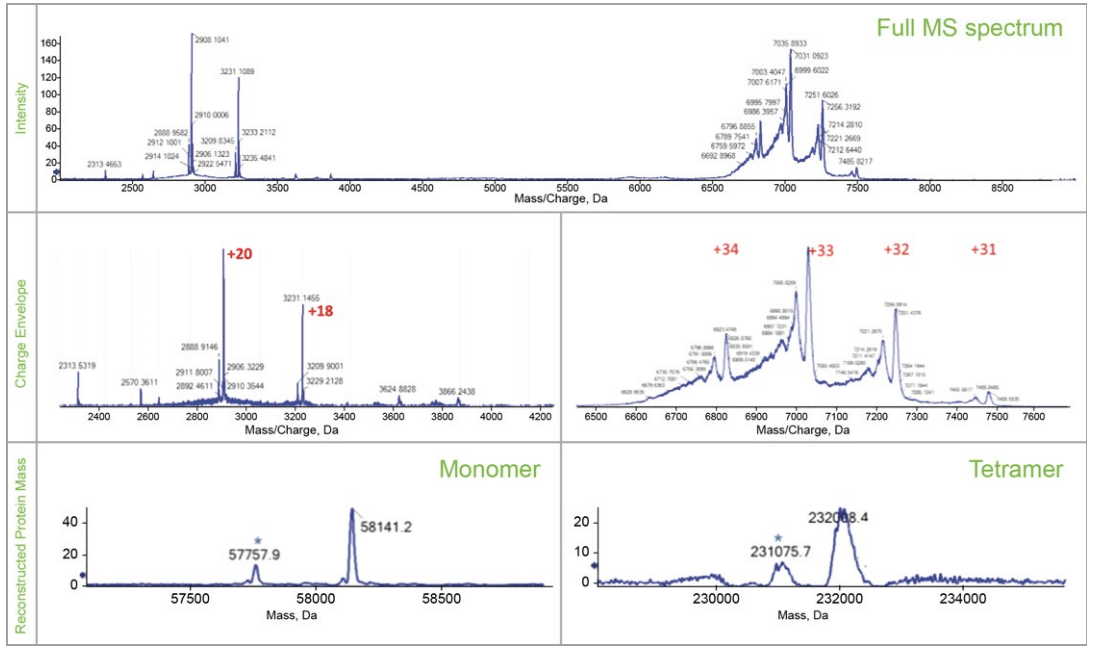
The highest abundance charge states for all four proteins are closer to the results of reference 3 in which the same standard protein mixture was analyzed by an Orbitrap MS with extended mass range (EMR) under native condition, as shown in Table 4, indicating the transferability of the developed native CZE method to different MS instruments. Two examples (NISTmAb and pyruvate kinase) of native protein characterization are illustrated below. MS spectrum of NISTmAb charge envelope shown on the top panel of Figure 3, revealed the proteoforms with different glycosylation patterns with good resolution and signal. The reconstructed spectrum shows good glycoform distribution of NISTmAb with relative abundance information in the bottom panel. The largest protein complex, pyruvate kinase (PK)—a 231 kDa, tetramer—was well separated from the other three, as shown in Figure 1. The full MS spectrum of PK shows the detection of both the tetramer and the monomer at higher m/z and lower m/z range respectively, (top panel of Figure 4).
The charge envelopes of the monomers and tetramer are shown in the middle panels of Figure 4. After deconvolution, the bottom panels show the reconstructed spectra of both the monomer and the tetramer, possibly from PTMs and truncations. Further MS2 analysis may be used to confirm the identification of the proteoforms.
Figure 2. Two charge envelops of NISTmAb in denatured (upper) and native (bottom) mode. The analysis of NISTmAb in denatured mode was processed under acidic reverse phase conditions. The analysis of NISTmAb in native mode was processed under neutral CESI condition.
Multi-period method for rapid MS method optimization
The NISTmAb and PK analysis were used to demonstrate the ability of the CESI-TripleTOF 6600+ system to expedite the protein characterization in native mode. The stability of native assemblies is sensitive to the MS parameters, especially those controlling the energy imposed on the ions within the instrumentation.2 Optimal MS parameters vary depending on the target analyte, and is crucial to obtain the highest quality data. The fast-scanning TripleTOF 6600+ system is capable of multi-period analysis mode where different settings of declustering potential (DP) and collision energy (CE) can be tested in a single run. In this work, a two-period mode was applied with different DP and CE settings in each period. Figure 1 shows the declustering potential (DP) and collision energy (CE) impact on the signal intensity of PK. Period 1 (data in blue trace) was set with DP of 100V and CE of 120 eV, whereas period 2 (data in pink trace) was set with DP 180V and CE of 80 eV. The comparison between the two setups indicates that a higher DP promotes a more efficient desolvation of the tetramer while displaying a good quality charge envelope.
Instead of adjusting DP and CE per protein through direct infusion, the two-period mode enables fast parameter optimization within a single run for protein mixture analysis. For complex sample analysis such as proteomics, where pure protein standard is not available, the multi-period capability can be a powerful tool to improve data quality more efficiently.
Table 4. Comparison of highest abundance charge states.
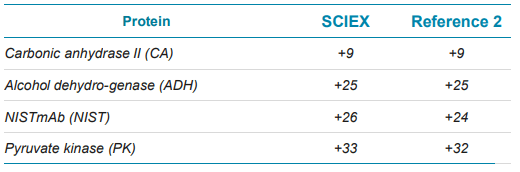
Figure 3. Characterization of NISTmAb in native mode. The top panel shows the charge envelop of NISTmAb. The bottom panel shows the reconstructed spectrum of NISTmAb with different glycoforms.
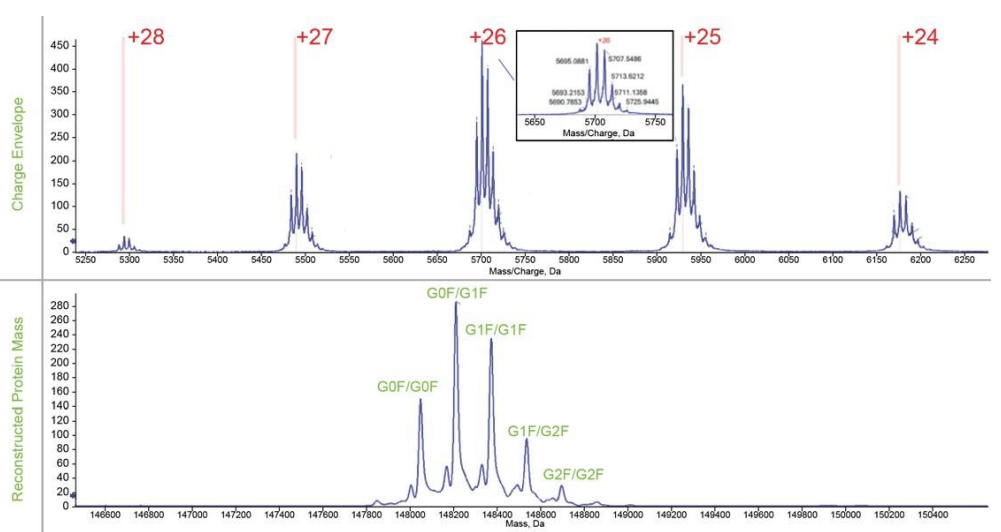
Figure 4. Characterization of the pyruvate kinase in native mode. Top panel shows full MS spectrum of PK tetramer and PK monomer. Middle panels show the charge envelopes of the PK monomer and PK tetramer. Bottom panels show the reconstructed spectra of the PK monomer and PK tetramer
Conclusions
- CESI-nMS platform enabled separation of four proteins in mixture with native features preserved. The four proteins spanned a wide MW range from 30 kDa to 230 kDa.
- Characterization of the proteins in native mode can be achieved, showcasing different proteoforms such as the glycoforms of NISTmAb.
- A two-period mode was applied during native CESI-MS analysis with different DP and CE settings. The two-period mode enabled fast parameter optimization to achieve highquality data. content here.
References
- Heck AJ et al. Native mass spectrometry: a bridge between interactomics and structural biology. Nat Methods. 2008 Nov;5(11):927-33.
- Shehu A et al. On the characterization of protein native state ensembles. Biophys J. 2007 Mar 1; 92(5): 1503-11.
- Jooß K et al. Standard procedures for native CZE-MS of proteins and protein complexes up to 800 kDa. Electrophoresis. 2021 May;42(9-10): 1050-1059.
- Hernandez-Alba O et al. Analysis of ADCs by Native Mass Spectrometry. Methods Mol Biol. 2020; 2078: 197-211.
- Kükrer B et al. Mass spectrometric analysis of intact human monoclonal antibody aggregates fractionated by sizeexclusion chromatography. Pharm Res. 2010 Oct; 27(10): 2197-204.
- Debaene F et al. Innovative native MS methodologies for antibody drug conjugate characterization: High resolution native MS and IM-MS for average DAR and DAR distribution assessment. Anal Chem. 2014 Nov 4; 86(21): 10674-83.
- Muneeruddin K et al. Characterization of intact protein conjugates and biopharmaceuticals using ion-exchange chromatography with online detection by native electrospray ionization mass spectrometry and top-down tandem mass spectrometry. Anal Chem. 2015 Oct 6; 87(19): 10138-45.
- Skinner OS et al. Native GELFrEE: a new separation technique for biomolecular assemblies. Anal Chem. 2015 Mar 3; 87(5): 3032-8.