Purity analysis of adeno-associated virus (AAV) capsid proteins using CE-LIF technology
Tingting Li, Handy Yowanto, Sahana Mollah
SCIEX, Brea, CA
Abstract
CE-SDS (Capillary Electrophoresis Sodium Dodecyl Sulfate) technology is popular for AAV capsid protein analysis in the cell and gene therapy industry because of its automated separation of viral proteins with higher resolution, quantitation capability, better reproducibility and is less labor-intensive than traditional SDS-PAGE (Sodium Dodecyl Sulfate Polyacrylamide Gel Electrophoresis). The CE-SDS method using UV or PDA detector and stacking injection technology could provide good results for AAV sample with titer greater than 1X10¹² GC/mL. 2,3,4 However, for in-process AAV product analysis, higher sensitivity is required for purity analysis of AAV with concentration as low as 1X10¹⁰ GC/mL. This technical note utilizes FQ (3-2-(furoyl quinoline-2-carboxaldehyde) dye for sample labeling and a laser-induced fluorescence (LIF) detector with 488nm solid-state laser and an emission filter of 600nm for sample detection to increase the sensitivity of AAV capsid purity analysis. It demonstrates the capability of this CE-SDS-LIF method for purity analysis of AAV viral proteins to as low as 1X10¹⁰ GC/mL with easy sample preparation, excellent resolving power, good repeatability and linearity of absorbance response to sample concentration.

Introduction
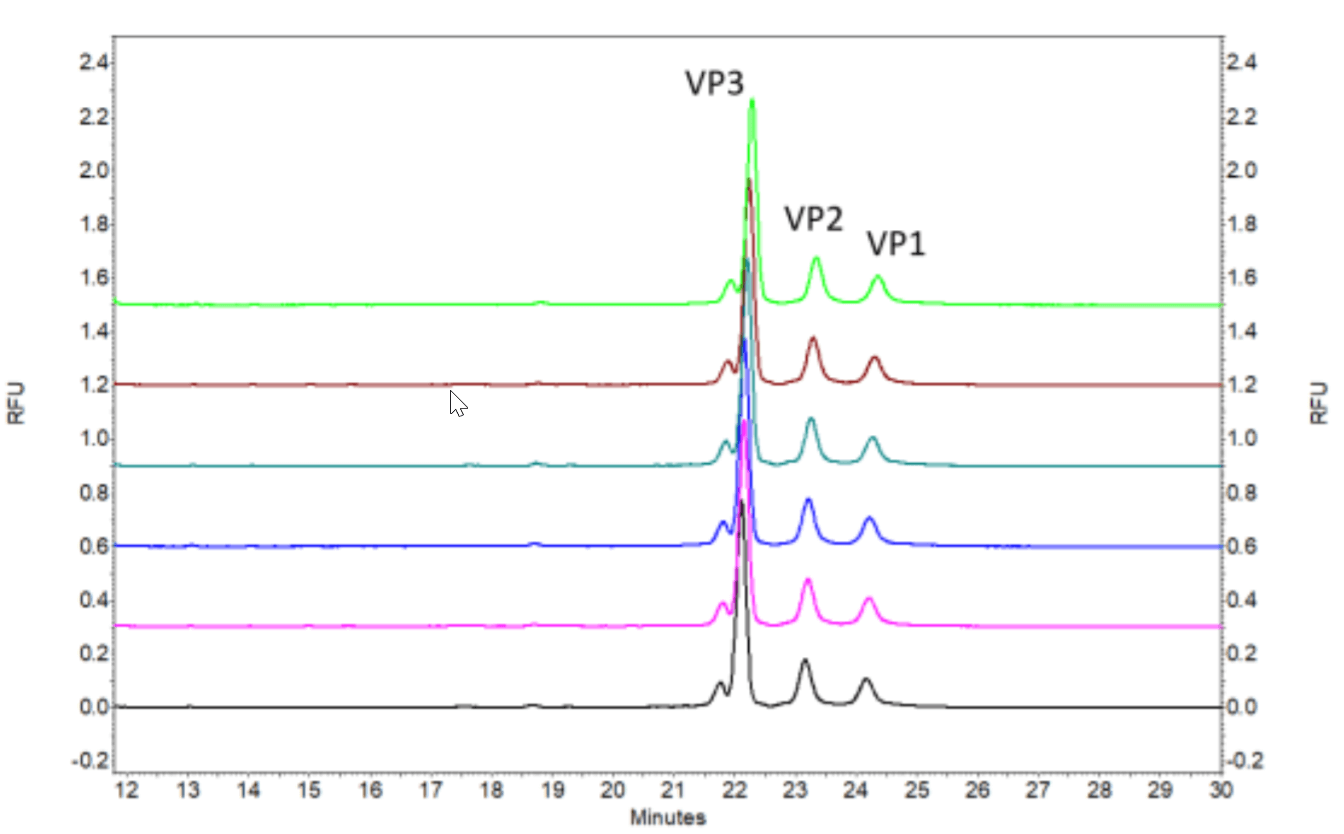
Adeno-associated virus (AAV) is one of the most commonly used gene delivery vehicles in gene therapeutics. It is made of a shell of protein called capsid encompassing a single-stranded DNA of about 4.8kb in size. The viral capsid is composed of three main proteins which are 87kD (VP1), 73kD (VP2) and 61kD (VP3) in size, respectively. Purity analysis of the AAV viral proteins is important for quality assurance and safety of AAV products.1
CE-SDS (Capillary Electrophoresis Sodium Dodecyl Sulfate) technology is popular for AAV capsid protein analysis in the cell and gene therapy industry because of its automated separation of viral proteins with higher resolution, quantitation capability, better reproducibility and is less labor-intensive than traditional SDS-PAGE (Sodium Dodecyl Sulfate Polyacrylamide Gel Electrophoresis). The CE-SDS method using UV or PDA detector and stacking injection technology could provide good results for AAV sample with titer greater than 1X10¹² GC/mL. 2,3,4 However, for in-process AAV product analysis, higher sensitivity is required for purity analysis of AAV with concentration as low as 1X10¹⁰ GC/mL.
This technical note utilizes FQ (3-2-(furoyl quinoline-2- carboxaldehyde) dye for sample labeling and a laser-induced fluorescence (LIF) detector with 488nm solid-state laser and an emission filter of 600nm for sample detection to increase the sensitivity of AAV capsid purity analysis. It demonstrates the capability of this CE-SDS-LIF method for purity analysis of AAV viral proteins to as low as 1X10¹⁰ GC/mL with easy sample preparation, excellent resolving power, good repeatability and linearity of absorbance response to sample concentration.
Figure 2. Six consecutive injections of an AAV8 sample with titer at 1X10¹³GC/mL.
Key Features
- Ultra-high sensitivity AAV capsid purity analysis for AAV samples down to the in-process product analysis requirement level which is 1X 10¹⁰ GC/mL
- Efficient labeling and simple sample preparation procedure in less than 1 hour
- Excellent baseline resolution of VP1, VP2 and VP3
- Good repeatability with RSD% of MT (Migration Time) less than 0.5% and CPA% (Corrected Peak Area%) of viral proteins less than 5% at 1X10¹²GC/mL and 1X10¹³GC/mL
- Good Linearity of absorbance response to sample concentration with R2 =0.9989 from 1X10¹⁰GC/mL to 1.6X 10¹⁴GC/mL
Materials and Methods
Materials
ATTO-TAG FQ and potassium cyanide which are included in ATTO-TAG™ FQ Amine-Derivatization Kit (PN A2334) were purchased from ThermoFisher Scientific (Waltham, MA, U.S.A.). Methanol (PN 1.06018.2500) was obtained from VWR (Radnor, PA, U.S.A.). Sodium dodecyl sulfate (SDS) (PN L4390-100G) and N-Ethylmaleimide (NEM) (PN E3876-5G) were obtained from Sigma-Aldrich (St. Louis, MO, U.S.A.). Amicon Ultra-0.5 Centrifugal Filters with 10,000 NMWL (PN UFC501024) were purchased from EMD Millipore (Billerica, MA, U.S.A.). The SDSMW Analysis Kit (PN 390953) (Figure 1B) was from SCIEX (Framingham, MA, U.S.A.), which includes the SDS-MW gel buffer(proprietary formulation, pH 8, 0.2% SDS), acidic wash solution (0.1 N HCl), basic wash solution (0.1 N NaOH) and the SDS-MW sample buffer(100 mM Tris-HCl pH 9.0, 1%SDS). EZCE Capillary Cartridge (PN A55625, SCIEX, Framingham, MA, U.S.A) pre-assembled with bare fused-silica capillary (50 µm I.D., 30 cm total length, 20 cm effective length) was used for separation (Figure 1C). Universal vials (PN A62251), universal vial caps (PN A62250) and PCR vials (PN 144709) from SCIEX (Framingham, MA, U.S.A.) were used for sample solution loading.
A PA 800 Plus Pharmaceutical Analysis CE system (SCIEX, Framingham, MA, U.S.A.) equipped with a laser-induced fluorescence (LIF) detector with a 600nm emission filter (Figure 1A) was used for all the experiments.
Data acquisition and analysis were performed using 32 KaratTM Software 10.
Packaged AAV2 of pAV-CMV-GFP with titer at 2.24X10¹³GC/mL (titer as supplied by vendor), packaged AAV8 of pAV-CMV-GFP with titer at 1.57 X10¹⁴GC/mL (titer as supplied by vendor) and formulation buffer (Phosphate Buffered Saline, pH 7.5 with 0.001% pluronic F68) were purchased from Vigene Biosciences (Rockville, MD, U.S.A.). Both samples were kept in formulation buffer.
Sample Preparation
4%SDS in 150 mM NEM solution. Weigh 93.75mg NEM and 0.2g SDS in 5mL DI water. Mix to dissolve.
Labeling Solution. The 20 mM FQ dye stock solution was prepared in methanol. This solution was further diluted in DDI water to a final concentration of 2.5 mM and was used as the FQ dye working solution. The nucleophile reagent used was potassium cyanide at a concentration of 30 mM.
1%SDS solution. Dissolve 1g of SDS in 100mL DI water.
Sample Preparation Procedure. 10µL of AAV8 sample solution was mixed with 1.2µL of 4% SDS in 150mM NEM solution in a 0.65 mL micro-centrifuge tube and incubated at 70°C for 5 minutes. Then, the sample solution was mixed with 1.5 µL of 2.5mM FQ dye working solution and 1 µL of 30mM KCN solution and incubated at 70°C for 10minutes. 28 µL of 1% SDS was added to quench the labeling reaction. The sample solution was incubated at 70°C for 5 minutes. At last, 20µL of DI water was added to the mixture. The diluted mixture was transferred to the sample vial for analysis on the PA800 Plus. 5
Buffer exchange or desalting to lower final salt concentration is an optional step before sample solution is loaded into sample vials to improve sensitivity of the method due to less competition from the salt during electrokinetic injection. The mixture of 5% of 1%SDS, 1.25% of formulation buffer in DI water was used as buffer exchange solution in this technical note.
Instrument setup
The user guide of the SDS-MW Analysis kit was followed for instrument setup. Water plug was used in separation method for online sample concentration to improve the sensitivity of the method. 2,3,4
The “Initial Conditions” and “LIF Detector Initial Conditions” were set up as indicated in Figure 3 and Figure 4, respectively. Same initial setup was used for conditioning, separation and shutdown methods.
Figure 3. Initial Conditions.
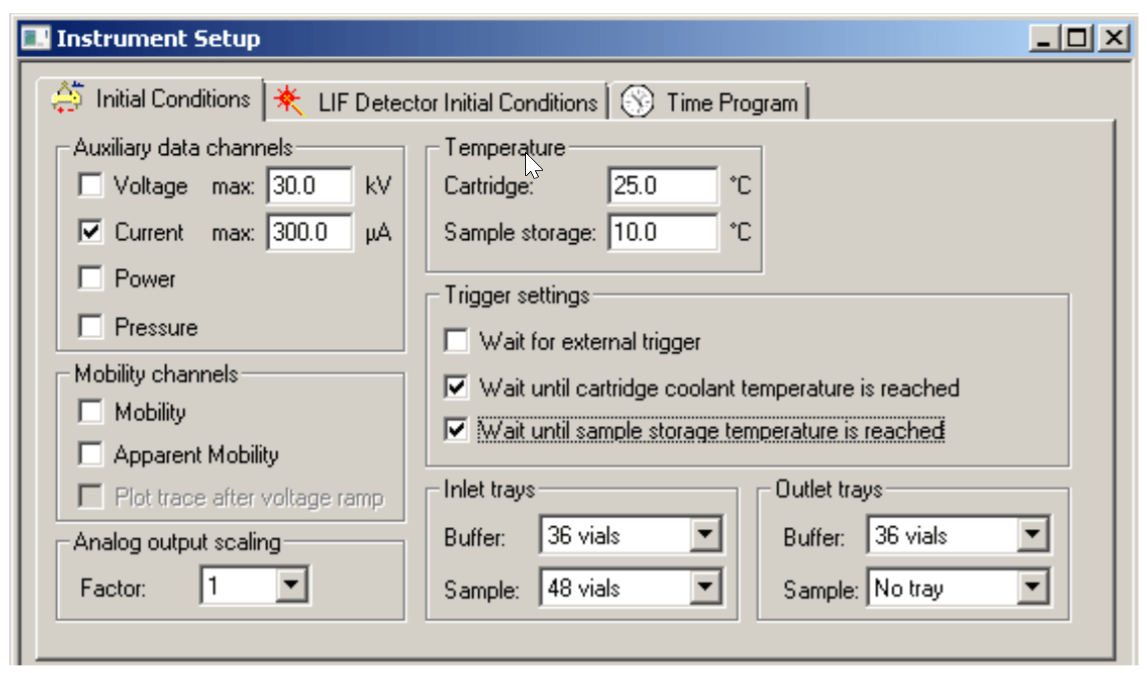
Figure 4. LIF Detector Initial Conditions.

Figure 5. Time Program for Conditioning Method
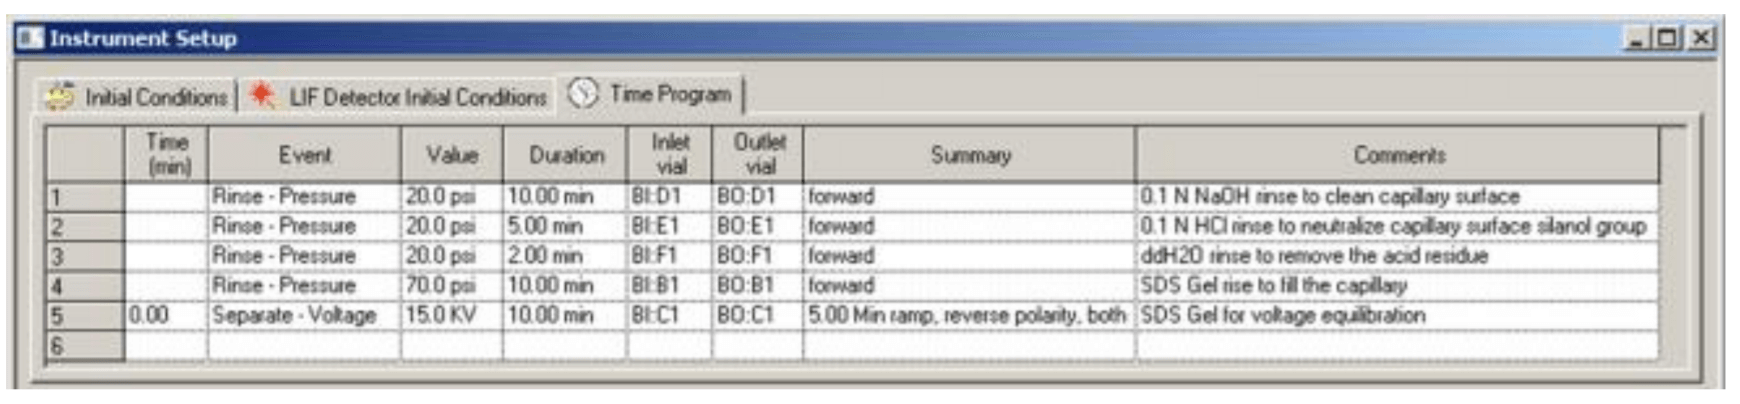
Figure 6. Time Program for Separation Method.
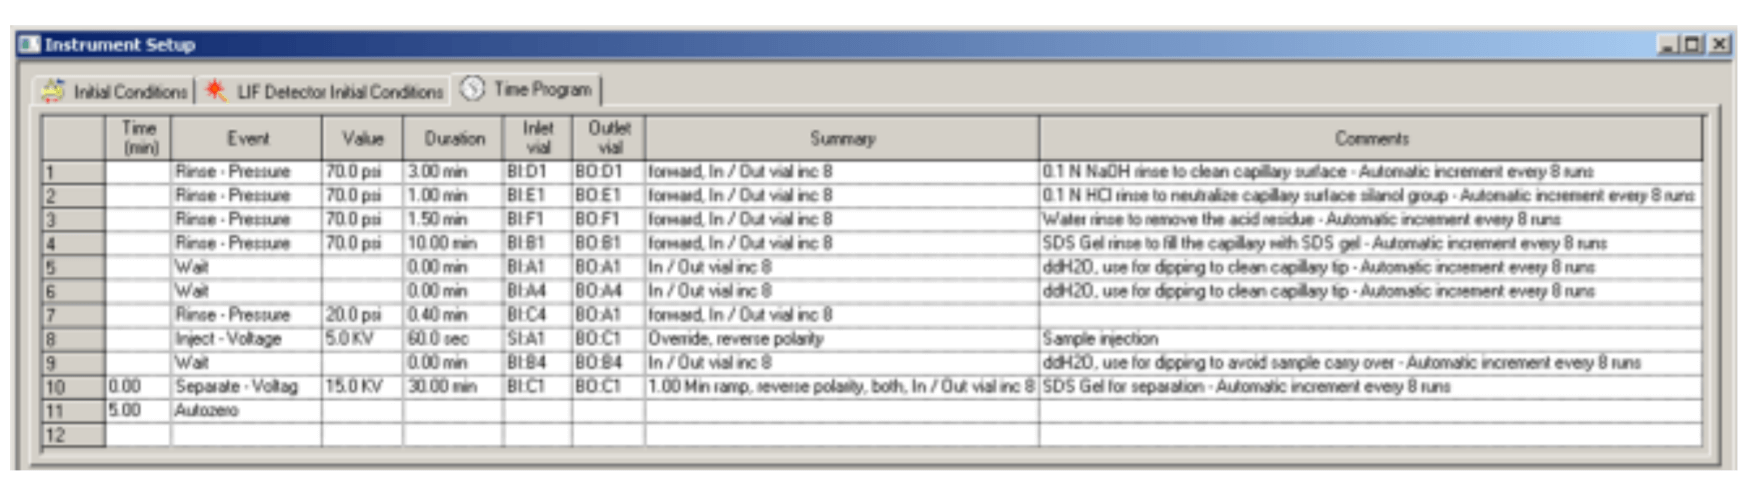
Figure 7. Time Program for Shutdown Method.
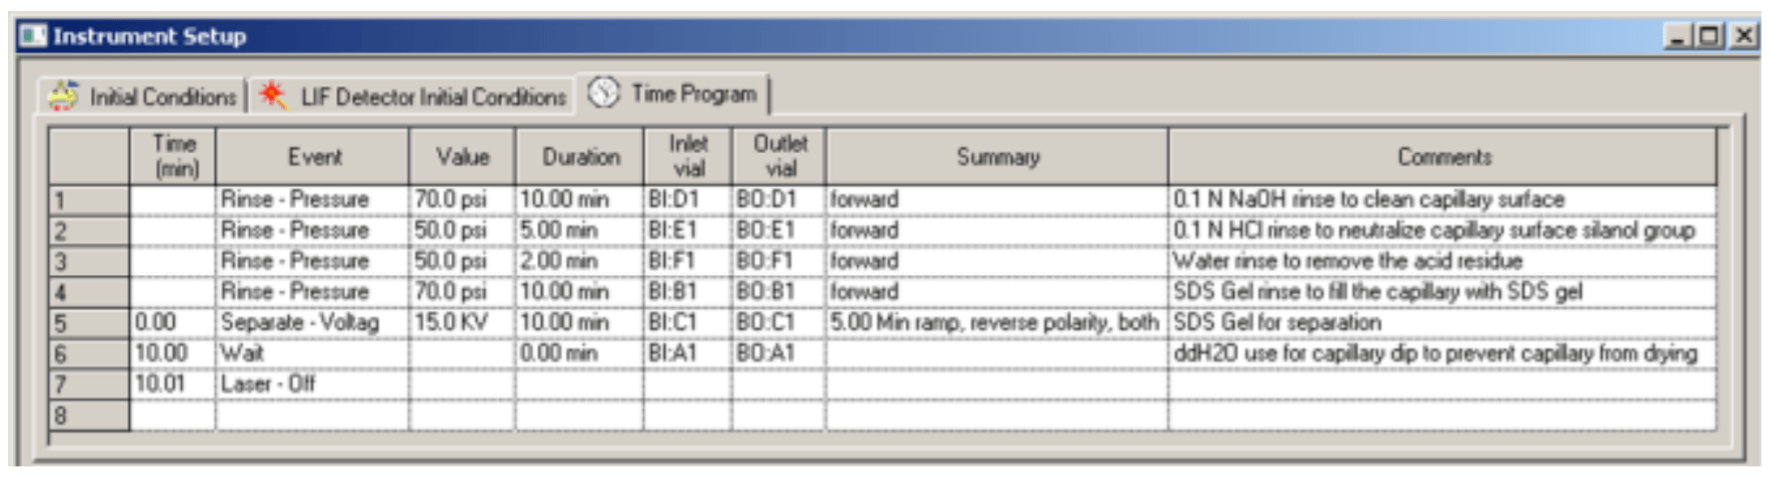
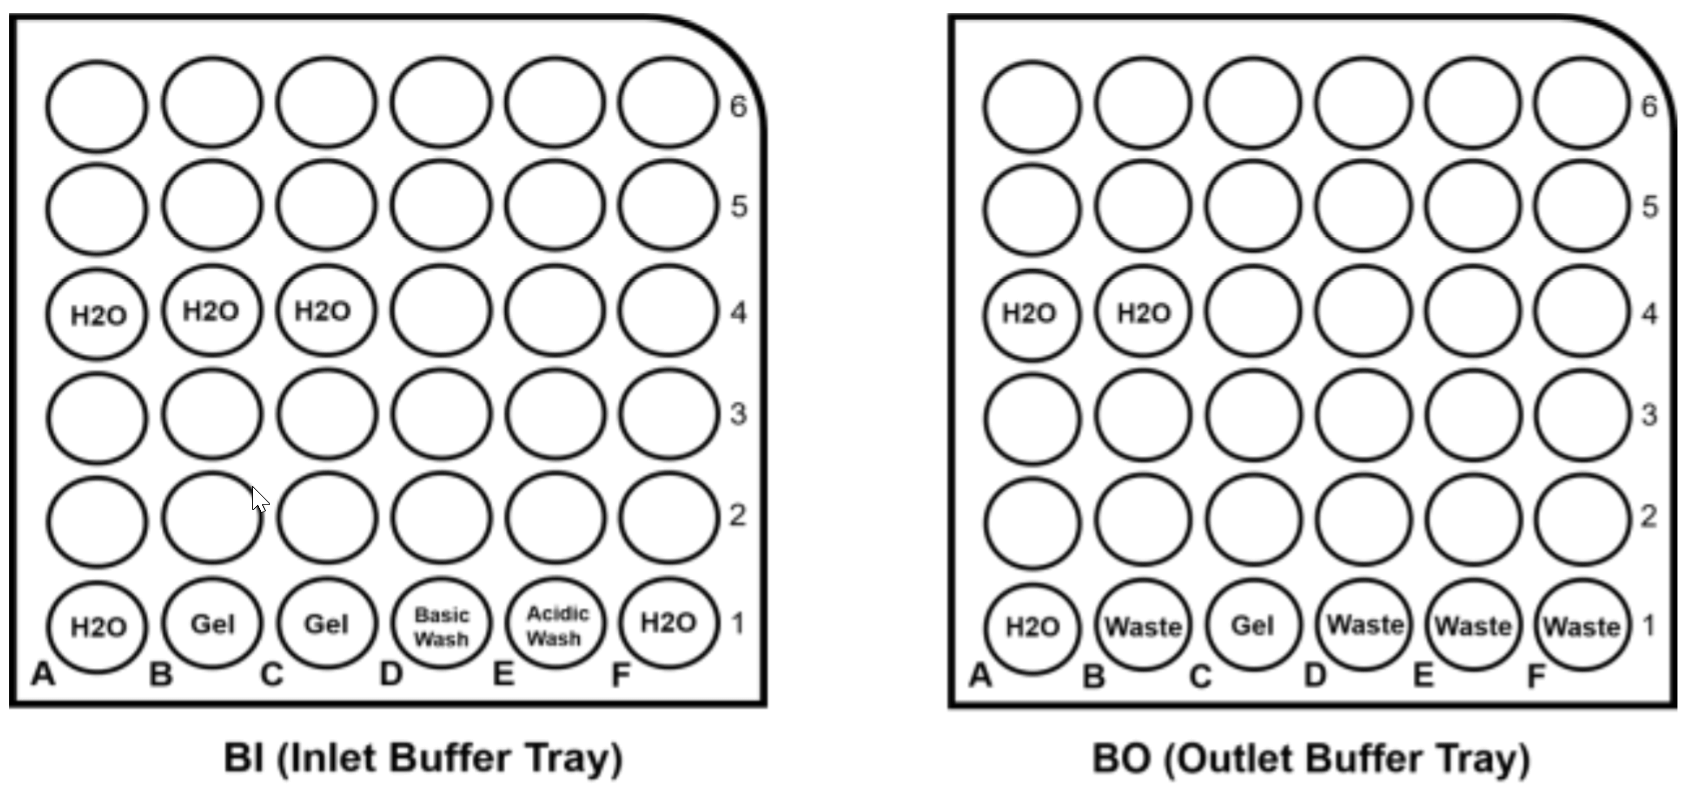
Figure 8. Buffer Tray Configuration.
The time program for conditioning method is illustrated in Figure 5. Figure 6 and Figure 7 are time programs for separation and shutdown method, respectively.
Figure 8 is the configuration for buffer tray setup.
Result and Discussion
AAV8 and AAV2 sample at different titer used in this study were prepared by diluting the AAV8 sample at 1.57X 10¹⁴ GC/mL and AAV2 sample at 2.24X 10¹³ GC/mL by different factors in formulation buffer. If not stated otherwise, buffer exchange step was used for AAV samples at titer no more than 1X10¹² GC/mL before loading into sample vials for PA800 plus analysis. No buffer exchange was done for samples in linearity study.
PDA and LIF detector
AAV8 sample of 1X10¹³GC/mL was used for comparison of capsid protein analysis results using PDA detector and FQ dye labeling with LIF detector. Figure 9a is the electropherogram of 1X10¹³ GC/mL AAV8 capsid protein analysis using FQ dye labeling and LIF detector. Figure 9b is the electropherogram of 1X10¹³ GC/mL AAV8 capsid protein analysis using PDA detector (Sample preparation follow the procedure in Reference 2). The sample solution in Figure 9a was buffer exchanged to the same buffer as the one in Figure 9b before loading into sample vial. By comparing the electropherograms in Figure 9a and Figure 9b, the usage of FQ dye and LIF detector improves the sensitivity of CE-SDS method for AAV capsid purity analysis and provides a better and flatter baseline.
Figure 9. Comparison of capsid protein analysis using PDA detector and using FQ dye labeling with LIF detector. Figure 9a is the electropherogram of 1X10¹³ GC/mL AAV8 capsid protein analysis using FQ dye labeling and LIF detector. Figure 9b is the electropherogram of 1X10¹³ GC/mL AAV8 capsid protein analysis using PDA detector.

Repeatability
This method was evaluated using AAV8 sample at different titers (Figures are not shown in this technical note). Figure 2 shows the six consecutive injections of AAV8 sample at 1X10¹³ GC/mL. Figure 10 shows the six consecutive injections of AAV8 sample at 1X10¹⁰ GC/mL.
Figure 10. Six consecutive injections of an AAV8 sample with titer at 1X10¹⁰GC/mL.

Figure 11. Eight consecutive injections of an AAV2 sample with titer at 1X10¹²GC/mL.
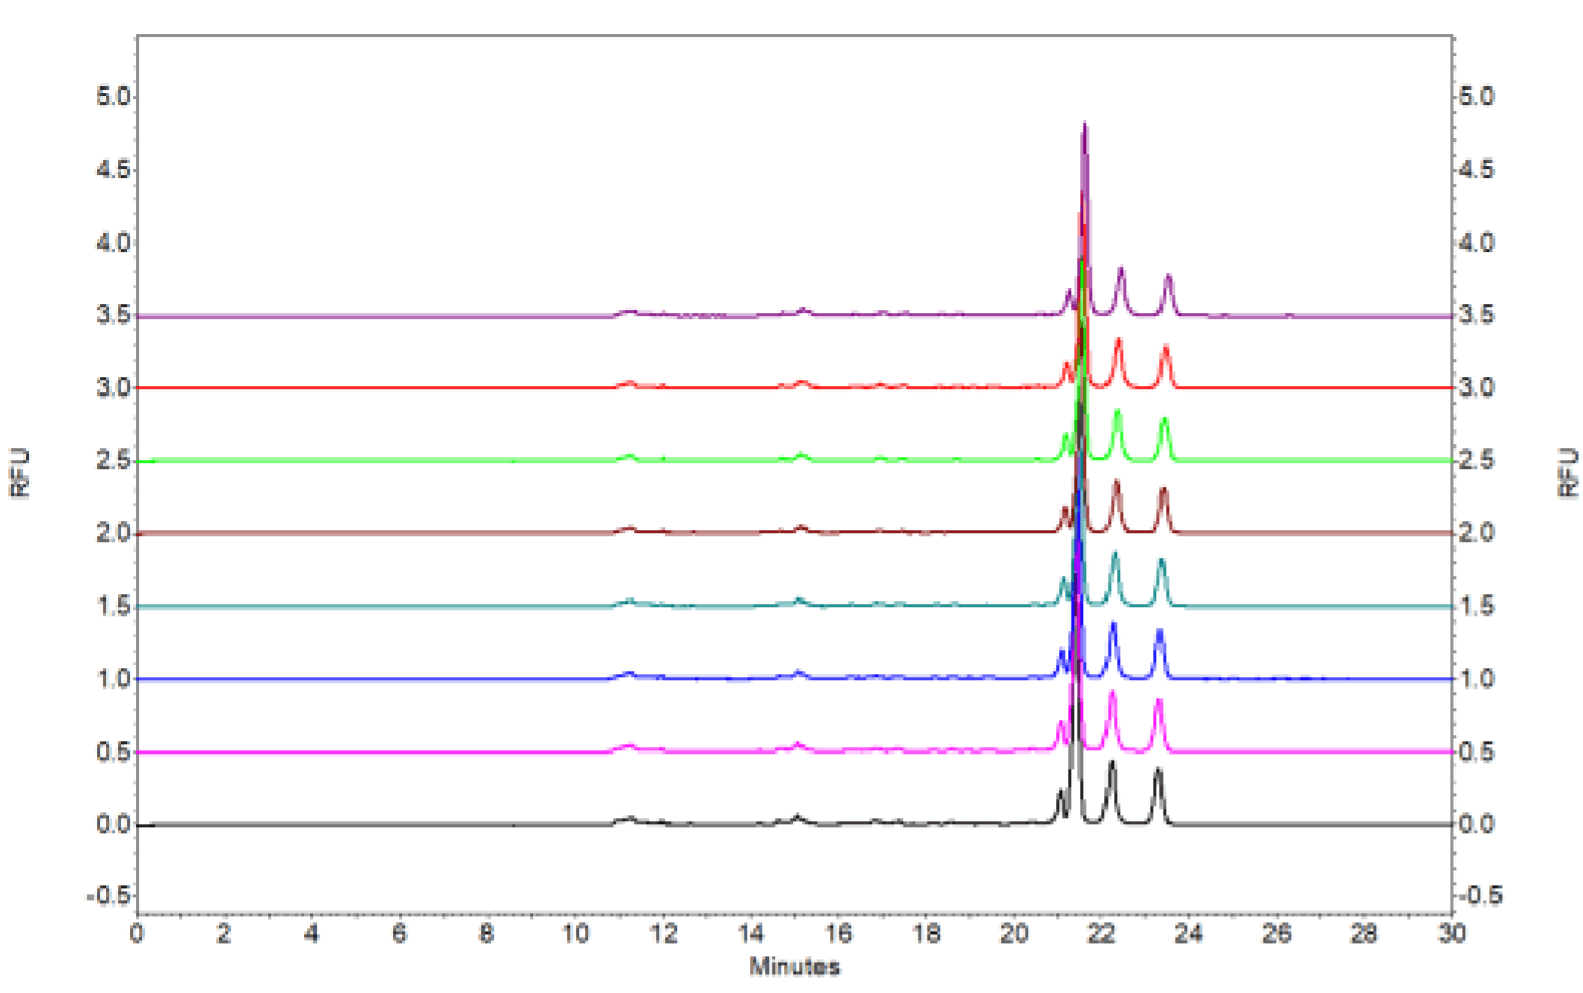
This method was also evaluated using AAV serotype 2 sample at different titers. Figure 11 shows the eight consecutive injections of AAV2 sample at 1X10¹²GC/mL.
Table 1. Migration time repeatability of AAV2 and AAV8 at different concentration.
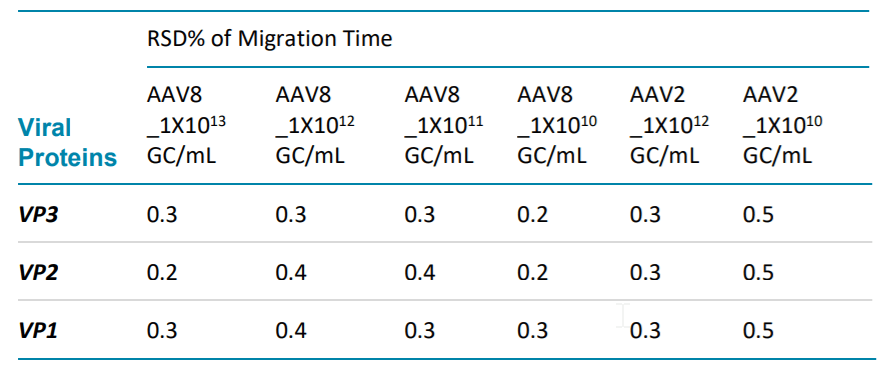
Table 2. Corrected peak area% repeatability of AAV2 and AAV8 at different concentration.
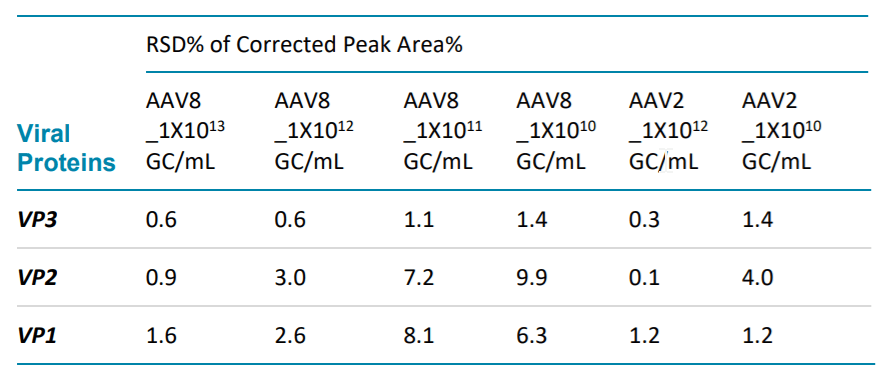
Table 1 and Table 2 demonstrates excellent repeatability of this method by evaluating the RSD% of migration time and RSD% of corrected peak areas% (CPA%) of three viral proteins of AAV2 and AAV8 at different titers. The calculation is based on six consecutive injections of each sample solution for AAV8 samples and 8 consecutive injections of each sample solution for AAV2 samples.
AAV8_1X1013 is AAV8 sample with titer at 1X10¹³
GC/mL. AAV8_1X1012 is AAV8 sample with titer at 1X10¹²
GC/mL. AAV8_1X1011 is AAV8 sample with titer at 1X10¹¹
GC/mL. AAV8_1X1010 is AAV8 sample with titer at 1X10¹⁰
GC/mL. AAV2_1X1012 is AAV2 sample with titer at 1X10 12
GC/mL. AAV2_1X1010 is AAV2 sample with titer at 1X10¹⁰
GC/mL. All the RSD% of MT% are no more than 0.5%. And the RSD% of CPA% are less than 10%.
Figure 12. Linearity of corrected peak area to AAV 8 Sample Concentration (1010 GC/mL).
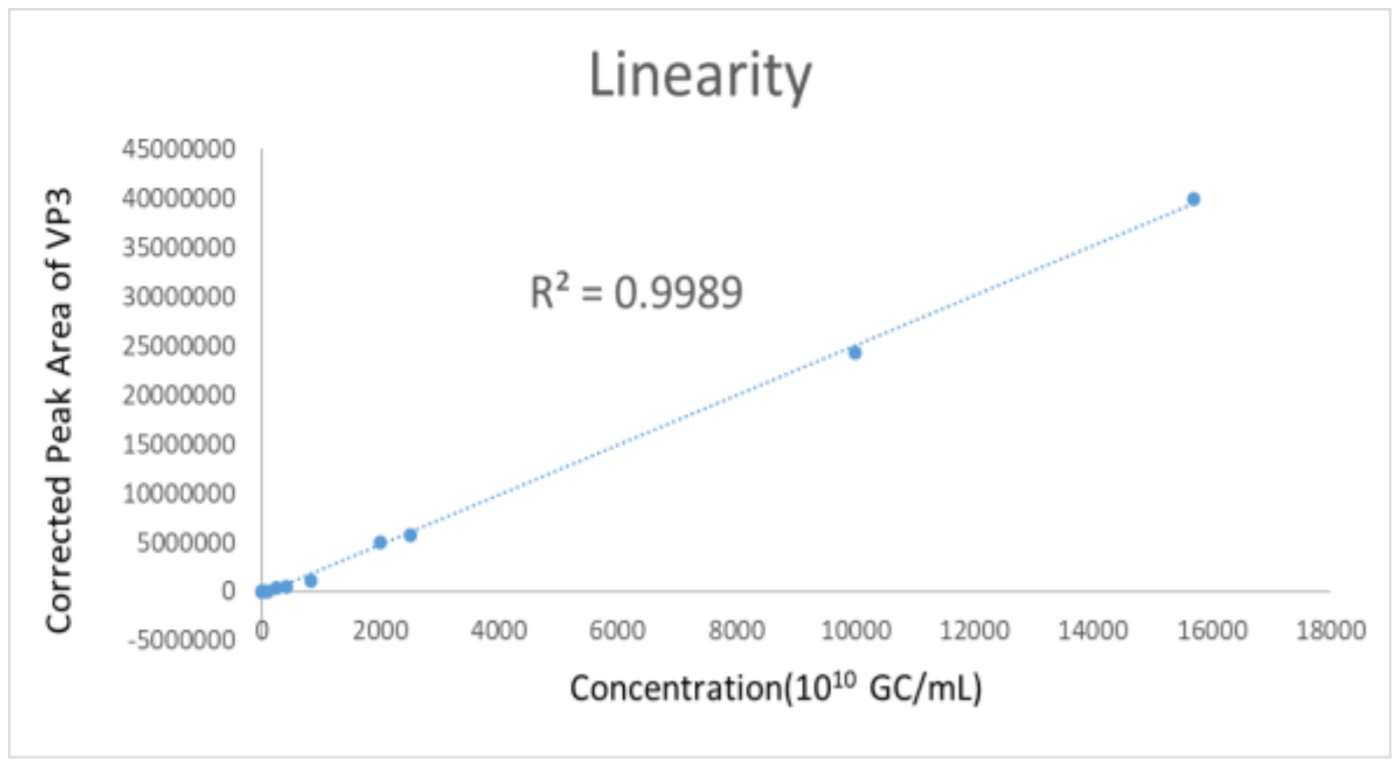
Linearity
This method demonstrates excellent linearity of analyzing AAV8 samples from 1X10¹⁰GC/mL to 1.6X 10¹⁴GC/mL by plotting peak area of VP3 to sample titers (Figure 12). The R2 is 0.9989.
Conclusion
Presented in this technical note is a CE-SDS-LIF method for assessing the purity of Adeno Associated Virus (AAV) viral capsids utilizing FQ fluorescence dye labeling and LIF detector to provide an ultra-high sensitivity for in-process AAV product analysis with titer as low as 1X 10¹⁰ GC/mL. The sample preparation procedure is straight forward and easy. This method also demonstrates excellent resolution of the different viral proteins, good repeatability and linearity of absorbance response vs. sample concentration with R2 =0.9989.
References
- https://med.stanford.edu/gvvc/AAV.html
- SCIEX Technical Note: Purity Analysis of Adeno-Associated Virus(AAV) Capsid Proteins using CE-SDS Method
- Zhang, C.; Meagher, M. M. Anal. Chem. 2017, 89, 3285−3292.
- Quirino, Joselito. (2015). Modern Injection Modes (Stacking) for CE. 10.1002/9783527678129.assep035.
- SCIEX Technical Note: Using Fluorescent Labels to Increase the Sensitivity of IgG Purity and Heterogeneity Assay on PA 800 plus