RNA analysis for CRISPR by capillary electrophoresis with laser-induced fluorescence detection
CE-LIF
Jane Luo, Tingting Li, Marcia Santos, Fang Wang, Sahana Mollah and Handy Yowanto
SCIEX Separations, Brea, California
Abstract
CRISPR (Clustered Regularly Interspaced Short Palindromic Repeats) is an immunological defense mechanism employed by bacteria against invading pathogens. Two RNA molecules are essential for CRISPR: Single Guide RNA (sgRNA) and Cas9 mRNA. In the development of RNA therapeutics, it is often advantageous to co-deliver the sgRNA and the Cas9 mRNA. Consequently, a single analysis method that can test the purity and integrity of both sgRNA and Cas9 mRNA is necessary. Traditional agarose gel can be used for analysis of Cas9 mRNA, but it does not have the resolving power for analysis of sgRNA that is 100 nucleotides (nt) in length. Denaturing polyacrylamide gel can be used to analyze sgRNA, but is not suitable for analyzing Cas9 mRNA which is around 4.5 kilobases long. In this technical note, we describe a CE-LIF method that can analyze both sgRNA and Cas9 mRNA using the same gel matrix at two different concentrations.

Introduction
CRISPR (clustered regularly interspaced short palindromic repeats) is an immunological defense mechanism employed by bacteria against invading pathogens. Cas9 (CRISPR associated protein 9) is an RNA-guided DNA endonuclease. Due to its ability to perform site directed DNA cleavage and to trigger homologous recombination, Cas9 has been utilized as a gene editing tool to introduce gene inactivation and genome modification. In the pharmaceutical industry, CRISPR can improve existing therapies, help find drug targets and test drug candidates.1
Two RNA molecules are essential for CRISPR: single guide RNA (sgRNA) and Cas9 mRNA. During the development of RNA therapeutics, it is often advantageous to co-deliver the sgRNA and the Cas9 mRNA. Purity analysis of these two molecules currently requires two methods: denaturing agarose gel electrophoresis for Cas9 mRNA and denaturing polyacrylamide gel electrophoresis for sgRNA. In this technical note, we describe a CE-LIF method that can analyze both sgRNA and Cas9 mRNA using the same gel matrix. Purity information on both molecules can be obtained in a single sequence run, leading to not only a simplified analysis process, but also savings on time and resources.
Key Features
- Same gel and capillary for the analysis of sgRNA and cas9 mRNA for CRISPR
- Capability to analyze small and large RNA in one sequence
- Single base resolution for oligos down to 15 nucleotides in length with gel matrix in the ssDNA 100-R kit
- Capability of RNA size estimation in the range of 0.2 kb to 10 kb with diluted gel matrix, aiding in understanding of RNA degradation
- Good repeatability with %RSD of MT below 0.7% and %RSD of percent corrected peak area below 2.8%
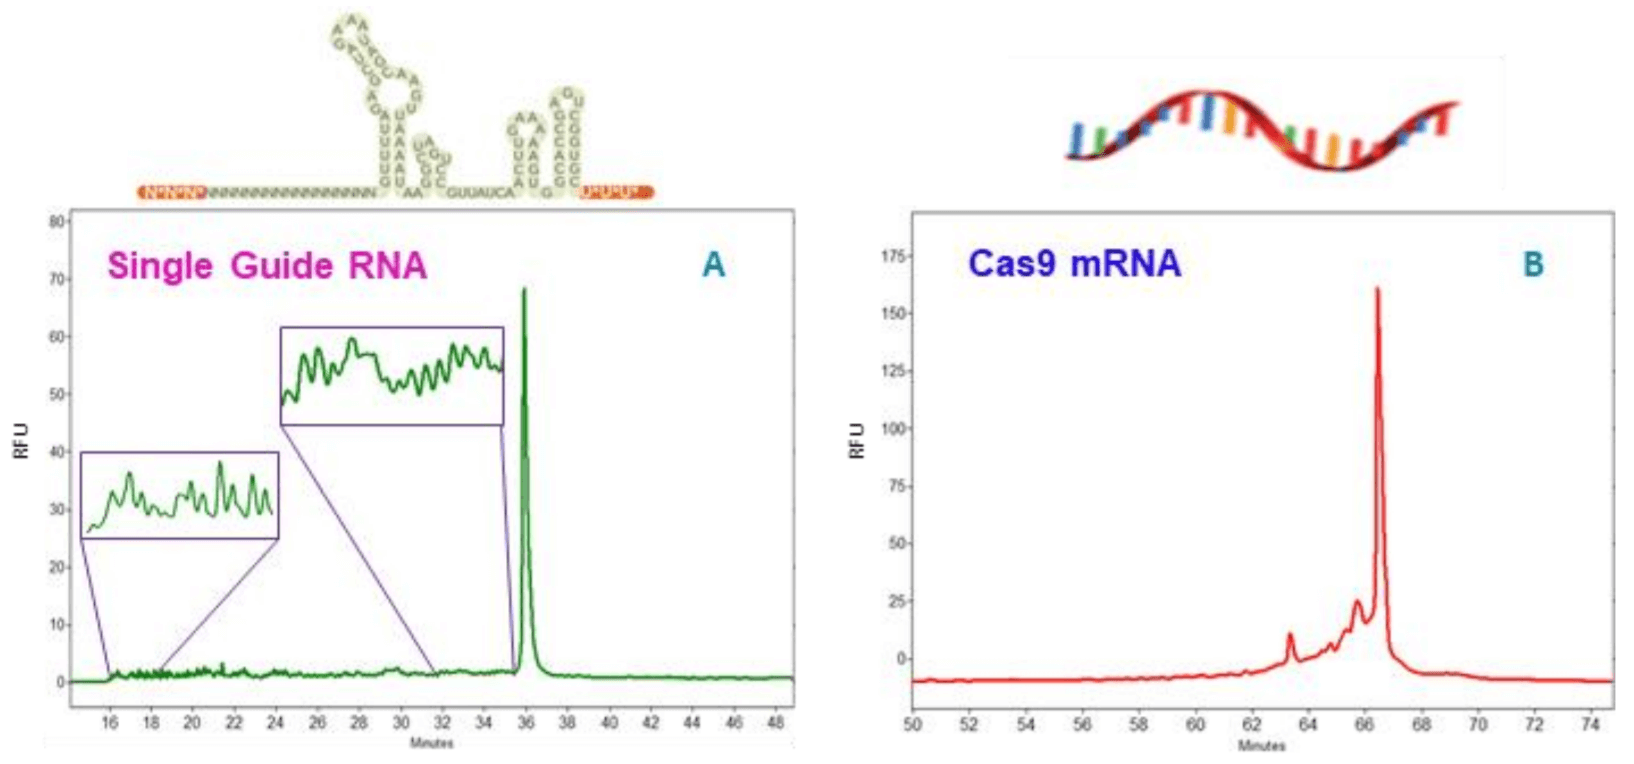
Figure 2. Analysis of HPRT single guide (sg) RNA (A) and cas9 mRNA (B) by CE-LIF. The full length HPRT sgRNA was detected as a single peak around 36 minutes when run in 100-R gel at 30kv for 50 minutes. Oligonucleotides that failed one or multiple coupling during oligo synthesis are located on the left side of the main peak, from 16 to 35.8 minutes with some zoomed-in areas shown in insets. The cas9 mRNA sample was run in diluted 100-R gel for 75 minutes at 6kv. Sample peaks include a major peak at 66.7 minutes plus a few minor peaks between 63 to 66 minutes. The raised baseline indicates the presence of many additional degradation products with gradually decreasing sizes.
Materials, Instrument and Methods
Materials: The eCAP ssDNA 100-R kit (PN 477480, Figure 1B) and LIF Performance Test Mix (PN: 726022) were from SCIEX, Framingham, MA. The Human HPRT Single Guide RNA (sgRNA) (100 nt, PN 217541712) was obtained from IDT, Coralville, Iowa. CleanCap Cas9 mRNA with modification (PN L7206-20, 20 µg) was from TriLink BioTechnologies, San Diego, California. Urea (PN 29700), Nuclease free water (PN AM9932) and SYBR Green II RNA gel stain, 10,000x concentrate in DMSO (PN S7564) were obtained from Thermo Fisher Scientific, Waltham, MA. Transcript RNA markers 0.2-10kb (PN R7020) and 10xTBE buffer (PN 574795), Molecular Biology Grade were from SigmaAldrich, St. Louis, MO. The 0.2 µm syringe filter (PN 4602) was from PALL Corporation, Port Washington New York. Rainin LTS filter tips were from Mettler Toledo, Oakland, California.
Instrument and software: A PA 800 Plus Pharmaceutical Analysis System (Figure 1A) equipped with LIF detector and solid-state laser with excitation wavelength at 488 nm and a 520 nm band pass emission filter were from SCIEX, Framingham, MA. Data acquisition and analysis were performed using 32 Karat software V10.
Tris-Borate-7 M Urea Buffer Preparation: This step must be done one or a few days before running samples. To rehydrate the buffer, 135 ml of 0.2 µm filtered deionized water was added to the bottle containing dry tris-borate in the ssDNA 100-R kit. The solution was mixed with a clean stirring bar for about 30 min or until boric acid was completely dissolved. Then, the entire amount of urea from the urea bottle in the ssDNA 100-R kit was added while the solution was being stirred. The urea was completely dissolved after about 2 hours and the solution became clear. This buffer should be good for one month if stored at 2oC to 8oC. Before sample run, the required amount of buffer was removed and filtered through a 0.2 µm filter. SYBR Green II dye was added at a 1 to 50,000 dilution. About 3.5 ml of this dyecontaining buffer was used for each set of 6 injections.
Preparation of 100-R gel: Five milliliters of freshly filtered TrisBorate- 7 M Urea buffer was added to the lyophilized gel. The solution was stirred for about 3 to 6 hours until the gel is completely dissolved. Alternatively, the gel solution was placed on a LABQUAKE rotator (Barnstead International, Dubuque, IOWA) in a cold room (2oC to 8oC) for 72 hours with gentle rotation. For analysis of single guide RNA (100 nt) and pd(A) 40- 60 Test Mix, undiluted 100-R gel was used as is. For analysis of cas9 mRNA and large RNA molecules, 536 µl of the 100-R gel was diluted 2.8 fold to 1500 µl with filtered Tris-Borate-7 M Urea buffer. After thorough mixing by gentle pipetting and swirling, the diluted gel was spun on a Qualitron DW-41 micro centrifuge at 2000 x g (6400 rpm) for 4 min to remove bubbles.
Cartridge Assembly: DNA capillary (PN 477477) was installed per instructions on kit insert (PN 726479) in the ssDNA 100-R kit. The total capillary length was 40.2 cm with 30 cm as the effective length.
LIF Calibration: To ensure consistent response of LIF detector throughout this study, the LIF detector was calibrated using LIF Calibration Wizard and Performance Test Mix (PN: 726022). following the instructions in LIFluor EnhanCE user’s guide (PN 725824). This calibration was done whenever capillary or LIF detector or the laser was changed.
Preparation of Buffer Trays and Sample Trays: Vial positions for buffer trays are indicated in Figure 3 with rows 1 to 3 for tests with guide RNA and pd(A) 40-60 Test Mix and rows 4 to 6 for tests with Cas9 mRNA and larger RNA molecules. All solutions were pipetted with filter tips. Each “NF Water” vials were filled with 1.5 ml nuclease free (NF) water. Waste vial was filled with 1 ml NF water. “Dilut. 100R” vial was filled with 1.5 ml diluted 100- R gel. “100R Gel” vial was set up with a microvial containing 210 µl 100-R gel. “Sep Buffer” vials were filled with 1.6 ml filtered Tris-Borate-7 M Urea buffer containing SYBR Green II dye.
Sample Preparation: Filter tips were used for all steps. Lyophilized sgRNA was resuspended in 10 mM Tris, pH 7.5, 0.1 mM EDTA to a concentration of 100 µM or 3.246 µg/µl and stored at -80oC in 10 µl aliquots. Before use, it was then diluted with nuclease free water to 25 ng/µl and treated at 80oC for 2 minutes. Immediately after heat treatment, it was placed on ice for 5 minutes before being transferred to a microvial (PN 144709) and loaded onto the sample inlet tray. The pd(A) 40-60 Test Mix from the 100-R kit was resuspended in 500 µl of nuclease free water and stored at -20oC in 50 µl aliquots. It was further diluted 2 fold with NF water before injection. The Sigma Transcript RNA markers and Cas9 mRNA were aliquoted upon first thawing and stored at -80oC in aliquots. Before use, they were diluted to 25 ng/µl (marker) and 10 ng/µl (Cas9 mRNA), and treated at 65oC for 5 minutes, followed by 5 minutes on ice before transferred to a microvial and loaded onto the instrument.
Instrument Set up: Conditions used for analysis of sgRNA and pd(A) 40-60 Test Mix were as described in Figures 4-8. Separation was done at 30 kv for 50 minutes for sgRNA and at 12.4 kv for 50 minutes for the pd(A) 40-60 Test Mix. Conditions for analysis of Cas9 mRNA and the Transcript RNA markers were carried out as shown in Figures 4 to 6 and 8-9.
Figure 3. Schematic set up for Inlet (left) and Outlet (right) buffer trays for analysis of guide RNA (rows 1-3) and Cas9 mRNA (rows 4-6). Each row is enough for at least 6 sample injections. Additional rows can be set up if more samples need to be analyzed.

Figure 4. Settings for “Initial Conditions” tab. Numbers shown are for Cas9 mRNA analysis. Same conditions were used for analysis of sgRNA and pd(A) 40-60 except that the cartridge temperature was set to 20oC and 30oC for sgRNA and pd(A) 40-60 respectively.
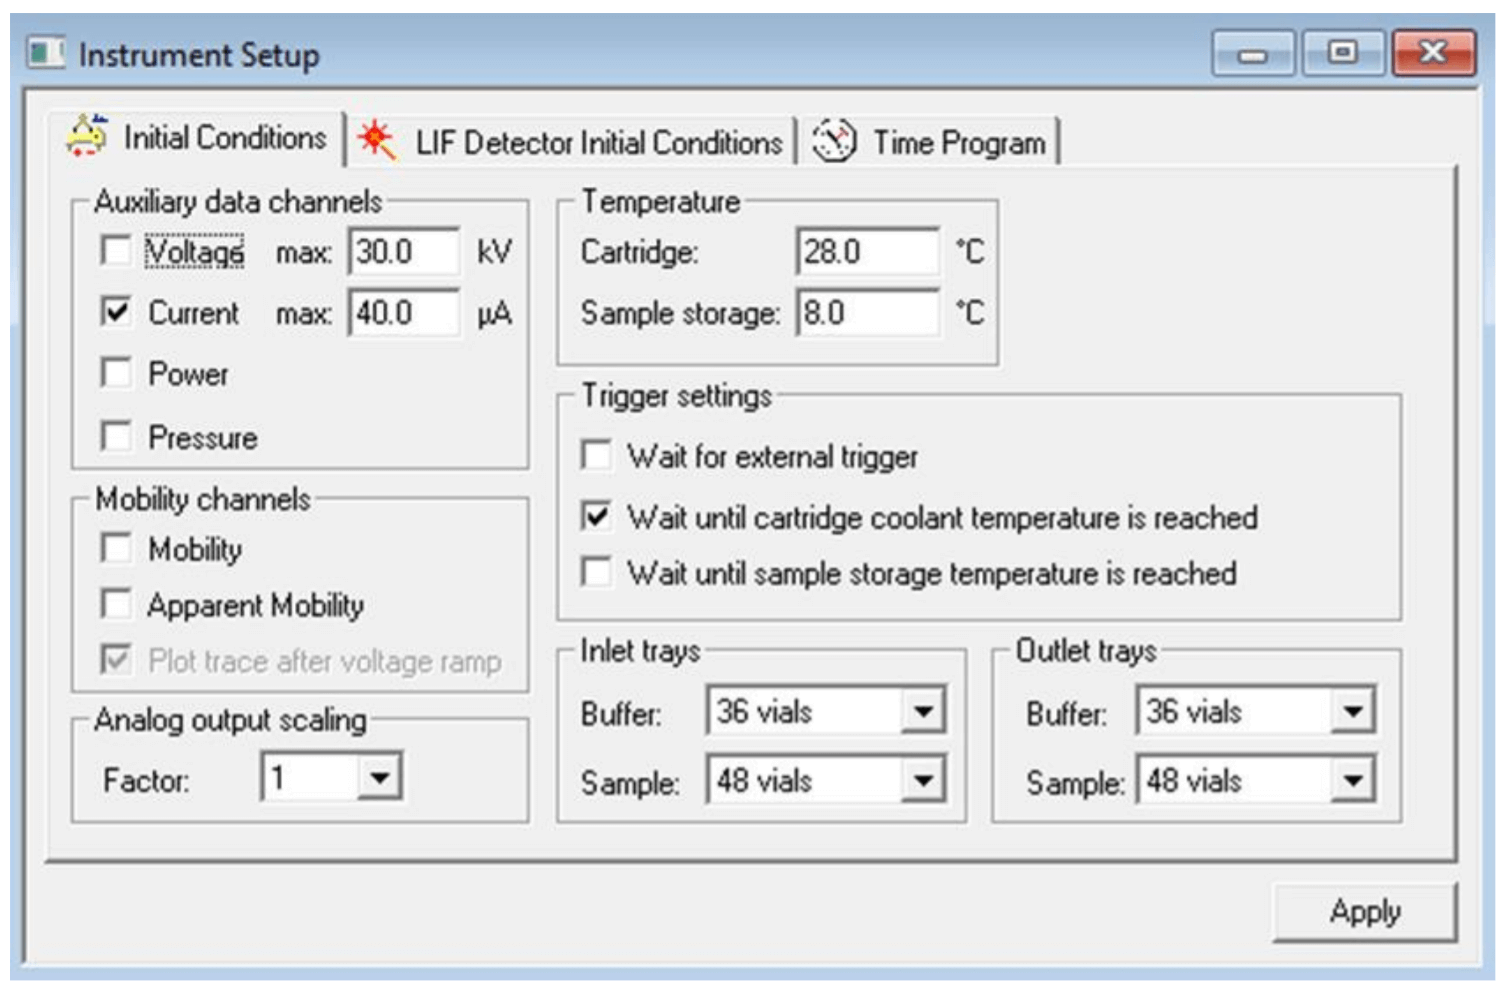
Figure 5. Settings for “LIF Detector Initial Conditions” tab for all RNA analysis.
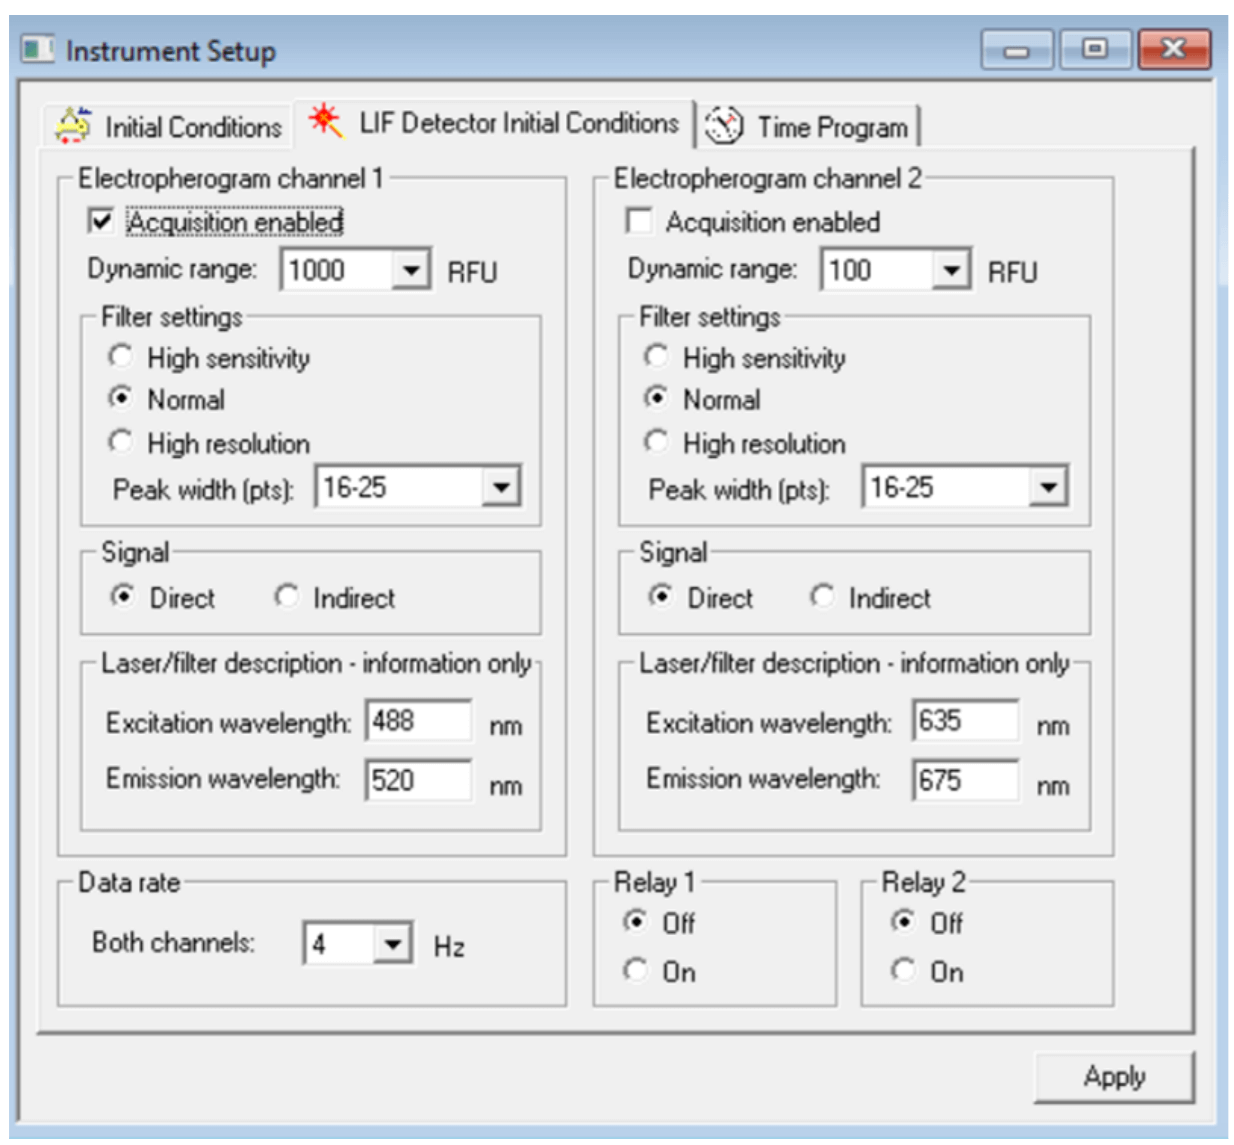
Figure 6. Time Program Settings for the Conditioning Method. Settings shown are for analysis of sgRNA and pd(A) 40-60. Same conditions were used for Cas9 mRNA analysis except that vial positions were adjusted to row 4.
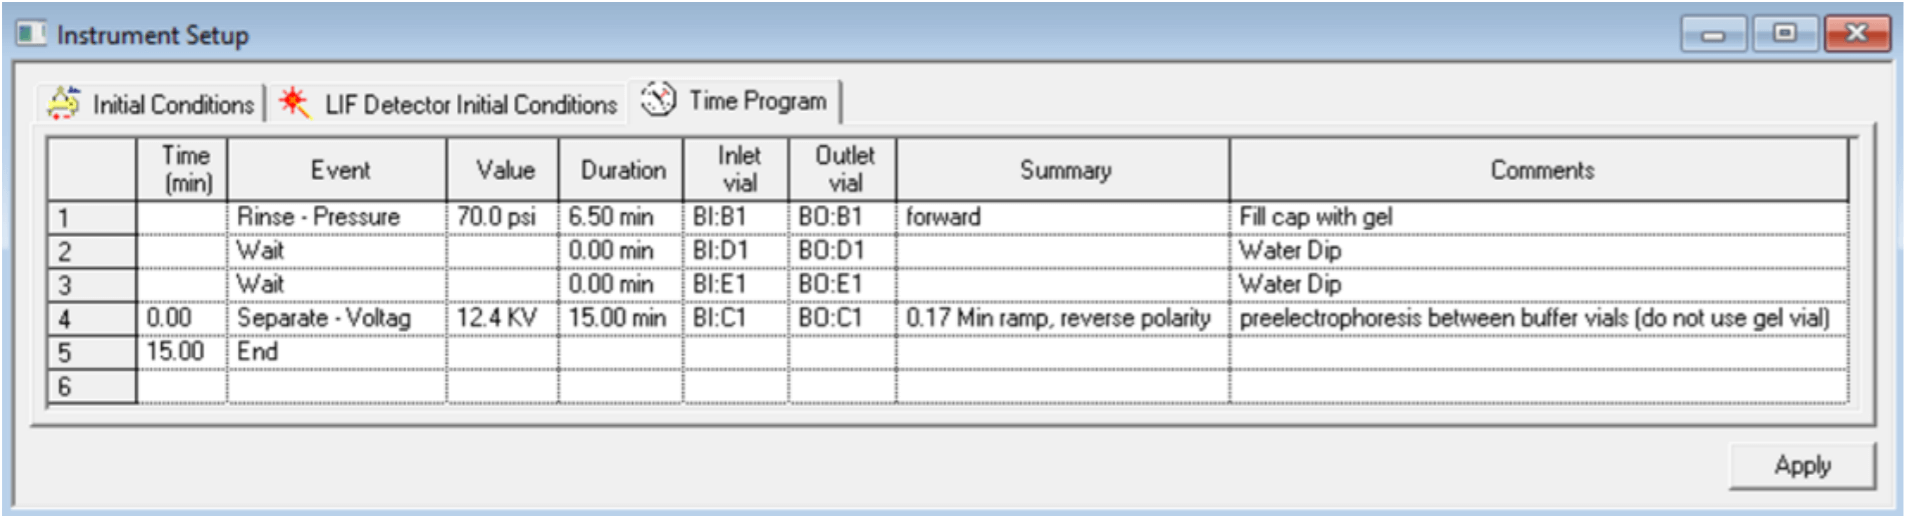
Figure 7. Time Program Settings for the Separation Method of sgRNA. The separation voltage was changed to 12.5 kv for analysis of pd(A) 40-60 test mix or smaller sized RNA at 30 to 70 nt length.
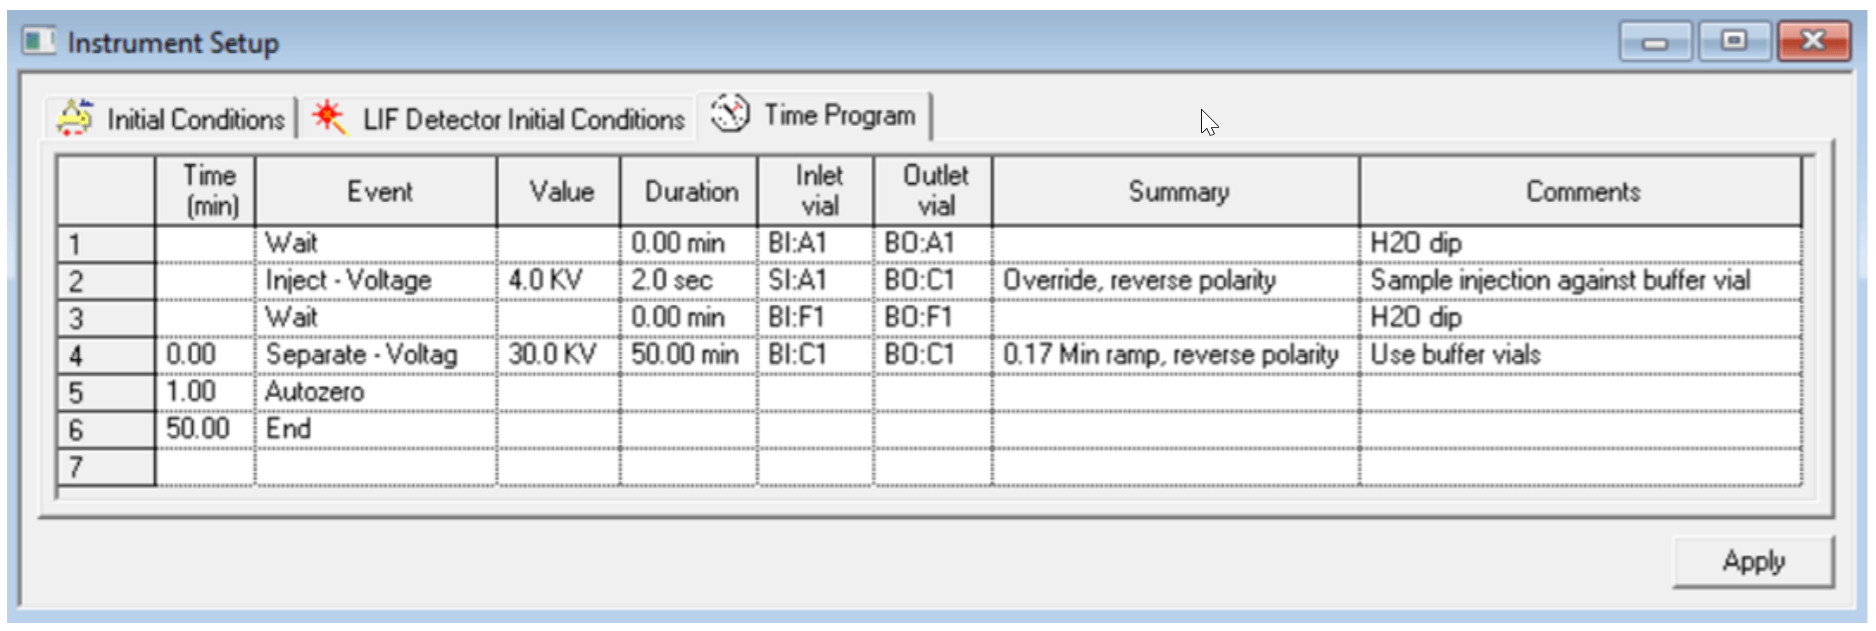
Figure 8. Time Program Settings for the Shut Down Method for analysis of sgRNA or smaller RNA. The vial positions were changed to row 4 for analysis of Cas 9 mRNA and large RNA.
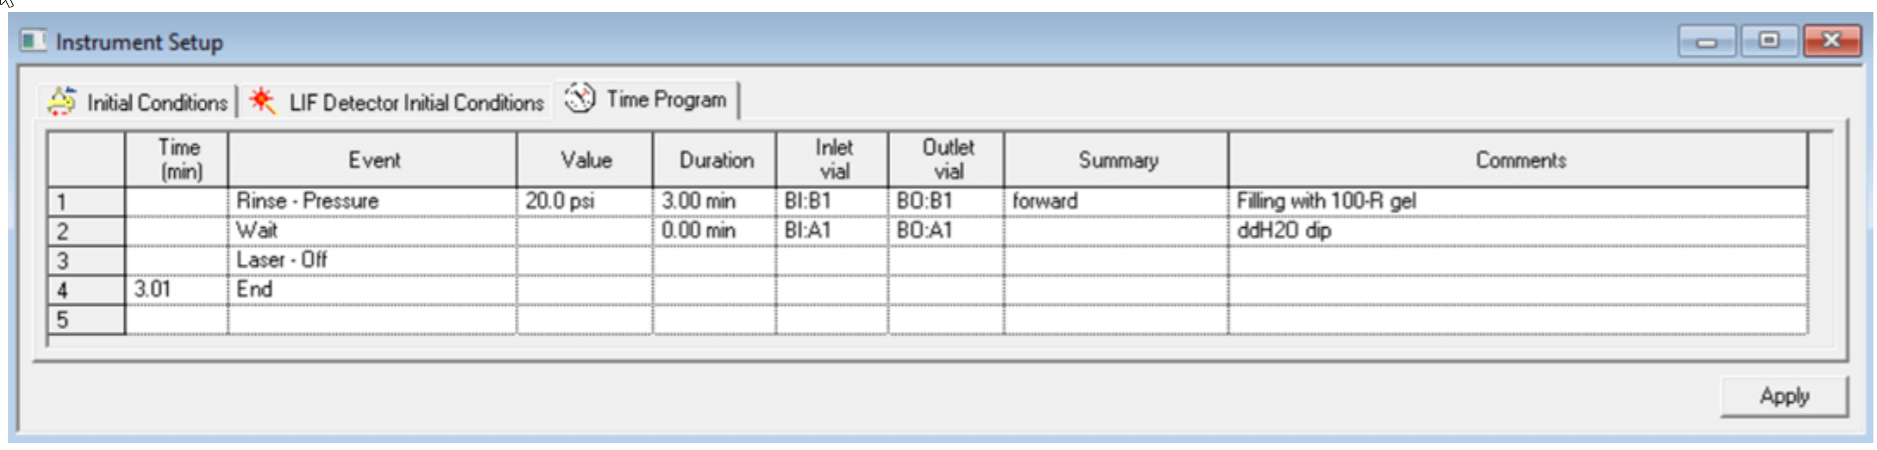
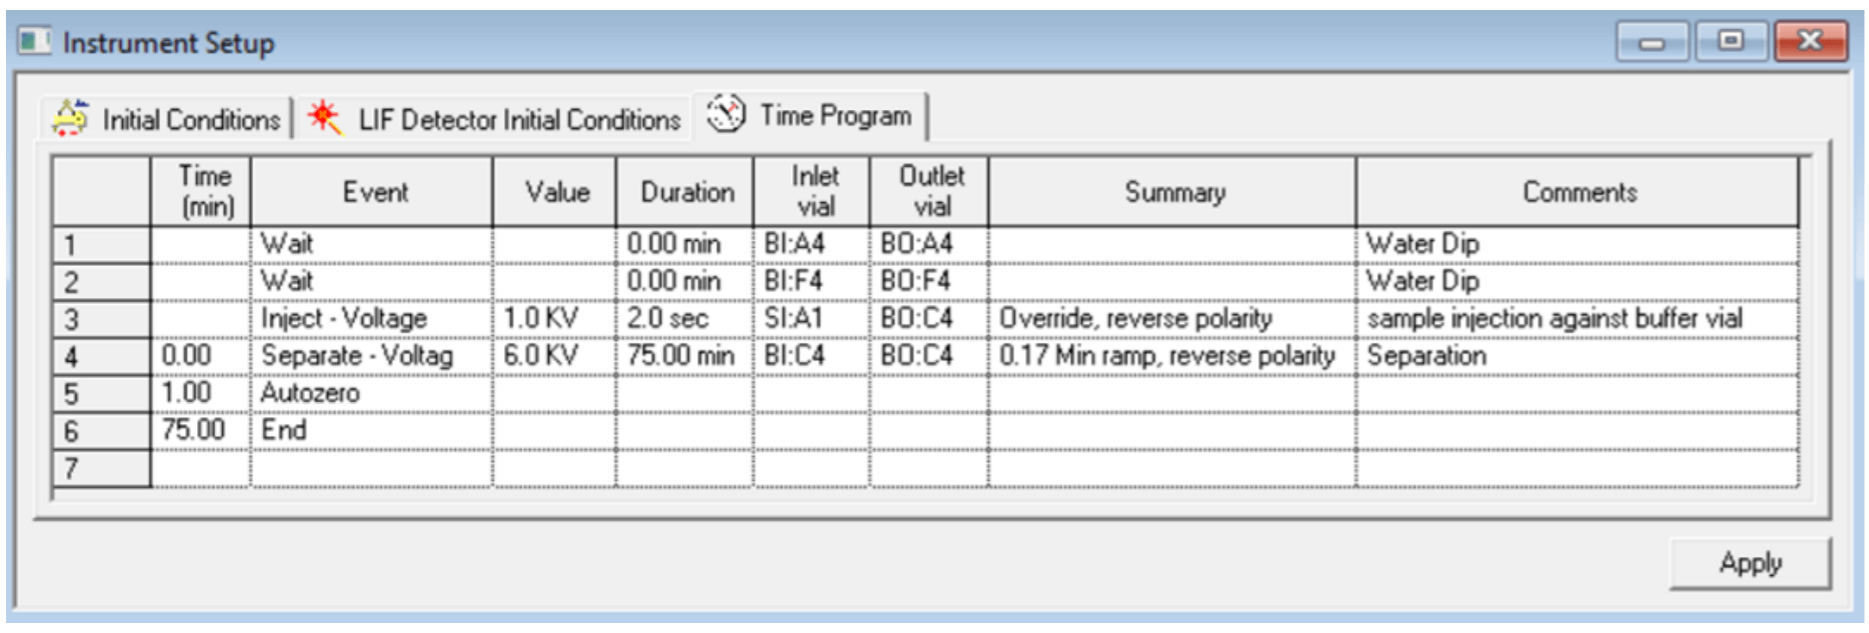
Figure 9. Time Program Settings for the Separation Method of Cas9 mRNA or large RNA.
Results and Discussions
Analysis of sgRNA: In CRISPR-Cas9 workflow, the guide RNA provides sequence-specificity and targets the Cas9 nuclease to the site of gene editing where the Cas9 nuclease performs double stranded DNA cleavage. The guide RNA occurs naturally as a two-molecule complex consisting of a target-specific crRNA (CRISPR RNA) bound to a tracrRNA (trans-activating crRNA) that directs the binding of RNAs to Cas9 nuclease. Recently, the use of sgRNA has become very popular in pharmaceutical industry. A sgRNA is a single RNA molecule designed to contain the sequences of both crRNA and tracrRNA. The diagram on top of Figure 2A shows the sequence and secondary structure of the sgRNA molecule used in this study. It was designed and synthesized by IDT with a brand name of Alt-R CRISPR-Cas9 sgRNA.2 The target gene is human HPRT gene (Hypoxanthineguanine phosphoribosyl-transferase). Nucleotides shown in bold white are 2’OMe bases; the asterisks indicate phosphorothioate linkages. Chemical modifications on Alt-R CRISPR-Cas9 sgRNAs increase their stability, potency, and resistance against nuclease activity. After synthesis, this sgRNA was desalted and dried without further purification. Figure 2A shows the results obtained with this sgRNA using ssDNA 100-R gel and TrisBorate-7M Urea buffer containing SYBR Green II dye. The HPRT sgRNA was diluted with nuclease free water to 25 ng/µl and analyzed by CE-LIF. It was detected as a main peak around 36 minutes when electrophoresed at 30kv for 50 minutes. As expected for desalted oligonucleotides, many small peaks representing the oligonucleotide species that failed one or multiple coupling cycles during oligonucleotide synthesis were detected on the left side of the main peak, from 16 to 35.8 minutes. Some areas in this region were displayed in insets as zoomed-in images to show how these small peaks look like. After calculating the corrected peak area for all impurity peaks and the main peak, the purity of this sgRNA was determined as 45.07%. This data indicates that this sgRNA has the typical purity level expected for a longer oligonucleotide. 3
Analysis of pd(A) 40 to 60 Test Mix: Although the main purpose of this technical note is to analyze sgRNA and Cas9 mRNA, some CRISPR customers may use naturally occurring crRNA and tracrRNA with sizes around 30 to 60 nt. Therefore, the feasibility of using the eCAP ssDNA 100-R kit for the analysis of crRNA and tracrRNA was tested by running pd(A) 40 to 60 Test Mix. As shown in Figure 10, all expected 21 peaks with sizes from 40 nt to 60 nt were detected. In addition, n-1 peaks with sizes smaller than 40 nt were detected too. Single base resolution was achieved from 15 nt to 60 nt. The high resolving power of the 100-R gel can also show the appearance of shoulders on major peaks such as on the 23nt and 24 nt peaks. These shoulders maybe the dephosphorylated form of each oligonucleotide or other impurities.
Detection of RNA degradation in Cas9 mRNA: Since the Cas9 mRNA is used to express the Cas9 nuclease, it is critical to test its purity and integrity before it is co-delivered with sgRNA to targeted cells. A Cas9 mRNA used in this study expresses a version of the Streptococcus pyogenes SF370 Cas9 protein. It contains a naturally occurring Cap 1 structure, polyadenylated and with a modified uridine to mimic a fully processed mature mRNA. Results in Figure 2B and Figure 11 indicated that
Figure 10: Analysis of pd(A) 40 to 60 Test Mix with 100-R gel using CE-LIF. The 21 expected single stranded DNA oligonucleotides with sizes from 40 nt to 60 nt were detected. In addition, the n-1 peaks with sizes smaller than 40 nt were also detected.
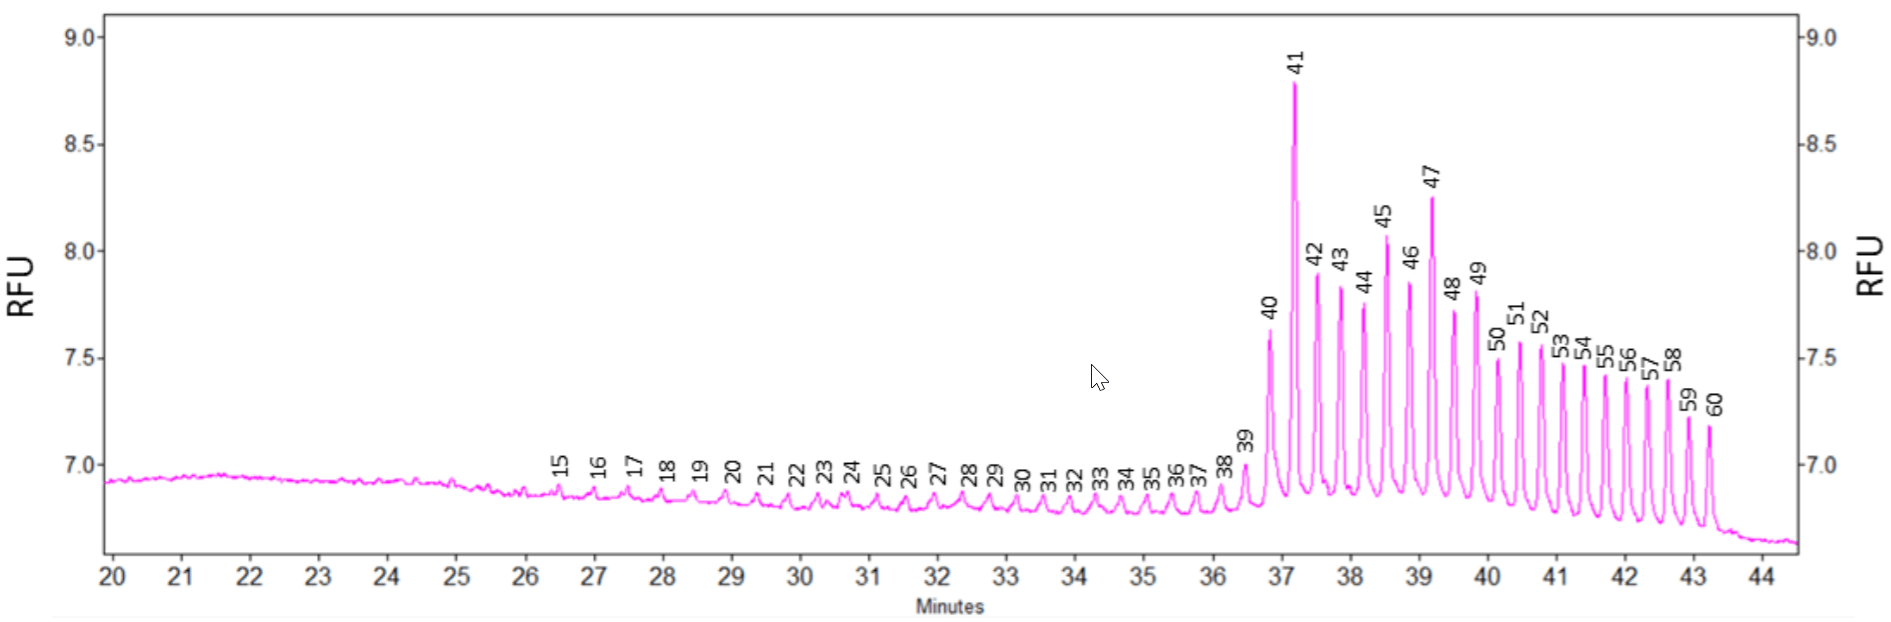
Figure 11. Detection of degradation in Cas9 mRNA sample. Cas9 mRNA sample (10 ng/µl) was separated in 100-R gel diluted 2.8 fold using the Tris-Borate-7 M Urea buffer. The green arrow indicates the intact Cas9 mRNA which is 4.5 kb. RNA degradation was detected as indicated by the green asterisks. Based on the overlay of the Cas9 mRNA trace (red) and the trace obtained with RNA markers (blue), significant RNA degradation species have sizes around 3 kb, 2.5 kb, 2 kb and 1.5 kb (green asterisks).
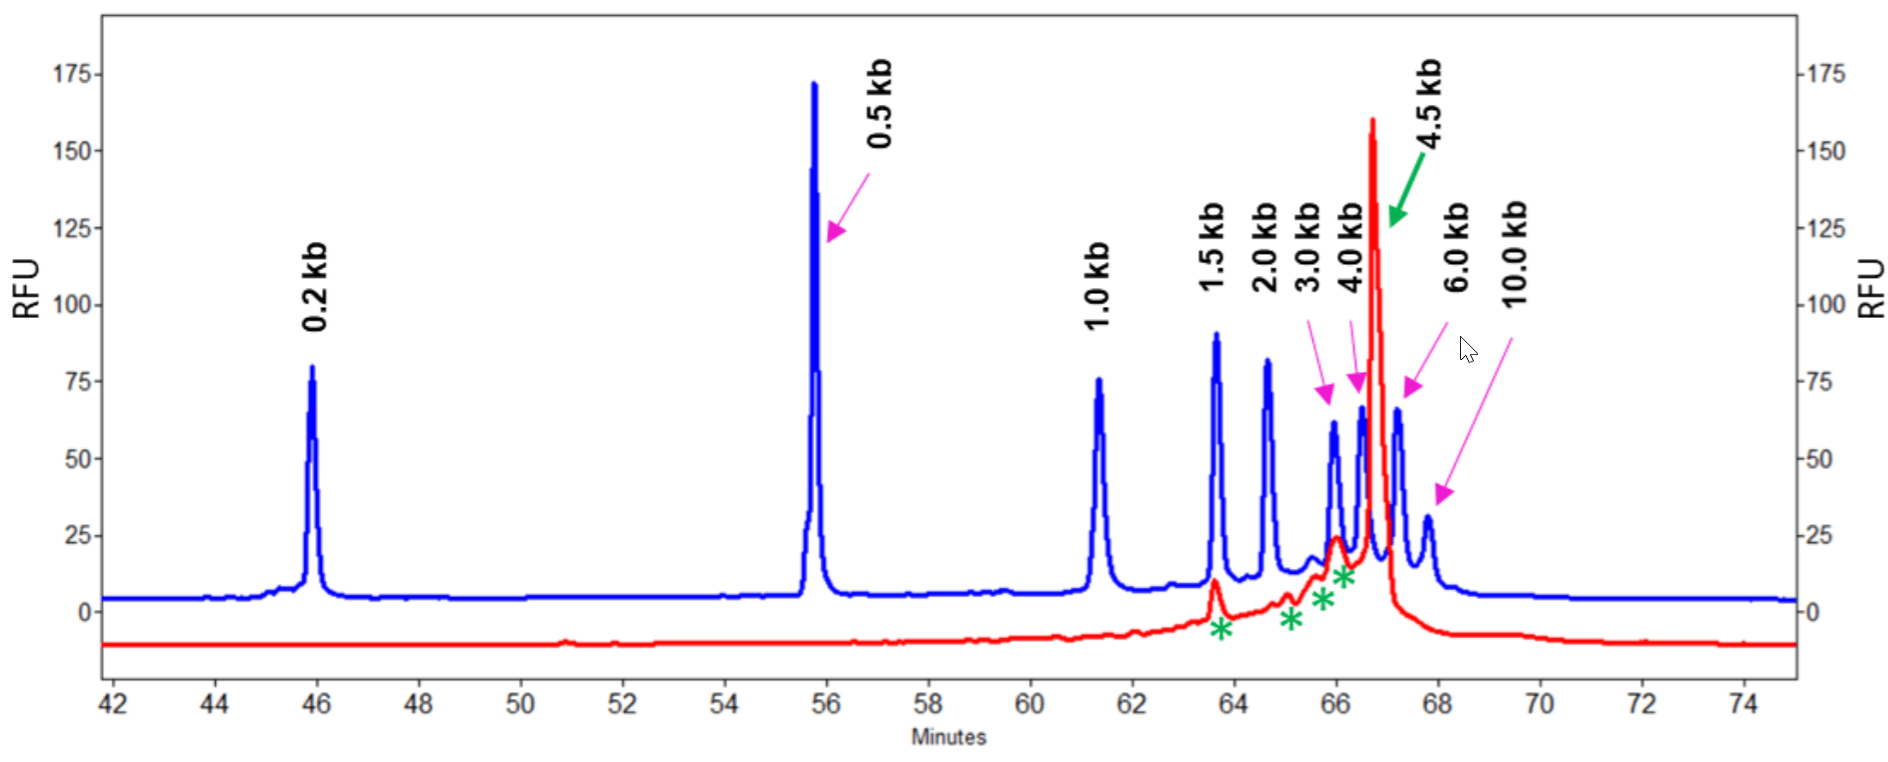
Cas9 mRNA was detected as a main peak around 66.7 minutes with an estimated size of 4.5 kb, consistent with the size provided by the manufacturer. RNA degradation was observed in this Cas9 mRNA sample. Corrected peak area percent (%CPA) for the main peak is 58.08%. Through comparison of electropherograms obtained with Cas9 mRNA and with the Transcript RNA markers, it was estimated that the main degradation species have sizes as 3 kb, 2.5 kb, 2 kb and 1.5 kb with %CPA of 16.83%, 3.70%, 4.65% and 7.22% respectively. Impact of this degradation will be investigated in a separate study. In addition, the raised baseline indicates that additional degradation species with gradually decreasing sizes were also present. Since the fragments in the Transcript RNA markers have different sequences than the Cas9 mRNA, the size estimation for the RNA degradation species based on RNA markers can be slightly different from their true theoretical sizes. In addition, since mRNA is single stranded, the impact of sequence composition on size estimation is more significant than with double stranded DNA size analysis. However, the estimated size values for the degradation species can be valuable in understanding Cas9 mRNA sample degradation.
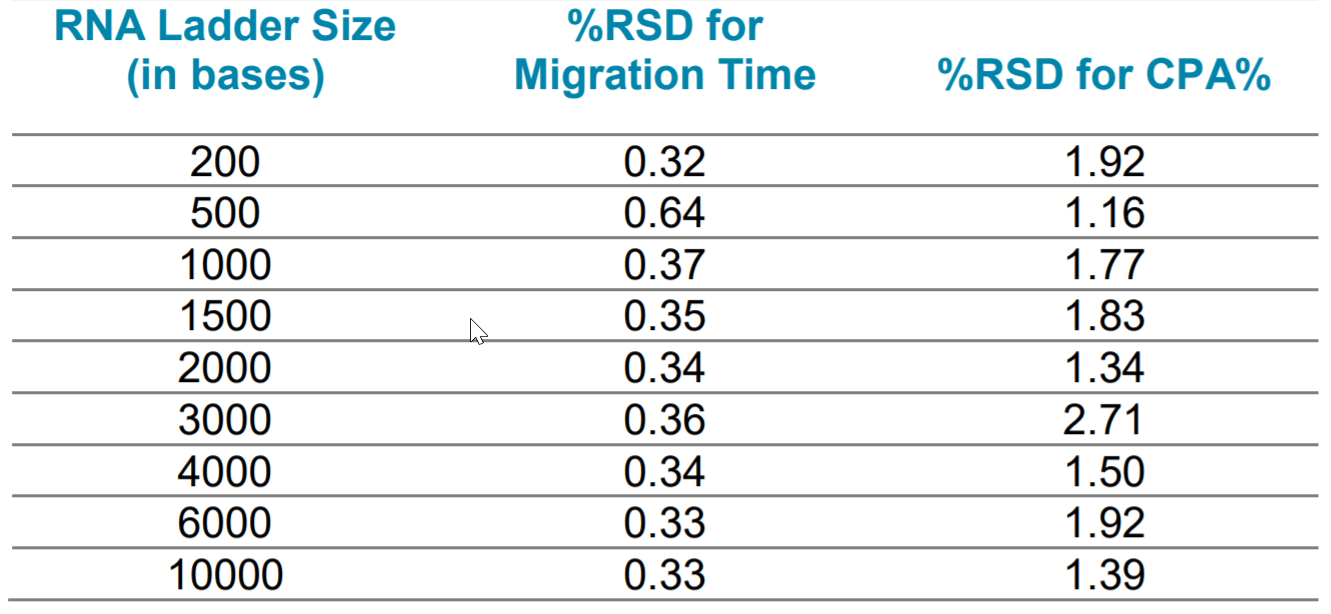
Method Repeatability: The Transcript RNA markers with sizes ranging from 0.2 kb to 10 kb was injected 6 times to test the method repeatability using the diluted 100-R gel. As shown in Table 1 and Figure 12, excellent repeatability was obtained. The relative standard deviation percent (%RSD) for migration time was lower than 0.7% for all fragments. The %RSD for corrected peak area percentage was lower than 2.8% for all fragments.
Figure 12. Overlay of six consecutive runs of Sigma Transcript RNA markers with sizes from 0.2 kb to 10 kb with diluted 100-R gel.
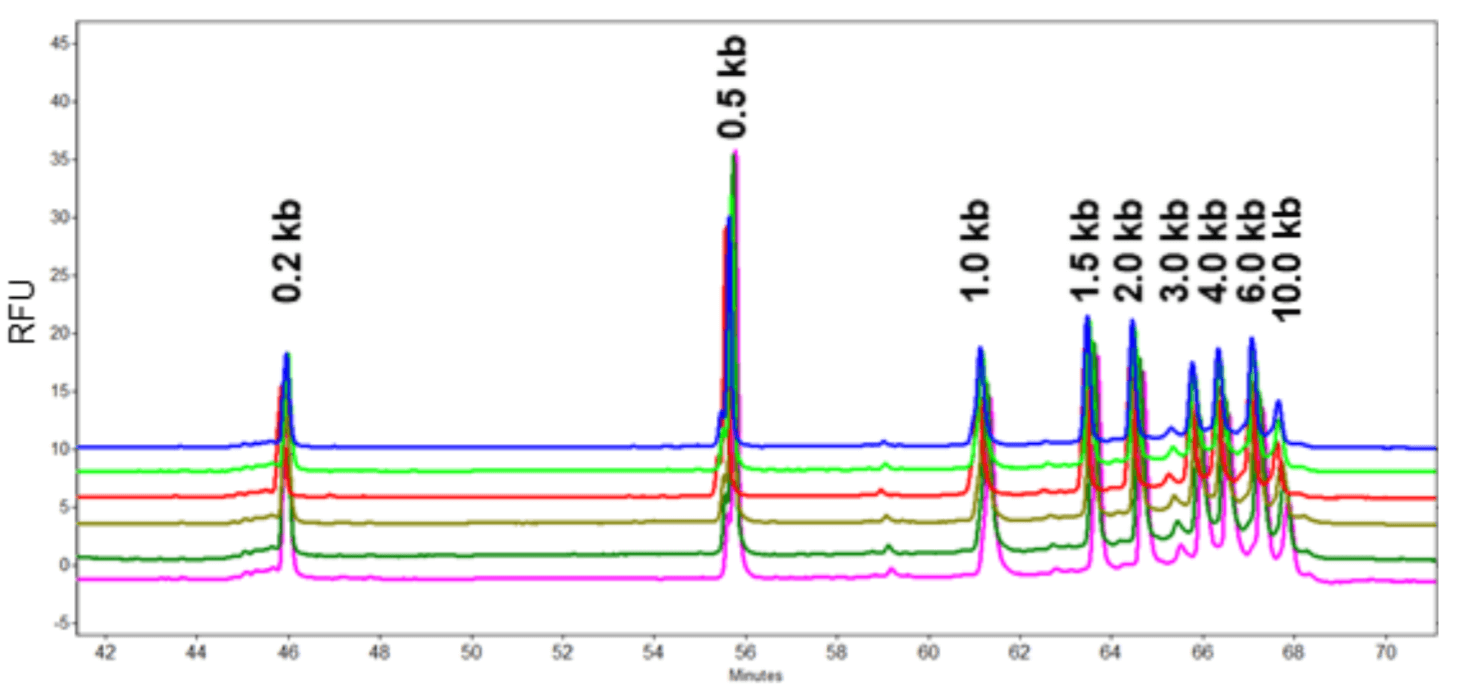
Table 1. The %RSD of migration time and corrected peak area percentage (CPA%) for each of the 9 RNA fragments in RNA ladder was analyzed in the repeatability study.
Conclusion
- Analysis of both sgRNA and Cas9 mRNA using the same 100-R gel at different concentrations provides convenience to users who need to analyze both of them on a routine basis
- The eCAP ssDNA 100-R kit supplies pre-formulated gels to save time for users
- Single base resolution down to 15 nt provides confidence in analyzing n-1 species in short oligos such as crRNA and tracrRNA
- Capability of estimating impurity size provides clues for understanding RNA degradation in Cas9 mRNA
- Excellent method repeatability ensures reliable results
References
- Three ways CRISPR will change the drug world. (2019) Pharmaceutical industry finding novel uses for gene editing tools. https://www.optum.com/resources/library/crispr.html.
- Alt-R CRISPR-Cas9 sgRNAs. Chemically synthesized and modified single guide RNAs for outstanding CRISPR performance and quality. IDT product information brochure. CRS-10142-FL 07/19.
- Capillary electrophoresis of oligonucleotides. (2011) Integrated DNA Technologies (IDT).
Acknowledgments
We thank Mukesh Malik, Peter Holper and Zuzana Demianova for helpful discussions.