Abstract
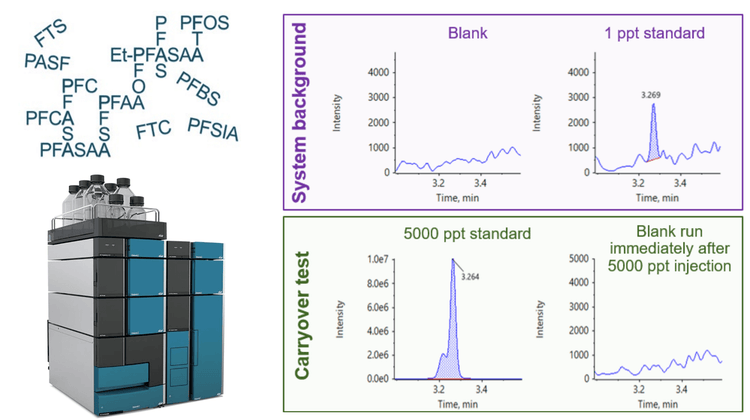
In this technical note, the combined use of the ExionLC AE system and the ExionLC AE PFAS kit demonstrated negligible system background and low system carryover, which enabled sensitive and precise quantitation of per- and polyfluoroalkyl substances (PFAS) (Figure 1). Having an HPLC system that contains minimal PFAS contamination is crucial for ensuring the accuracy and reliability of analytical results.1 PFAS, known for their persistence and environmental concerns, can contaminate HPLC equipment, leading to inaccurate data and potential misinterpretation of results.1 An HPLC system with limited PFAS contamination and low background levels helps prevent inaccurate results, aids detecion and ensures compliance with increasingly stringent regulations related to PFAS use.
Key benefits of PFAS analysis using the ExionLC AE system paired with the SCIEX 7500 system
- Low system carryover: Limit carryover using the ExionLC AE system to <1/3 of the calculated maximum residue limit (MRL) for PFAS testing
- Negligible system background: Attain background blank samples consistently <1/3 of the lowest concentration standard (1 ppt)
- Repeatability across injections: Obtain consistent results across 55 injections with an average %CV value of 3.1% across all compounds tested
Introduction
PFAS are synthetic compounds engineered for resistance against grease, oil, water and heat. With these properties, PFAS are extensively utilized in numerous consumer and industrial products, including water- and stain-resistant textiles, carpets, cleaning agents, paints and firefighting foams. Additionally, PFAS compounds are commonly found in laboratory materials and equipment, adding complexity to analytical procedures. The widespread use of PFAS in diverse products and their environmental persistence contribute to their presence in laboratories. Addressing this issue requires careful consideration to ensure the precision and reliability of analytical results across repeated injections with limited carryover.
Methods
Samples and reagents: Isotopically labelled and neat standards were purchased from Wellington Laboratories.
Sample preparation: Standards were prepared to cover the calibration range of 1–5000 ppt in 80:20, methanol/water.
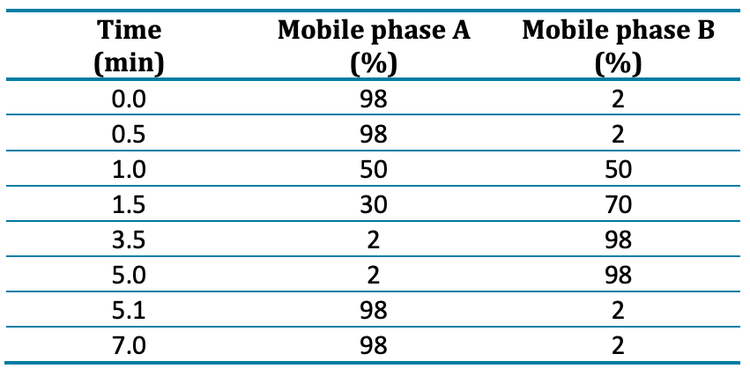
Chromatography: Sample separation was achieved using the ExionLC AE system and a Phenomenex Luna™ Omega PS C18 (3 µm, 100 x 2.1 mm, P/N: 00D-4758-AN) column. A Phenomenex Luna Omega PS C18 (5 µm, 50 x 3 mm, P/N: 00B-4753-Y0) column was installed after the mixer and utilized as a delay column to separate PFAS contamination in the mobile phases from the analytical peaks for each compound. A 7-minute gradient of water and methanol with 10mM ammonium acetate buffer was used with a flow rate of 0.8 mL/min, column temperature of 40°C and a 10 µL injection volume (Table 1). Methanol was used as a needle wash solvent.
All tubing was replaced with PEEK. The tubing between the solvent bottles and degasser and from the degasser to pump heads was replaced with PEEK tubing with 1/8” outer diameter (OD) and 0.08” internal diameter (ID). PEEK tubing with 1/16” OD and 0.03” ID was used in the autosampler.
Data processing: Data collection and analysis were performed in SCIEX OS software, version 3.3.1. Peaks were automatically integrated using the MQ4 algorithm and a weighting of 1/x was used for quantitation. Method detection limits were calculated using the following formula:
MDL = 𝑡(n−1, 1−∝=0.99) x Ss
where:
t=the Student’s t-value for 7 replicates (3.143)
Ss=standard deviation of 7 replicates spiked at 1 ppt
Carryover performance
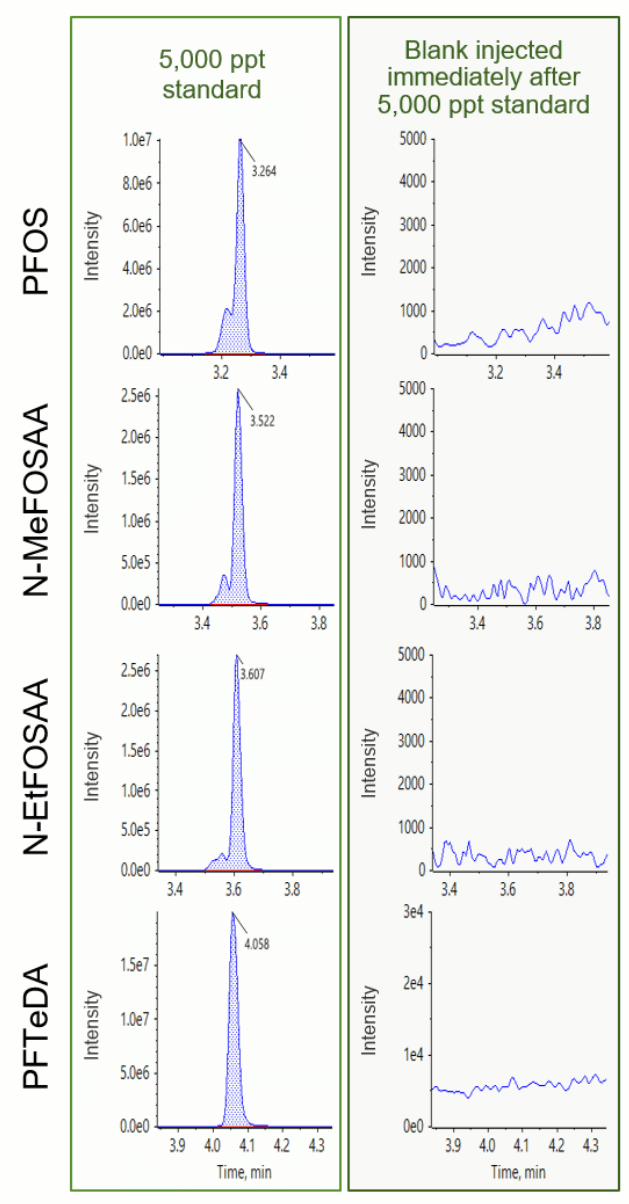
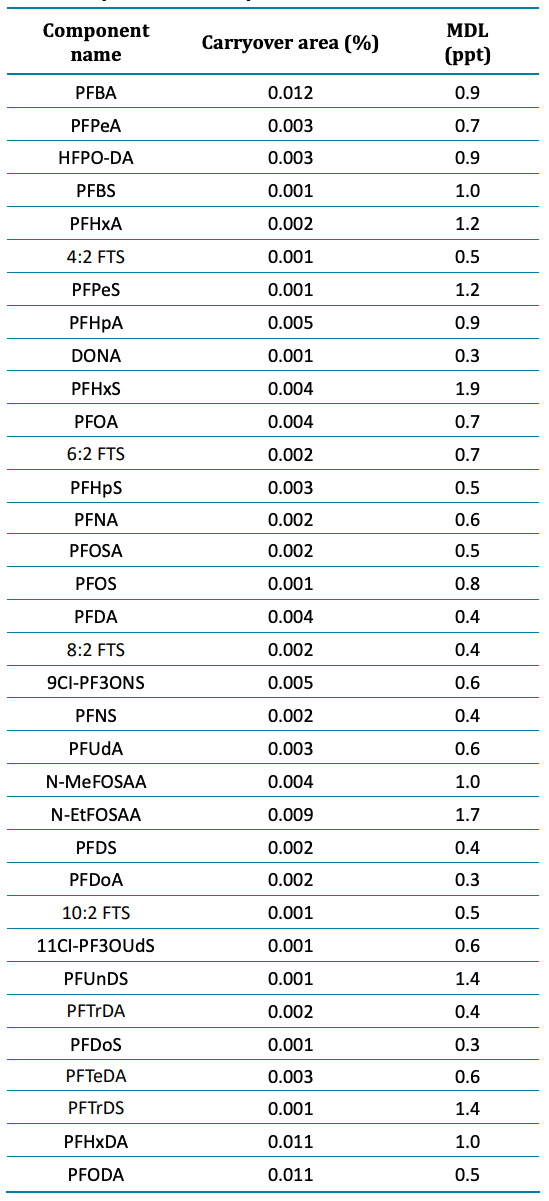
Blank samples exhibited minimal responses, falling below the required threshold of <1/3 of the method detection limit (MDL).2 Figure 2 shows representative carryover peaks for selected PFAS compounds. The blank injections shown were performed immediately following the injection of the highest calibration standard at 5000 ppt. The calculated concentrations of the first blank after the highest concentration sample (5000 ppt) were all <0.33 ppt and <1/3 of the MDL for all compounds, as shown in Table 3. Importantly, the area of all carryover peaks was <0.012% of the highest standard peak area (5000 ppt).
Low system background
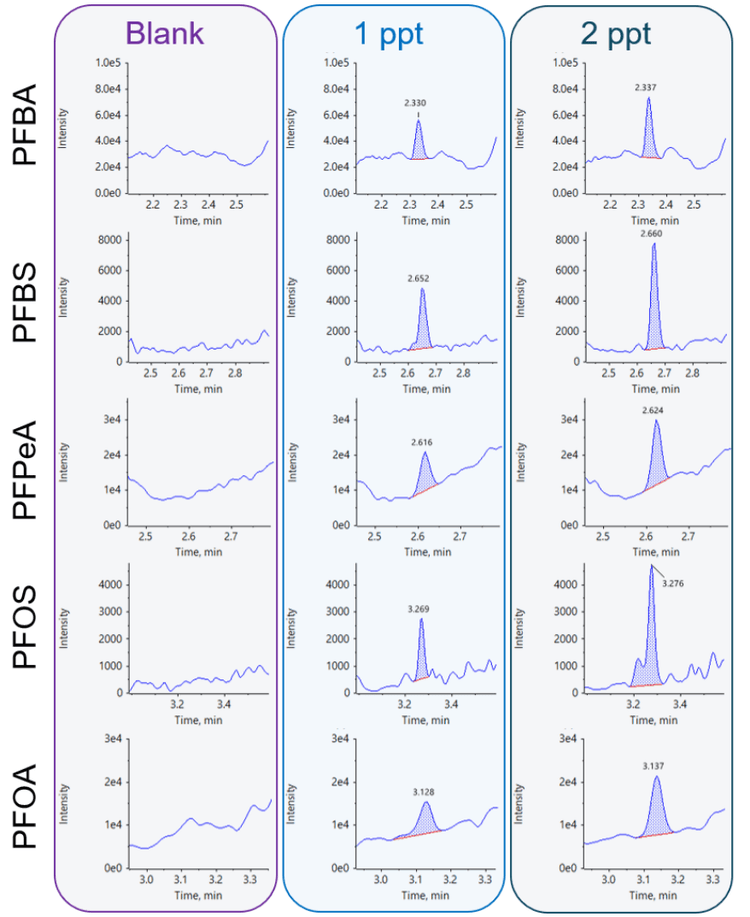
Regular maintenance and replacement of HPLC components with PFAS-free alternatives are crucial to mitigate the risk of contamination in the analytical process. To assess potential PFAS presence, background blank samples were run and compared to low concentration analytical standards. Most standards were spiked at 1 ppt, except for N-MeFOSAA and N-EtFOSAA, which were spiked at 2 ppt. The results indicated that for all analytes, background levels were <1/3 of the lowest concentration standard used in the curve,2 demonstrating the ability of the ExionLC AE system to reach the low-level concentrations required of regulated PFAS methods (Figure 3).
Injection reproducibility and stability
Ensuring the stability of retention time and response is crucial, particularly when employing narrow retention time windows during time-scheduled MRM acquisition. To assess the reproducibility, a quality control sample was injected 55 times over 6 hours. The retention time precision for each of the 34 analytes demonstrated a CV of <0.4%, with a mean CV of 0.25% for all compounds. For most tested compounds, the maximum retention time difference observed over 55 injections was <0.03 min.
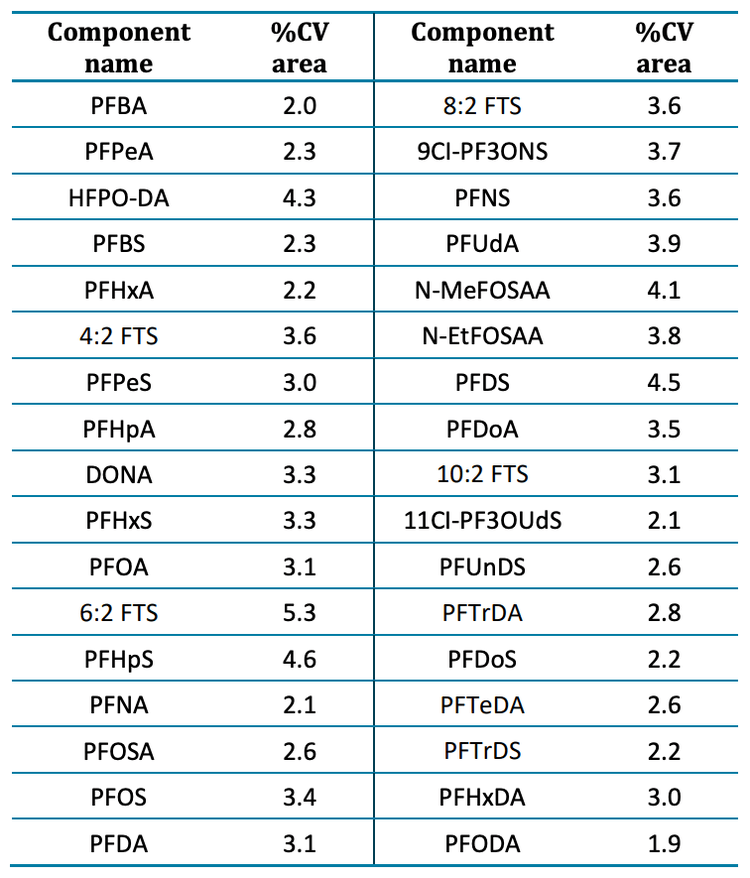
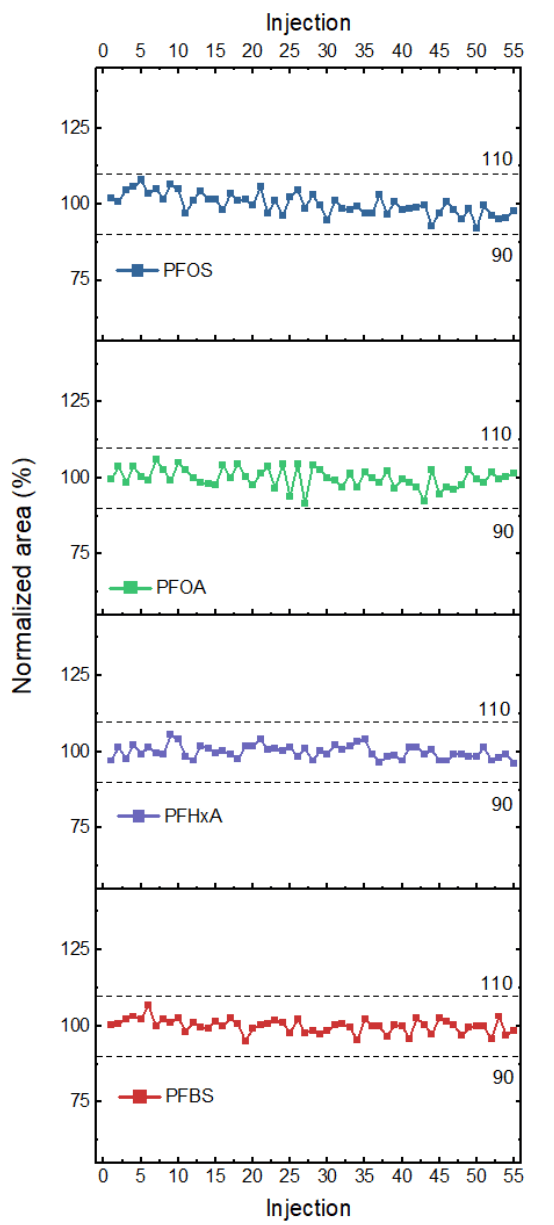
Additionally, the area of each analyte was tracked across all 55 injections (Figure 4). The area for all monitored analytes showed variation within ±10%. The average CV was 3.1% and 6:2 fluorotelomer sulfonate (6:2 FTS), a contaminant commonly observed in laboratory materials and equipment, exhibited the highest variability with a CV of 5.3% (Table 4). The CVs observed for all other compounds were <5%.
Conclusion
- Blank samples that were run after the highest calibration standard injection showed minimal carryover and were <0.012% of the highest standard peak area (5000 ppt)
- Background PFAS levels were <1/3 of the lowest concentration standard (1 ppt)
- Analyzing the area of each analyte over 55 injections revealed variation within ±10% across injections and an average CV of 3.1%
- Retention time precision for 34 analytes showed a CV of <0.1%, with a mean CV of 0.02%
- Pairing the ExionLC AE system with the SCIEX 7500 system led to instrumental lower limits of quantitation of 1 ppt for 34 commonly monitored PFAS compounds
References
- Bangma, J., Barry, K.M., Fisher, C.M., Genualdi, S., Guillete, T.C., Huset, C.A., McCord, J., Ng, B., Place, B.J., Reiner, J.L. and Robuck, A., (2024). PFAS ghosts: how to identify, evaluate, and exorcise new and existing analytical interference. Analytical and Bioanalytical Chemistry, pp. 1-9.
htps://doi.org/10.1007/s00216-024-05125-y - Shoemaker JA, Tetenhorst D. (2018) Method 537.1: determination of selected per-and polyfluorinated alkyl substances in drinking water by solid phase extraction and liquid chromatography/tandem mass spectrometry (LC/MS/MS). National Center for Environmental Assessment, Washington, DC.
htps://cfpub.epa.gov/si/si_public_record_Report.cfm?dirEntr yId=343042&Lab=NERL