A new level of accurate quantitation for 29 phthalate esters in food simulants using LC-MS/MS
Sujata Rajan1, Sashank Pillai1, Craig M. Butt2 and Jianru Stahl-Zeng3
1SCIEX, India; 2SCIEX, USA; 3SCIEX, Germany
Abstract
This technical note demonstrates a novel LC-MS/MS method that quantified 29 phthalate esters (phthalates, PEs) at ng/mL (ppb) detection limits in 4 food simulants, as described by the EU regulation on plastic food contact materials.1 Laboratory methods were improved to reduce background contamination, yielding limits of quantitation (LOQs) as low as 0.025 ng/mL for most PEs using the QTRAP 6500+ system. In addition, 9 PE isomers were chromatographically separated during the 20-minute gradient run using a reversed-phase LC column (Figure 1). The method was applied to a real-world juice sample and post-extraction spikes showed good accuracy and precision.
Introduction
PEs are diesters of 1,2-benzenedicarboxylic acid that are used to improve the flexibility, elasticity, and durability of some plastics. Since PEs are not covalently bound to plastic materials, they may leach out of products over time. PEs are suspected endocrine disruptors and carcinogens and can have reproductive and neurodevelopment effects.2,3 PEs leaching from plastic food contact materials (FCMs) can lead to food contamination and therefore might have implications for human health. In response to potential health concerns, global regulatory bodies have aimed to limit human exposure to PEs by establishing residue limits in food. Specifically, EU regulation 10/2011 has set specific migration limits (SML) in plastic FCMs for several PEs.1 In addition, the total specific migration limit (SMLT) is 60 mg/kg for the sum of 5 PEs, including DBP, BBP, DEHP, DINP, and DIDP.
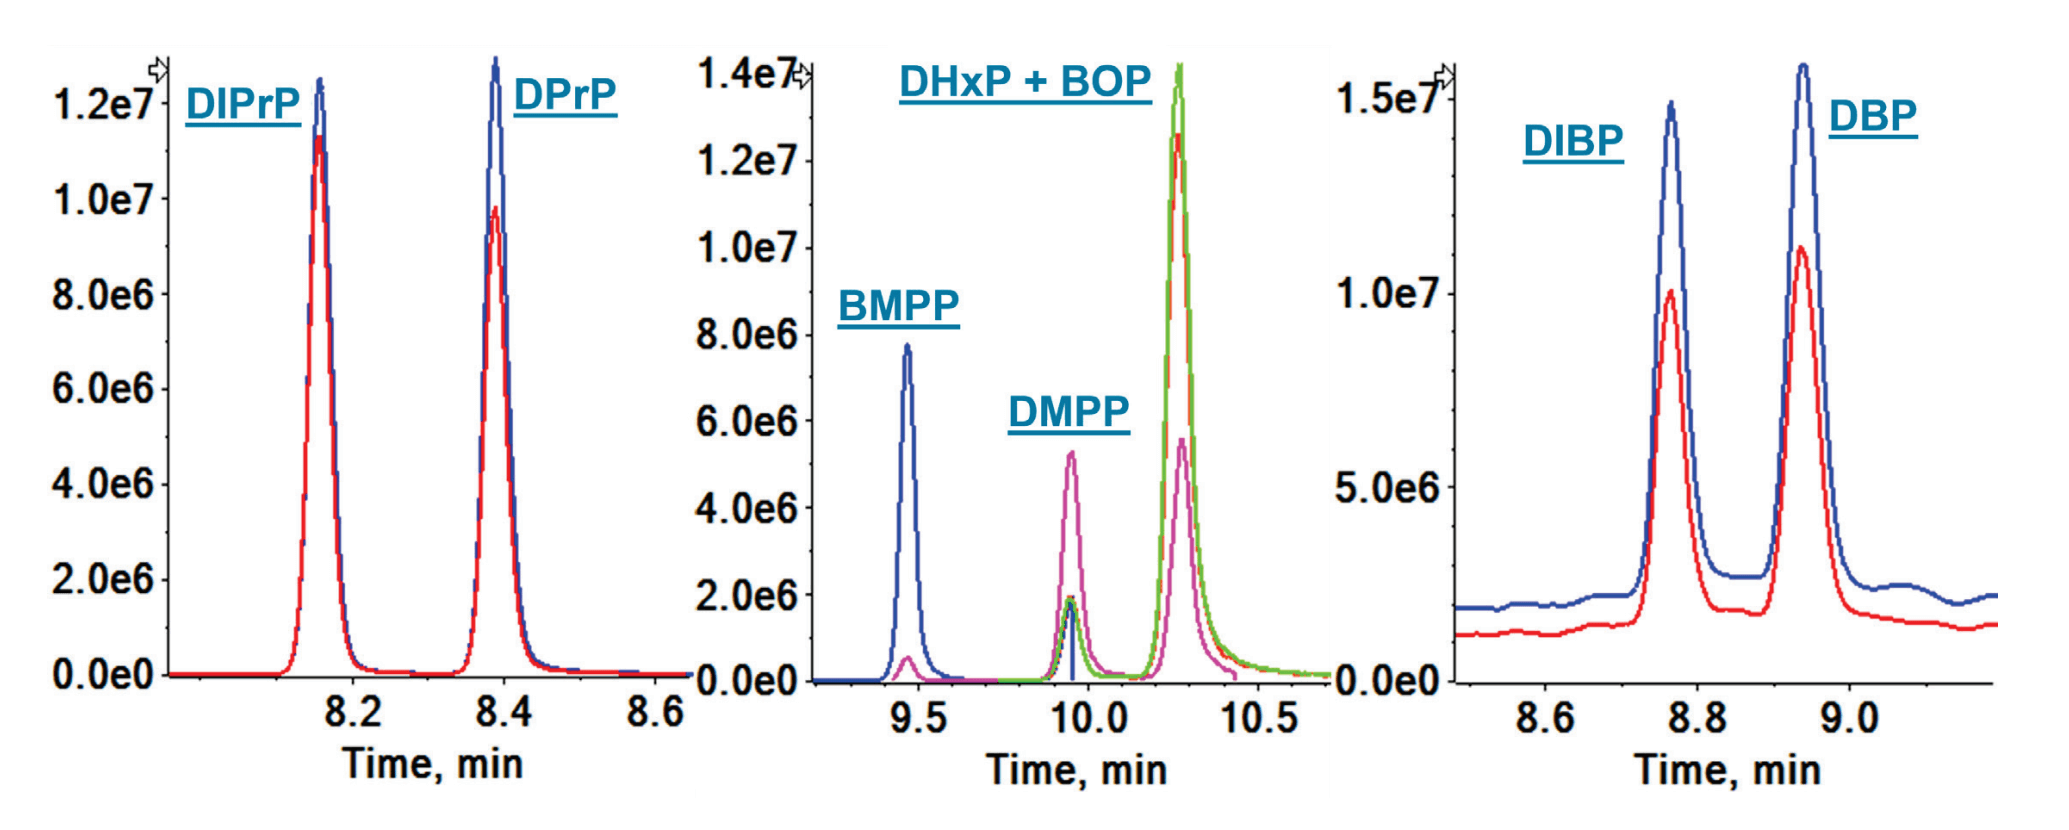
Figure 1. Extracted ion chromatograms (XIC) for the quantifier ion of separated isomers. DIPrP and DPrP are shown on the left, BMPP, DMPP, and DHxP/BOP are shown in the center and, DIBP and DBP are shown on the right.
Key benefits of the analysis of PEs using the QTRAP 6500+ system
- LOQs ranged from 0.025 ng/mL to 7.5 ng/mL for 29 PEs using the QTRAP 6500+ system
- A 20-min LC gradient separated 9 isomers using a reversed-phase column (Figure 1)
- The novel sample preparation procedure significantly reduced blank interference
- A solvent-based calibration curve was used to analyze 29 phthalates in 4 food simulants and a real-world juice sample
- Good accuracy (±20%) and precision (%CV <7%) were achieved for post-extraction spikes into a real-world juice sample at 1 ng/mL.
Methods
Standard preparation: Individual standard stock solutions were prepared by diluting 1 mg of the individual neat standards in 1 mL of methanol to yield a final concentration of 1 mg/mL (1000 ppm). Individual standard stocks were then combined to yield a final mixed standard stock of 5 µg/mL in methanol.
Calibration curve preparation: A series of intermediate calibration standards were prepared in methanol using the mixed 5 µg/mL stock. These intermediate standards were then used to prepare the final calibration standards in 50:50 (v/v), and ethanol/water (food simulant D1) at concentrations ranging from 0.025 to 25 ng/mL.
A matrix-matched calibration series was similarly prepared using 3% (v/v), acetic acid in water (food simulant B) to analyze DNP, DINP, and DPhP.3
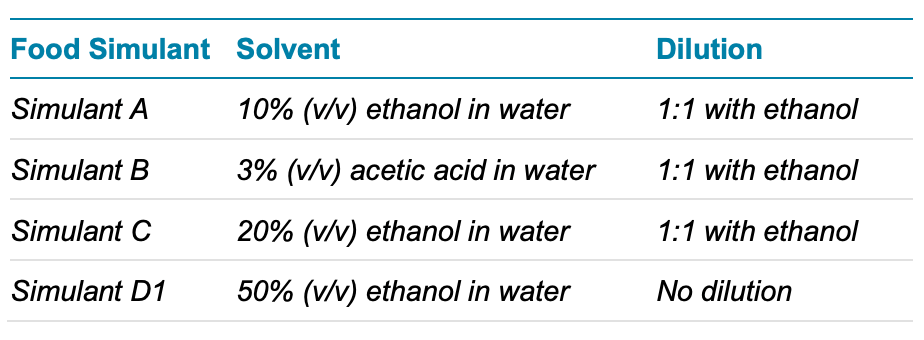
Food simulant spikes: Details for the individual food simulants, as defined by the EU regulations for plastic FCMs (EU 10/2011), are presented in Table 1. For food simulant D1, all compounds were spiked at 1, 2.5, 5, and 10 ng/mL and were analyzed without further dilution. In contrast, food simulants A, B, and C were spiked at 2, 5, 1,0 and 20 ng/mL and then diluted 1:1 with ethanol to improve the PE solubility, yielding final concentrations of 1, 2.5,, 5 and 10 ng/mL.
Juice sample extraction: A 1 g aliquot of a juice sample was weighed into a 50 mL glass centrifuge tube and 10 mL of acetonitrile was added. The solution was mixed thoroughly, vortexed for 1 minute, then centrifuged at 2500 rpm for 10 min. After centrifugation, the supernatant was transferred to a clean glass tube without disturbing the pellet. Finally, 500 μL of the supernatant was transferred into autosampler vials for sample analysis.
Table 1. Food simulant compositions and dilutions based on the commission regulation EU (10/2011).
Juice sample post-extraction spikes: Samples were extracted following the protocol described above. After centrifugation, the extract was spiked with the PE intermediate standard mix to yield final concentrations of 1, 2.5, 5, and 10 ng/mL. The samples were vortexed and transferred into autosampler vials for analysis.
Chromatography: An ExionLC AD system was used with an Agela Ghost Hunter delay column (Phenomenex, 50 x 4.6 mm) to retain the DBP and DIBP PEs originating from the mobile phase. The analytical column was a Phenomenex Kinetex Biphenyl column (2.6 µm, 100 Å, 100 x 3 mm). The total runtime was 20 min and the gradient conditions were developed to optimize the separation of PE isomers, if possible. Mobile phase A was 0.05% (v/v), acetic acid in water and mobile phase B was methanol. The flow rate was 0.425 mL/min, the injection volume was 3 µL and the column oven temperature was 25°C.
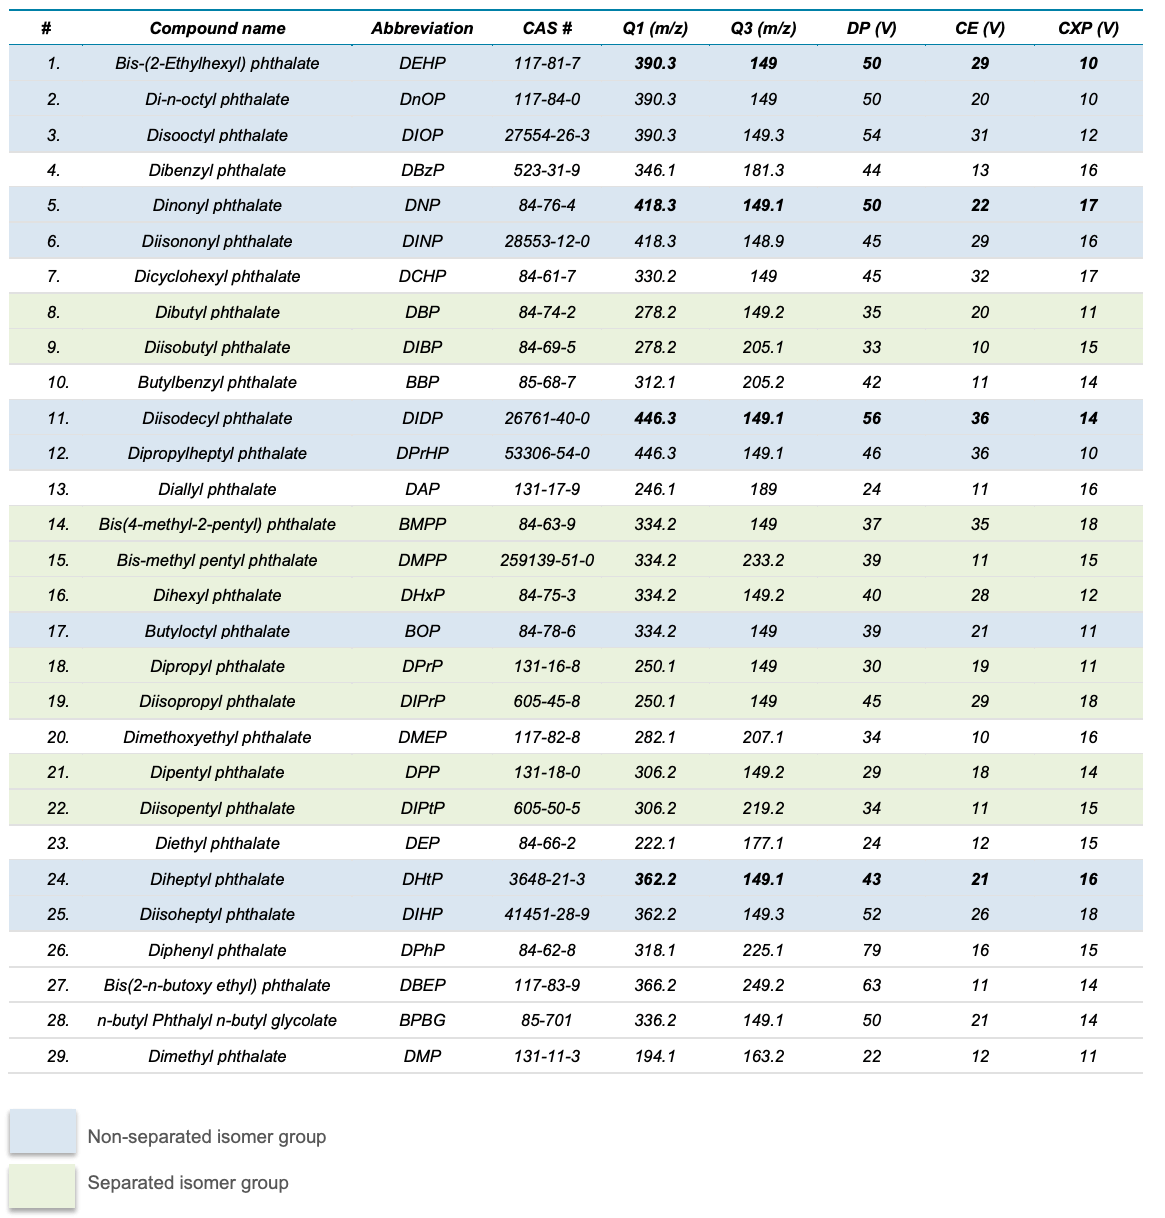
Mass spectrometry: The QTRAP 6500+ system was used with the IonDrive Turbo V ion source and electrospray ionization (ESI) in positive mode. The declustering potential (DP), collision energy (CE) and collision exit potential (CXP) values were each optimized for all 29 analytes. Data were acquired using the scheduled MRM algorithm (sMRM) and SCIEX OS software was used to optimize the cycle time, dwell time and detection window. The source, gas and compound-specific parameters used in the method are described in Tables 2 and 3.
Data processing: All data were processed using SCIEX OS software, version 2.1.6. Data from the isomer groups that were not chromatographically separated were processed in the Analytics module of SCIEX OS software using a single transition (bolded in Table 4) to collectively represent all the unseparated isomers. The resulting concentration was corrected with a multiplier based on the number of isomers that coeluted.
Table 2. Optimized source parameters for 29 PE compounds.
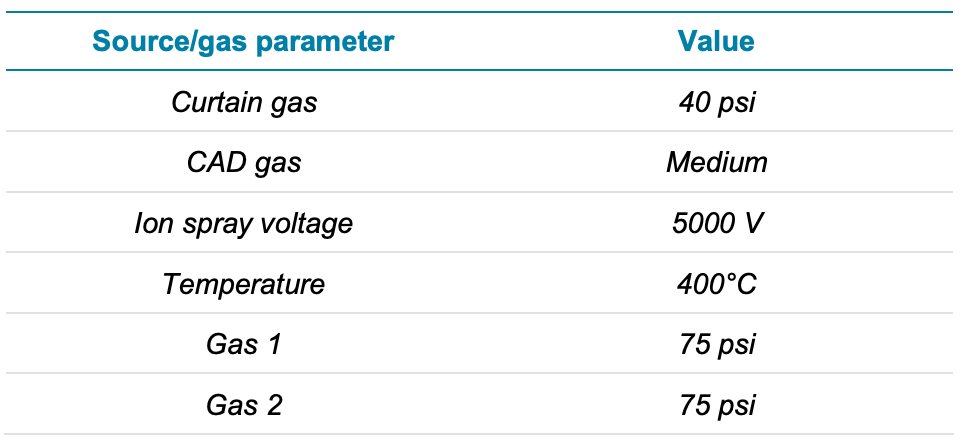
Table 3. Abbreviations, CAS number and compound-dependent parameters for the 29 PEs analyzed. Compounds shaded in blue belong to isomer groups that were not separated. Compounds shaded in green belong to isomer groups that successfully separated. DHxP and BOP were not chromatographically separated. Compounds in the non-separated isomer groups were quantified using the bolded transition in each group.
Chromatographic separation of PE isomers
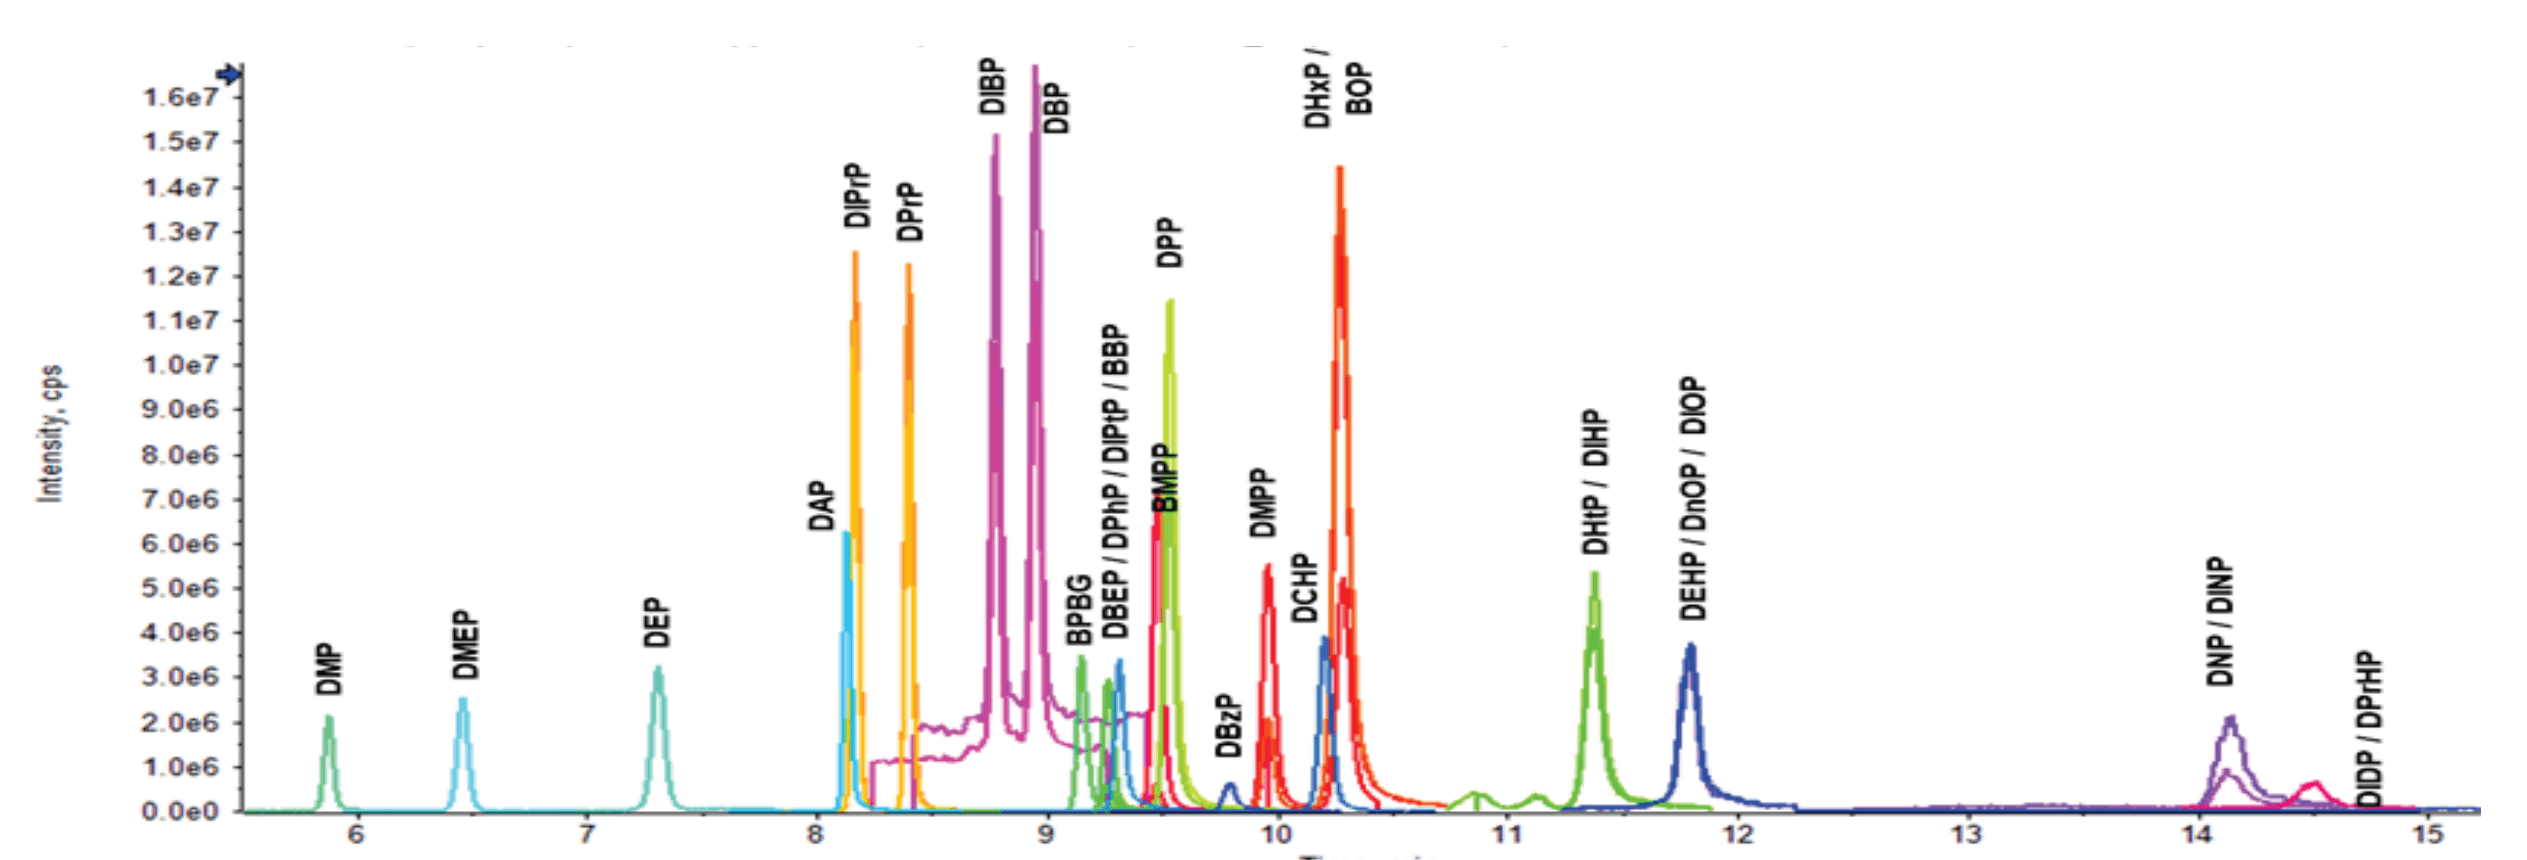
Nineteen of the 29 PE compounds analyzed comprised 8 isomer groups. The LC column and gradient conditions were optimized to chromatographically separate as many PE isomers as possible. Overall, good separation was obtained for the entire suite of 29 PEs during the 20-minute runtime (Figure 2). The method achieved the separation of 9 isomers in 4 isomer groups, including DBP and DIBP with precursor m/z 278; BMPP, DMPP and DHxP/BOP with precursor m/z 334 (DHxP and BOP could not be separated); DPrP and DIPrP with precursor m/z 250; and DPP and DIPtP with precursor m/z 306. The isomers that were not separated were reported as the summed concentrations of the individual PEs. While not mandated by EU regulations, isomer-specific chromatographic separation can help determine the source of PE contamination.
Figure 2. Overlaid XICs of the quantifier ions for 29 PEs. XICs are from the analysis of a 10 ng/mL standard injection. The x-axis has been zoomed for clarity
Sensitivity, accuracy and linear dynamic range of PEs in calibration standards
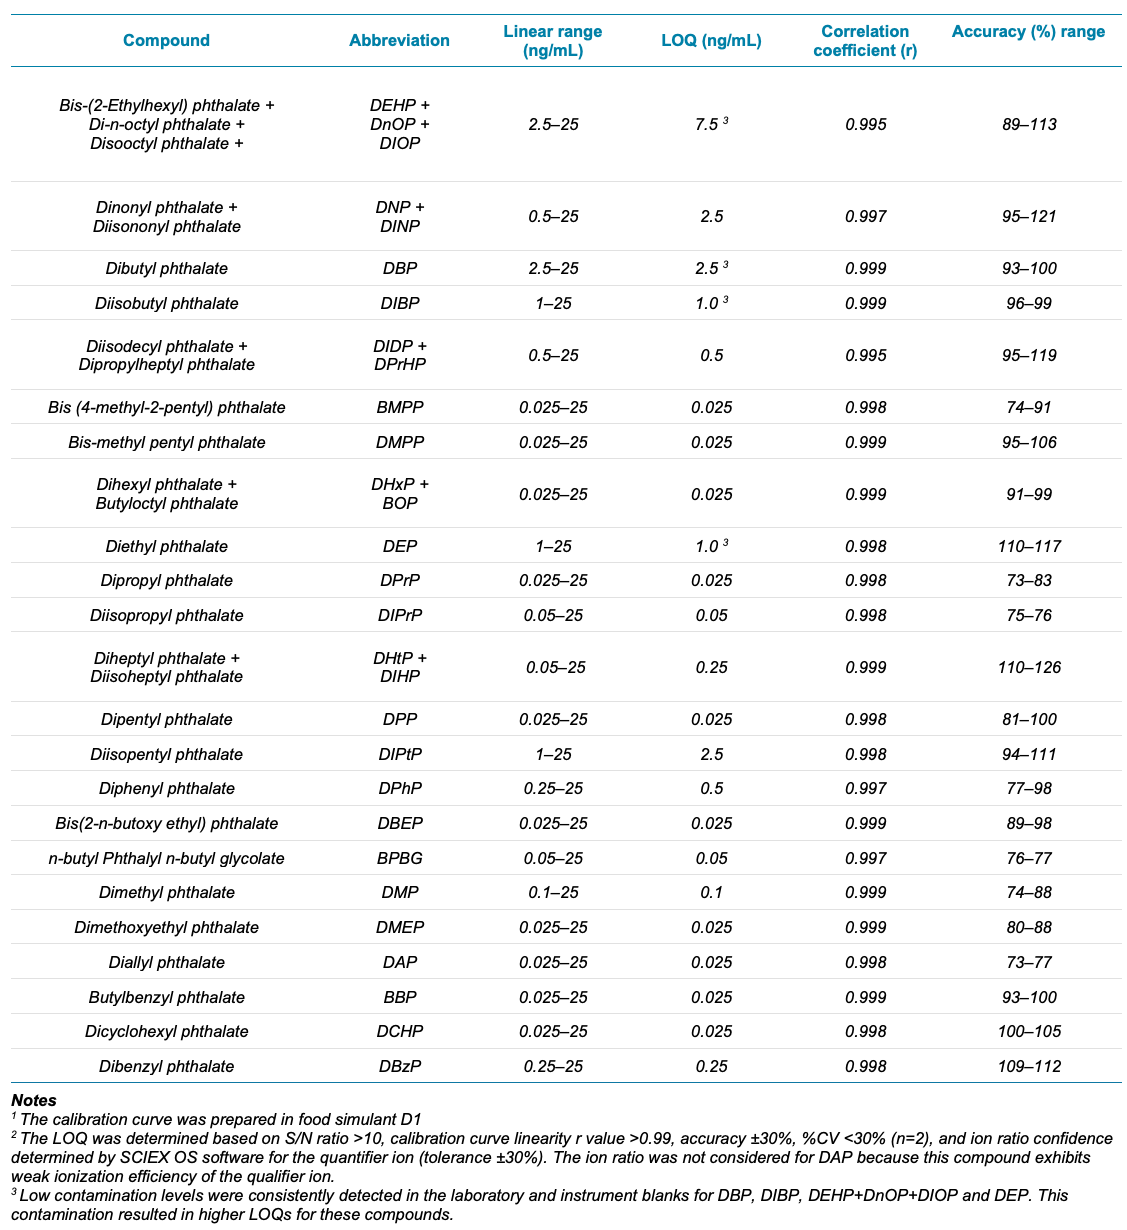
The LOQs ranged from 0.025 to 7.5 ng/mL in the solvent calibration standards (Table 4, example XIC shown in Figure 3). The calibration standard composition was equivalent to simulant D1. Further, the LOQ accuracy was within 20% for most compounds. The linearity of all the compounds was determined by assessing the calibration curve range from 0.025 to 25 ng/mL. An r value >0.99 was achieved for all PEs (Table 4).
PEs are widely used in laboratory equipment and consumables, which frequently results in high blank levels. Here, a novel sample preparation procedure was combined with extensive laboratory hygiene, such as glassware cleaning. This approach yielded blanks with negligible contamination for most PEs and resulted in sub-ng/mL detection of PEs.
Despite these efforts, the LOQs for DBP, DIBP, DEHP+DnOP+DIOP and DEP were still adversely impacted by their detection in the solvent and instrument blanks.
Figure 3. Representative XIC of DEP at 1 ng/mL (top) and BMPP at 0.025 ng/mL (bottom) in the calibration standard.
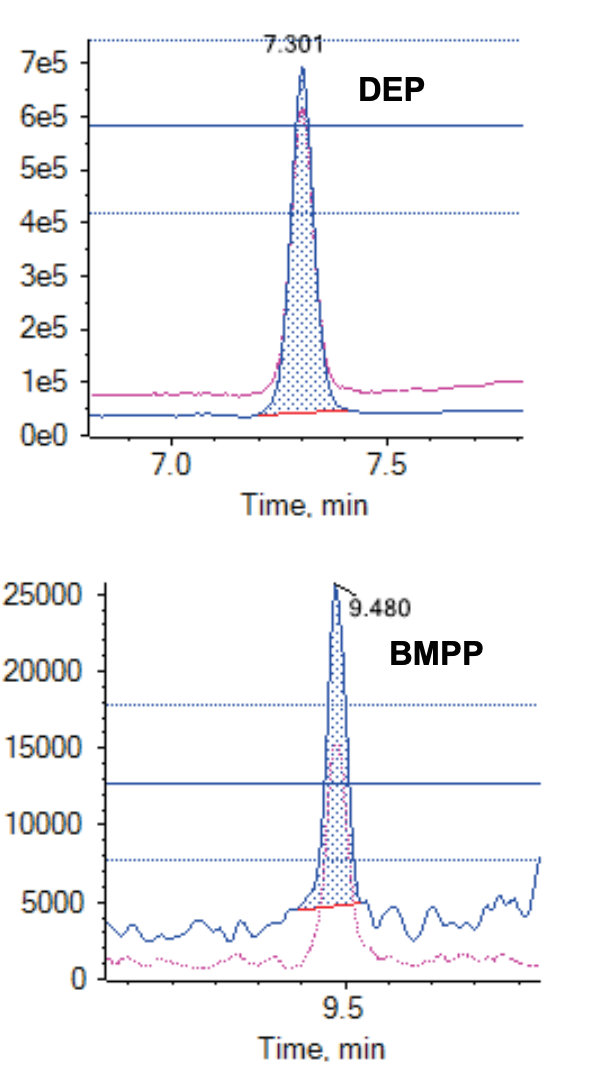
Table 4. Linear range, correlation coefficient (r), accuracy range, and LOQs of the 29 PEs in the solvent calibration standards (n=2). Values were determined from the quantifier ion transition.
Accuracy and precision in food simulant spikes using a single calibration curve
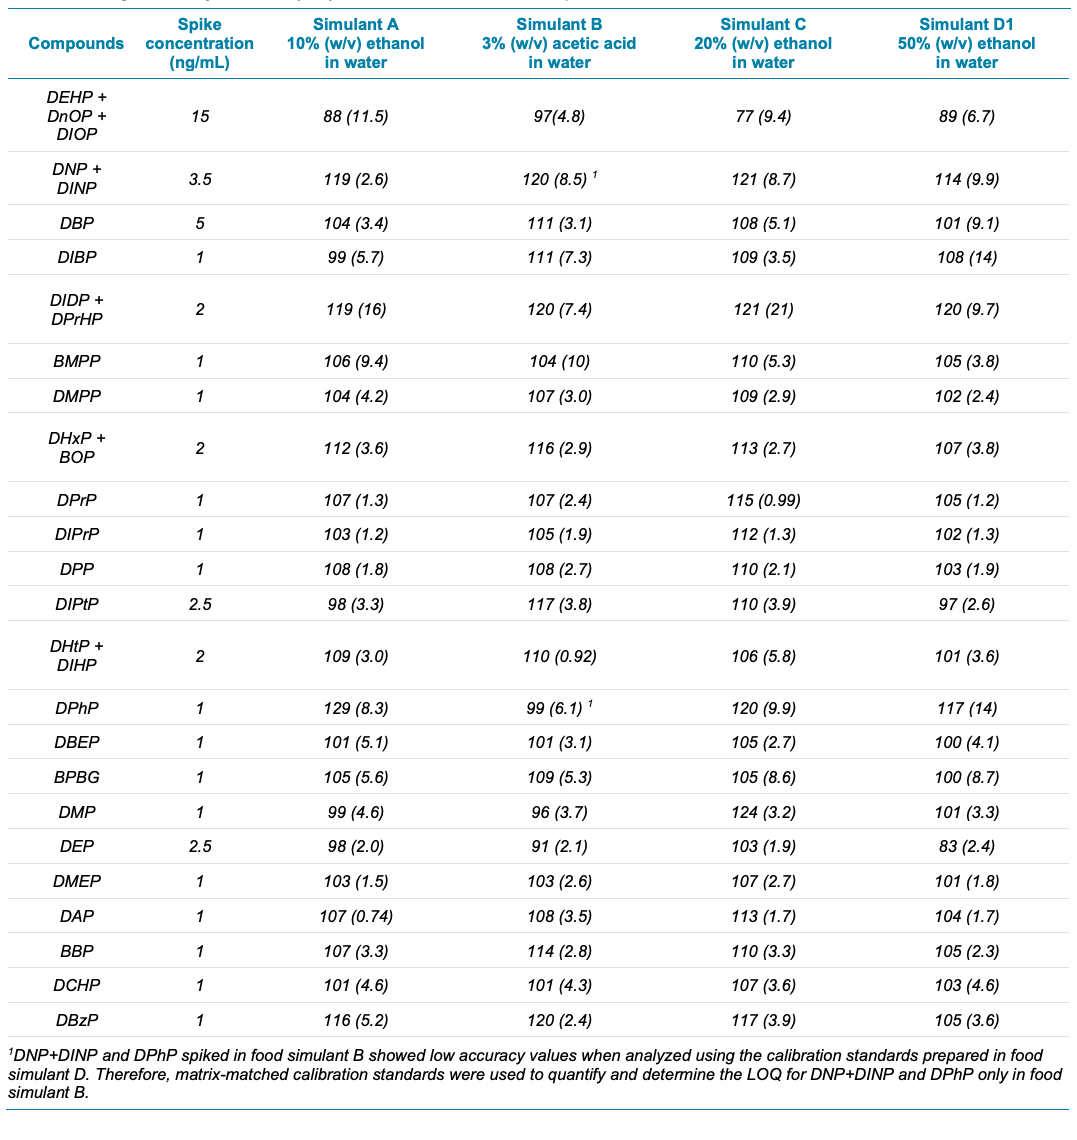
Each of the 4 food simulants were spiked at low-ng/mL levels and analyzed as QC samples (see Table 5 for the spiking levels). The food simulant spikes were quantified against the external calibration standards prepared in food simulant D1. In general, the accuracy was ±20%, %CV was <10% and ion ratio was ±30% (Table 5). Poor recoveries of DNP+DINP and DPhP were observed in simulant B, as discussed in the next paragraph.
Very low recovery values were observed for DNP+DINP and DPhP in simulant B (Table 5) because these PEs were less soluble in food simulant B than in the food simulant D1 used for the calibration curve. Therefore, a matrix-matched calibration curve was prepared using the simulant B diluent and was used to quantify the DNP+DINP and DPhP spikes for this simulant only. The comparisons against the matrix-matched calibration curve yielded excellent data quality. For example, at the 1 ng/mL spike level for DNP+DINP and DPhP, the r values were >0.99, %CVs at the LOQs were <30%, the average accuracies were ±30% and the ion ratios were ±30%.
Overall, these results indicate that the single calibration curve prepared in food simulant D1 can be used to obtain accurate and precise data for the 29 PEs in the 4 diverse food simulants. A matrix-matched calibration curve was only needed for 2 compounds/isomer groups prepared in 1 food simulant.
Table 5. Average accuracy and %CV (n=7) for 29 PEs in food simulant spikes.
Method spikes in a real-world juice sample
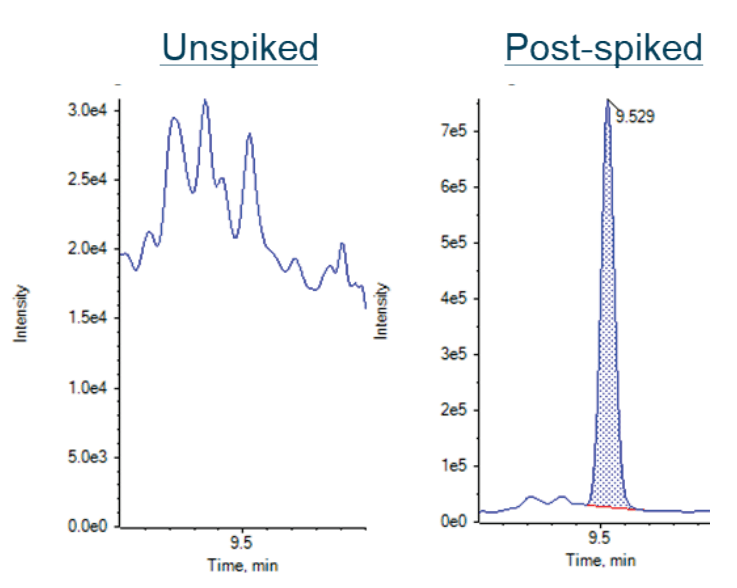
The method applicability was evaluated in post-extraction spikes of a real-world juice sample at 1, 2.5, 5 and 10 ng/mL. Each spiking level was injected 7 times. The average accuracy across the PEs was ±20% and the %CV was <15%, surpassing our acceptance criteria of ± 30% for each spike level in juice sample. Table 6 shows the accuracy and precision results for selected PEs at the 1 ng/mL spiking level. Representative results for DPP are shown in Figure 4. No DPP peak was detected in the unspiked juice sample.
Table 6. Average accuracy and %CV (n=7) for the PEs in the post-spiked juice sample.
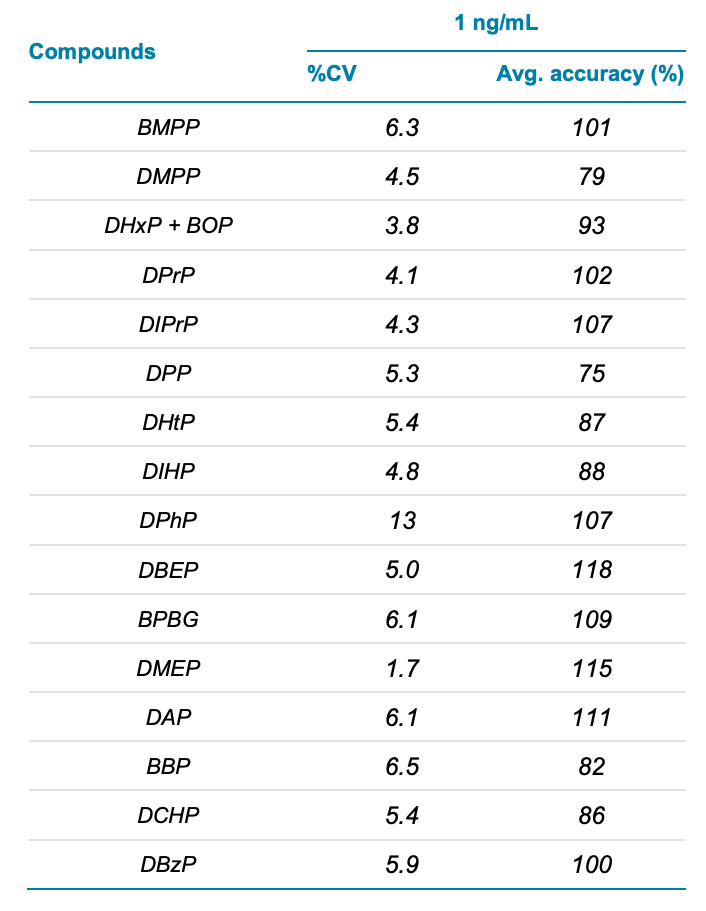
Figure 4. Representative XICs of DPP in the unspiked juice sample (left) and spiked at 1 ng/mL in the juice sample (right).
Unspiked real-world juice sample
Background PE levels were evaluated in the real-world juice sample using the sample preparation and instrumental analysis method described in this technical note. The extracts were injected without further dilution. The unspiked sample was evaluated using the same calibration curve used for the food simulants and spiked juice samples (ethanol: water, 50:50 v/v). Four PEs or isomer groups were detected in the juice sample at levels lower than the LOQ.
Conclusion
- A simple, rapid, and robust method was developed for the quantitation of 29 PEs and was applied to 4 food simulants and a real-world juice sample
- Chromatographic separation of 9 PEs isomers in 4 groups was achieved using a 20-min runtime
- A calibration curve was prepared in simulant D1 and used to quantify PEs in all other food simulants
- Calibration standard (food simulant D1) LOQs ranged from 0.025 to 7.5 ng/mL using the QTRAP 6500+ system
- For all target analytes, the r value was >0.99, accuracies were within the acceptance criteria (70 -130%), precision (%CV) was <30% and ion ratio was ±30%
- The novel sample preparation significantly reduced the system contamination of PEs and allowed the LOQ to reach sub-ng/mL levels
References
- European Commission. (2011) Commission Regulation (EU) No 10/2011 of 14 January 2011 on plastic materials and articles intended to come into contact with food. Official Journal of the European Union.
- Hauser R, Calafat A.M. (2005). Phthalates and human health. Occup. Environ. Med. 62, 806-818.
- Eales J, Bethel A, Galloway T., Hopkinson P, Morrissey K, Short R.E., Garside R. (2022) Human health impacts of exposure to phthalate plasticizers: An overview of reviews. Environ. Int. 158: 106903.