Abstract
In this method sub-parts per trillion (ppt) levels of detection for 26 PFAS compounds was achieved with LOD values of 0.2 ng/L in diluent and calculated method detection limits in drinking, ground, and surface water ranging between 0.06 ng/L and 1.12 ng/L.
Introduction
PFAS compounds are ubiquitous in our environment due to overuse and their lack of breakdown, ensuring that this will be a challenge for decades to come.1 Therefore, it is imperative to provide rigorous and sensitive analytical testing to regulate these compounds and try to limit their possible effects on human health.
In December 2020, the European Parliament and Council of the European Union released a new directive that sets the limit of PFAS in drinking water to 0.5 µg/L for all PFAS compounds identified, and 0.1 µg/L for a subset of PFAS compounds that are particularly concerning for humans. The difference between the limits is dependent on a list of compounds stated within the directive. The 0.1 µg/L limit applies to the compounds included in this list, which contain a perfluoroalkyl moiety with 3 or more carbons (i.e., –CnF2n–, n ≥ 3) or a perfluoroalkylether moiety with 2 or more carbons (i.e., –CnF2nOCmF2m−, n and m ≥ 1). The 0.5 µg/L limit applies to all PFAS compounds in total 2 This method is suitable for drinking water, surface water and groundwater. Testing of surface and ground water is important to ensure that these water sources are not contaminated and that drinking water sources are not affected.
Key features of PFAS analysis using the SCIEX 7500 System
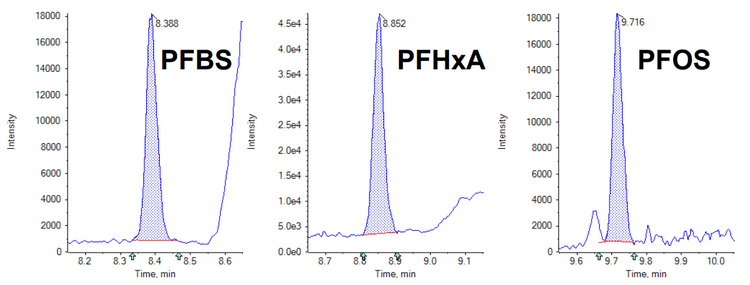
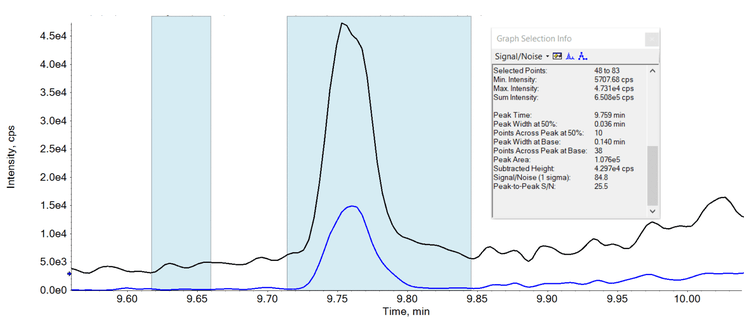
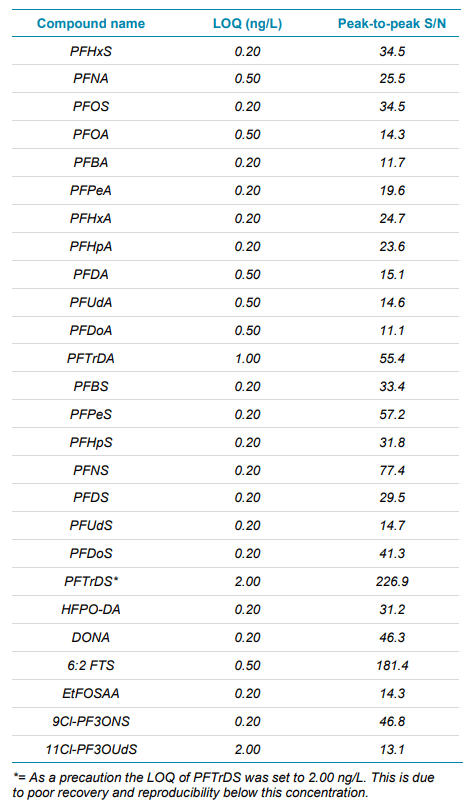
- Ultra-high levels of sensitivity with LOQ values between 0.2 ng/L and 2.0 ng/L. See Figures 1 and 2 which highlight the sensitivity achieved.
- Calculated method detection limits between 0.06 ng/L and 1.12 ng/L in three different water matrices
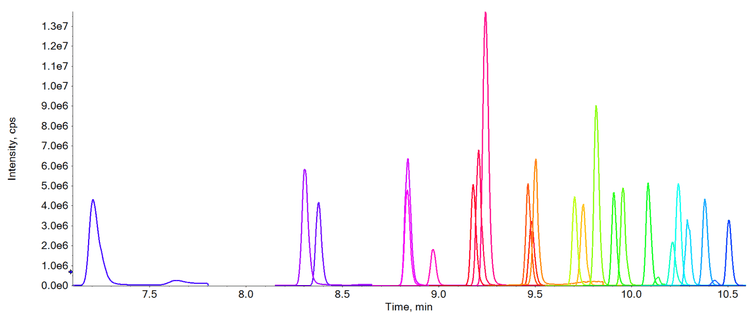
- Twenty-six relevant PFAS compounds analyzed in LC-MS grade, drinking, ground and surface water
- The mitigation of equipment which can cause PFAS contamination to decrease blank contamination and interference at the analyte retention time
Methods
Standard preparation: Mixed standards were prepared in a mixture of LC-MS water: 50:50 acetonitrile/methanol + 0.225 % formic acid at a ratio of 2.5 mL LC-MS water to 2 mL 50:50 acetonitrile/methanol + 0.225 % formic acid.
Sample preparation: 2.5 mL of the water sample was added to 2 mL of a 50:50 acetonitrile/methanol + 0.225 % formic acid solution prior to analysis. Filter the resulting water sample through a 0.45 µm RC filter (Whatman Spartan).
Chromatography: Chromatographic separation was performed using a Phenomenex Luna Omega PS C18, 100 Å, 100 x 2.1 mm, 3 µm (PN: 00D-4758-AN), and a Phenomenex Gemini C18, 110 Å, 100 x 2.0 mm, 3 µm (PN: 00D-4439-B0) delay column. Injection volume was 99 µL. Mobile phase A was 20 mM ammonium acetate in water and mobile phase B was methanol.
Mass spectrometry: The analysis was performed using the SCIEX 7500 System, operated in electrospray ionization in negative ion mode. Q0D optimization was performed and operated in the simple mode for the analysis.
Data processing: Processing was performed using SCIEX OS 2.2 software. The peak-to-peak signal to noise algorithm was used.
Ultra-high sensitivity
As the limits for PFAS compounds continue to be reassessed and reduced it becomes increasingly important to provide methods which achieve limits of detection which are as low as is reasonably possible. See Table 1 which highlights the LOQ values achieved for each compound using this method, when taking all the precautions stated. In comparison, the current lowest limit for total PFAS compounds is 100 ng/L, highlighting the exceptional levels of sensitivity which have been achieved.
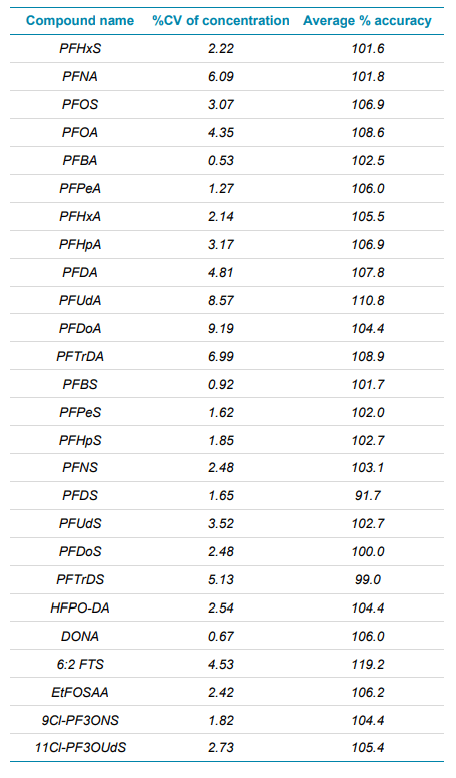
Precision, accuracy, and linearity
In addition to the sensitivity of the method, precision, accuracy and linearity have also been assessed and been found to be within typical validation criteria. During the analytical run, a 10 ng/L standard was analyzed, totaling 8 injections. The injections have then been summarized for both precision and % accuracy in Table 2 for each compound analyzed, highlighting the high levels achieved for both metrics.
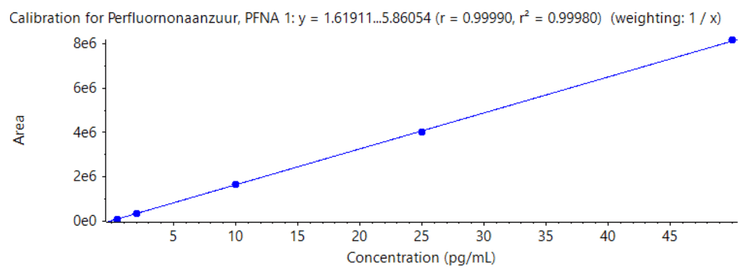
The linearity of each compound has also been reviewed, with each being linear (r value >0.99, 1/x weighting) between their respective LOQs and 50 ng/L. See Figure 4 which shows the linearity of PFNA, and the r value achieved.
Detection limit determination in three different water matrices
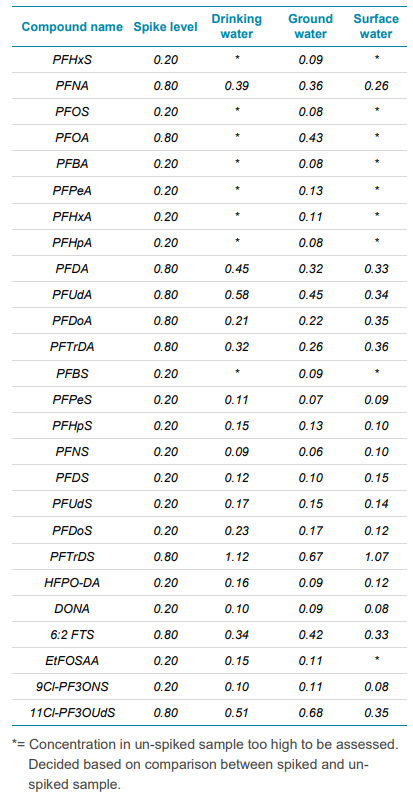
Three sample matrices (drinking, ground and surface water) were spiked at either 0.2 or 0.8 ng/L, dependent on their LOQ determination in Milli-Q water. This determination was performed on eight separate days, with the standard deviation multiplied by three to decide on the detection limit in sample. Determination calculation was based on Het Waterlaboratorium’s internal SOP which is based on the NEN 7777+C1:2012 standard. 3
In Table 3, a summary of each water type analyzed with their corresponding spike level (ng/L) and detection limit in matrix is shown. Spike levels were determined dependent on the sensitivity of the compound, either 0.2 ng/L or 0.8 ng/L, based on the LOQ in Table 1.
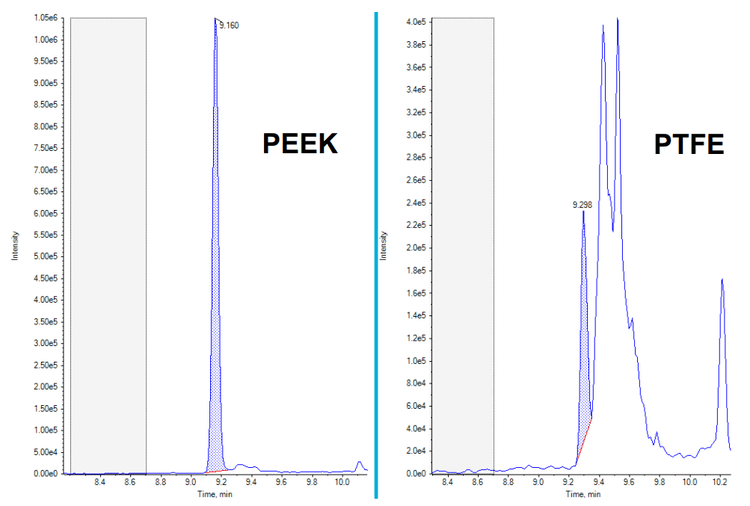
Mitigation of contamination and interference
It has been well documented that when performing PFAS analysis, contamination and interference can be large challenges of a successful analysis due to the numerous sources of these compounds and the interferences which can be observed. See Figure 5 which highlights how the use of different plastics can affect the analysis and especially how the use of PEEK rather than PTFE can reduce backgrounds and interferences.
Here, we detail the some of the steps which we recommend being taken to ensure the analysis of PFAS compounds is as simple and challenge free as possible:
- The use of a delay column to change the retention times of interferences which are inherently present in the UHPLC system.
- The use of LC-MS grade solvents to minimize interferences, lots of solvents should be checked for contamination prior to use.
- All reagents and equipment including glassware, tubing, vials and caps, disposable pipettes, aluminum foil, degassers and filters should be verified before use to ensure they are not providing further contamination.
- Polypropylene containers should be used for the preparation and storage of samples and standards. This is due to finding a loss in signal when stored in glass.
- All re-used supplies including glassware should be washed with hot water and detergent (e.g. Alconox) before being rinsed with distilled water and finally an organic solvent such as acetone.
- The removal of as much PTFE tubing as is possible on the UHPLC system and replacing with PEEK.
Conclusion
- It is possible to achieve ultra-high levels of sensitivity for PFAS compounds down to 0.2 ng/L when using the SCIEX 7500 System
- Excellent levels of precision, accuracy and linearity have been achieved for all compounds analyzed
- Calculated detection limits down to 0.06 ng/L in three different water matrices
- The importance of reducing interferences and contamination is paramount to a successful PFAS analysis
References
- Per and polyfluoroalkyl substances scientific literature review: water exposure, impact on human health, and implications for regulatory reform, September 2020
- Directive (EU) 2020/2184 of the European parliament and of the council on the quality of water intended for human consumption, December 2020.
- NEN 7777+C1:2012 standard - Environment and food - Performance characteristics of measurement methods – December 2012