CCa and CCb automatic calculation and flagging in SCIEX OS-Q Software
Yoann Fillâtre,1 Loïc Beyet,1 Jianru Stahl-Zeng2
1SCIEX, France, 2SCIEX, Germany

Introduction
Veterinary drugs are commonly used in livestock breeding to prevent or treat infections of the animals and to ensure their optimal growth. LC-MS/MS is the method of choice to routinely control the concentration of their residues in food of animal origin. As some of the veterinary drugs are banned substances, the traceability of the methods performance is critical. Laboratories must follow the European Decision no. 657/2002/EC concerning the performance of analytical methods and the interpretation of results and calculate two statistical limits:1
- The decision limit CCa means the limit at and above which it can be concluded with an error probability of α (1% for substances with non-permitted limits and 5% for substances with a permitted limit such as the Maximum Residue Limit (MRL) that a sample is non-compliant1
- Detection capability (CCβ) means the smallest content of the substance that may be detected, identified and/or quantified in a sample with an error probability of β (5% for all substances with a permitted or no permitted limit)1
Based on the recommendation of CD657/2002/EC, CCα and CCβ can be calculated with either one of the two following approaches. The first method is based on the calculation of the signal-to-noise ratio of 20 blank samples for banned substances and 20 blank samples spiked at the MRL for permitted substances. The second approach, based on the calibration curve procedure defined in the ISO 11843,2 is often preferred by the laboratories because of its greater ease of implementation for routine analyses. The calculation is based on day-to-day calibration of the method analyzing the batch of interest including the unknown samples to be controlled.3
The complexity of the calculation requires the use of a spreadsheet software such as Excel to determine CCa and CCb. This procedure requires, at minimum, the manual step of copying/pasting the area of each analyte peak into the spreadsheet. Therefore for each analyte and each batch of analyses, CCa and CCb must be first calculated before the analyst can then compare and review the analyte concentration versus these decision limits. This means that the procedure is very time consuming for a laboratory to perform routinely.
Thanks to the inclusion of advanced and flexible calculation capabilities in SCIEX OS Software as shown in Figure 1, this calculation can now be executed automatically in the software, saving a lot of time and minimizing the risk of error for laboratories.
Figure 1. Automatic analysis. Automatic calculation of CCa and CCb for both non-permitted and permitted substances with defined MRL + automatic flagging of samples with concentration above those decision limits.
Key features
- Automatic calculation of CCa and CCb for both non-permitted and permitted substances at the same time
- Automatic flagging of samples with analyte concentrations above CCa and/or CCb
Methods
A set of matrix-spiked calibrants must be analyzed with at least three levels of equally-distant concentrations. The critical concentration can be calculated as followed:
Critical concentration.
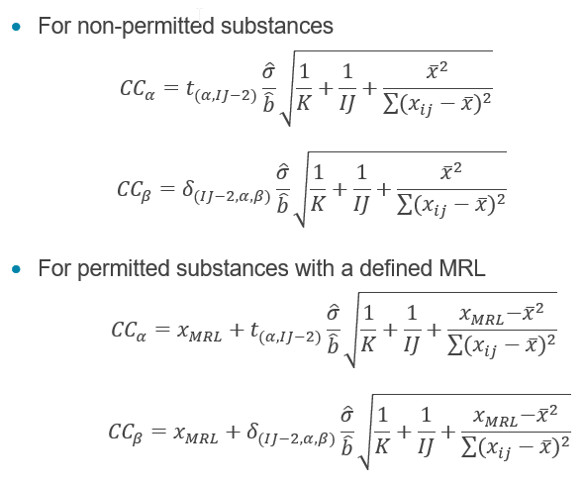
Table 1. Definition of the calculation parameters.
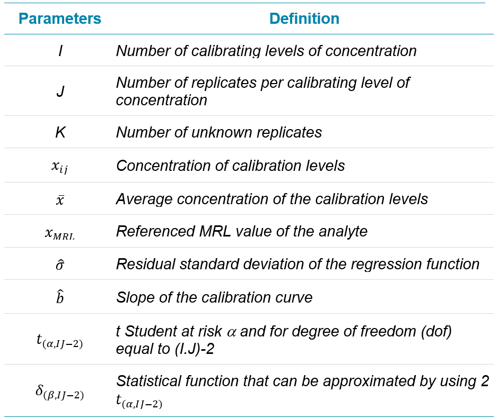
The following constant values I, J, K, t student at confidence level of 95 and 99 % and the MRL are manually entered in the corresponding custom column. Some of these values can be different from one analyte to another and can be modified accordingly.
Critical limits CCa and CCb.
CCa and CCb calculation
For non-permitted substances:
Figure 2 displays the results comparison of CCa and CCb between the automatic calculation with SCIEX OS Software and the classical calculation with a spreadsheet software (bottom right) for the non-permitted substance Mefenamic Acid.
In this case, the constant values have the following values: I = 4, J = 2, K = 2 (only one repetition is shown in the results table), MRL = 0, t student (1%) = 3.143 and t student (5%) = 1.943. SCIEX OS Software is then able to calculate (Delta), (Sigma) and finally CCa (1%) and CCb (5%).
As shown in Figure 1, the results obtained with SCIEX OS Software (CCa = 0.615; CCb = 0.760) are strictly identical as those obtained by the spreadsheet software.
For permitted substances with a defined MRL:
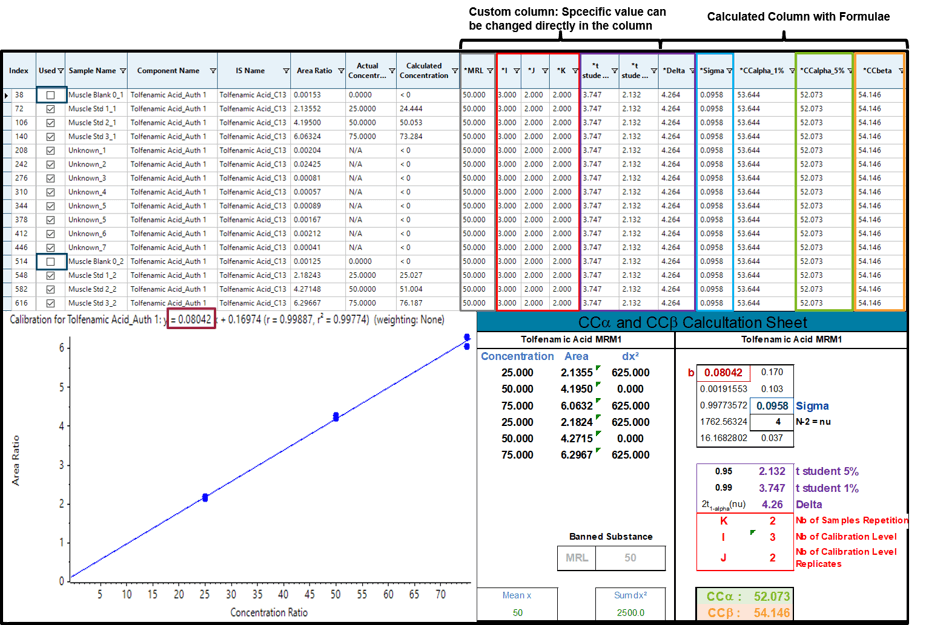
Figure 3 displays the results comparison of CCa and CCb between the automatic calculation with SCIEX OS Software and the classical calculation with a spreadsheet software (bottom right) for the permitted substance Tolfenamic Acid.
In this case, the first calibration level is removed thus changing the value of I (I = 3) and t student (1 %: 3.747; 5 %: 2.132) which can be done directly in the result table. Additionally, the regulatory MRL of Tolfenamic acid must be set in the MRL column. The calculation of CCa (5%) and CCb (5%) return the exact same results as the spreadsheet software (CCa = 52.073; CCb = 54.146) confirming the validity of the calculations.
Figure 2. CCa and CCb for the non-permitted substance mefenamic acid.
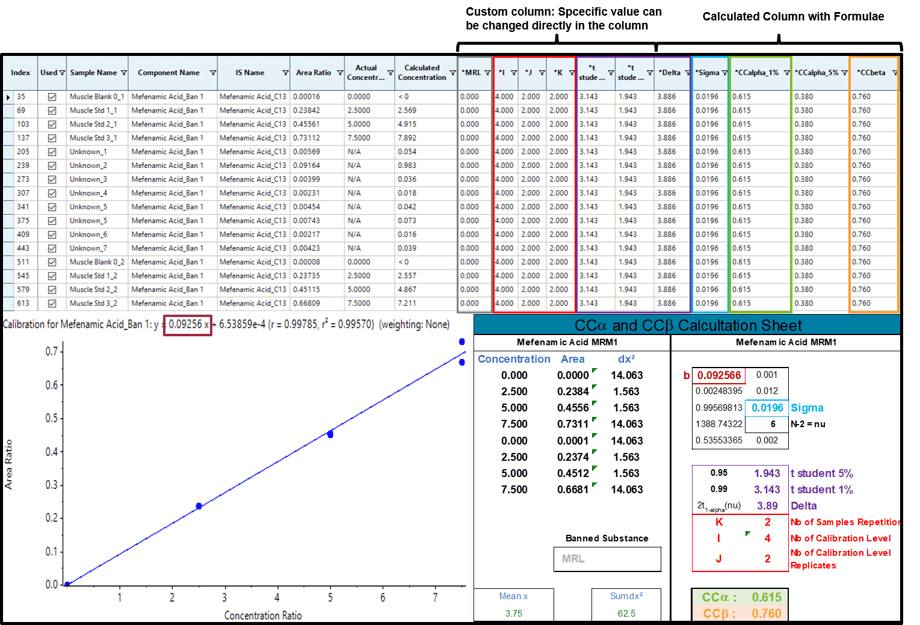
Figure 3. CCa and CCb for the permitted substance tolfenamic acid with a MRL of 50 µg/kg.
Flagging non-compliant results
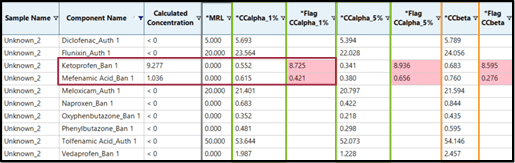
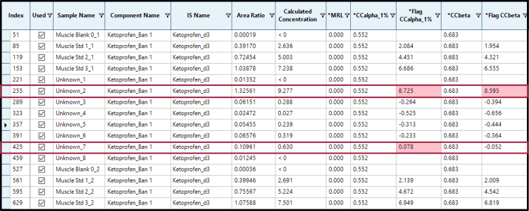
By adding calculated columns (Flag CCalpha 1%) and (Flag CCbeta) which compare the calculated concentration of the analyte in the sample with the calculated CCa and CCb, SCIEX OS Software is able to automatically flag every concentration above these decision limits. Figure 4 shows the example of the non-permitted substance Ketoprofen. In this example, the concentrations of Ketoprofen found in samples “Unknown_2” (9.277 µg/kg) and “Unknown_7” (0.630 µg/kg) are exceeding CCa (0.552) and CCb (0.683) in the first case but only exceeds CCa (0.552) in the second case.
Therefore, the automatic calculation of CCa and CCb in combination with the real-time flagging of samples with concentrations above these decision limits can save a lot of time and minimize the risk of error for laboratories thus improving the efficiency of their workflow.
Figure 4. SCIEX OS Software flags results above CCa and CCb.
References
- European Commission, 2002/657/EC: Commission Decision of 12 August 2002 implementing Council Directive 96/23/EC concerning the performance of analytical methods and the interpretation of results (Text with EEA relevance) (notified under document number C(2002) 3044), 2002. (accessed August 28, 2019).
- ISO, ISO 11843-2:2000, n.d. (accessed August 30, 2019).
- E. Verdon, D. Hurtaud-Pessel, P. Sanders, Evaluation of the limit of performance of an analytical method based on a statistical calculation of its critical concentrations according to ISO standard 11843: Application to routine control of banned veterinary drug residues in food according to European Decision 657/2002/EC, Accreditation Qual. Assur. 11 (2006) 58–62.