Abstract
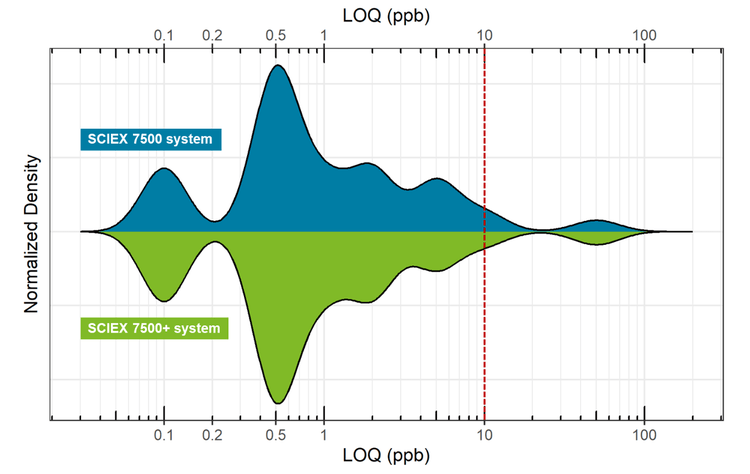
In this technical note, a comparative study was performed to evaluate the sensitivity performance of the SCIEX 7500 system and the SCIEX 7500+ system for the quantitation of pesticides in orange juice. Food and beverage samples are known for their complexity and contributions to matrix effects from co-extractables. Furthermore, these matrices are known to contribute to instrument contamination. The SCIEX 7500+ system with Mass Guard technology1 was designed to address instrument robustness while maintaining the sensitivity of the SCIEX 7500 system. Herein, a quantitative method for analyzing >200 pesticides in orange juice demonstrated method transferability and equivalent sensitivity from the SCIEX 7500 system to the more robust SCIEX 7500+ system (Figure 1).
Key benefits of pesticides quantitation on the SCIEX 7500+ system
- Easy method transfer with equivalent quantitative performance: Using the same instrument and compound parameters, comparable lower limits of quantitation (LLOQ) values (mid ppt to high ppb) were achieved on both the SCIEX 7500 system and SCIEX 7500+ system
- Rapid sample preparation and low matrix load: The sensitivity on both systems enabled a rapid dilution approach and 1 µL injection volumes, which reduced matrix effects and the need for extensive sample clean-up
- User accessibility to front-end cleaning: Routine maintenance, including self-directed removal and cleaning of the DJet+ assembly, helps to maintain the robustness of the SCIEX 7500+ system
Introduction
The analysis of pesticides in food and beverage matrices is essential in assuring food safety. The European Commission has imposed maximum residue limits (MRLs) on pesticide residue levels in food and animal feed.2 As such, considerable efforts are directed toward the quantitative analysis of these compounds. High-performance liquid chromatography-mass spectrometry (LC-MS/MS) is a powerful analytical technique used for pesticide residue testing in food due to its high sensitivity and specificity. However, their detection is challenging due to the diverse chemistry and occurrence of pesticides and the complexity of food matrices. Considering that the EU MRLs for many pesticides are in the sub-to-low parts per billion (ppb) range,2 instrument robustness is important for maintaining assay sensitivity and analytical productivity.
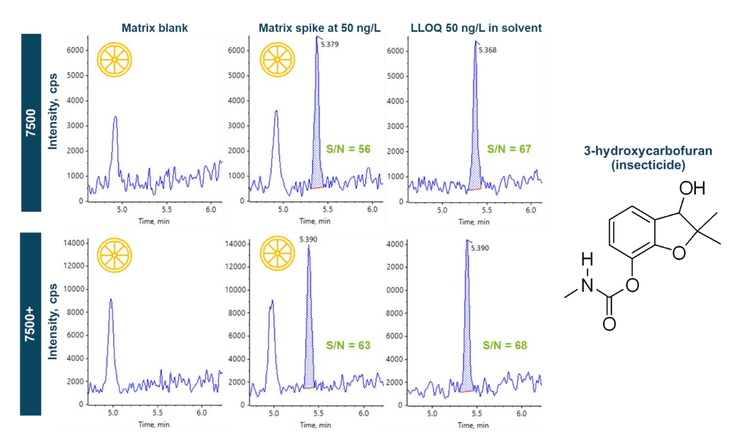
The SCIEX 7500+ system features enhanced robustness using Mass Guard technology1 that maintains the high sensitivity of the SCIEX 7500 system while providing dedicated hardware components that decrease instrument contamination and improve customer access to the instrument front-end DJet+ assembly to facilitate instrument cleaning.3 In this technical note, the SCIEX 7500 system and SCIEX 7500+ system demonstrated equivalent sensitivity based on S/N within ±20% of one another and similar LLOQ values in the mid-ppt to high-ppb range for the target panel of pesticides analyzed. In both systems, >90% of the pesticides exhibited LLOQs below the general default MRL of 0.01 mg/kg specified for most pesticides.3
Methods
The same LC conditions and MS parameters were used on both the SCIEX 7500+ system and SCIEX 7500 system. The same samples were used for analysis on both platforms.
Samples and reagents: The iDQuant standards kit,4 comprised of >200 pesticides, was used to prepare solvent calibration standards and matrix spikes in orange juice. A series of mixed stock standard solutions (1–1000 ng/mL) was prepared in acetonitrile and stored at -20oC until analysis. An aqueous-based calibration curve (10–50,000 ng/L) was prepared in MilliQ water for LC-MS/MS analysis. Orange juice was purchased from a local supermarket and stored at -20oC until analysis.
Sample preparation: Upon thawing, a representative 50 mL aliquot of orange juice was centrifuged at 4000 rpm for 5 min to sediment the pulp. A 1 mL aliquot of the supernatant was diluted with 9 mL of water, then filtered through a 0.45 µm syringe filter (VWR International) for matrix post-spikes. The final spiking concentrations ranged from 50 to 5000 ng/L in the extract, equivalent to 5 to 500 ng/L based on the 10x dilution during sample preparation. The final extracts were directly injected for LC-MS/MS analysis.
Chromatography: Chromatographic separation was performed on a Shimadzu Prominence LC20 system using a Phenomenex Kinetex Biphenyl (2.1 x 50 mm, 2.6 µm, 100 A , P/N 00B-4622-AN) column. A flow rate of 0.4 mL/min, an injection volume of 1 µL and a column temperature of 40oC were used. The LC gradient used is shown in Table 1.
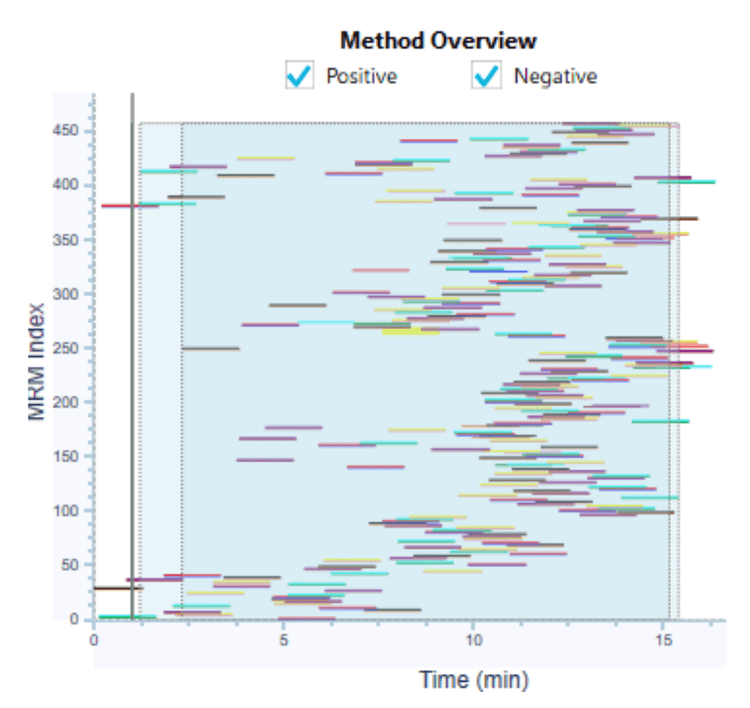
Comparison of the quantitative performance between the SCIEX 7500+ system and 7500 system
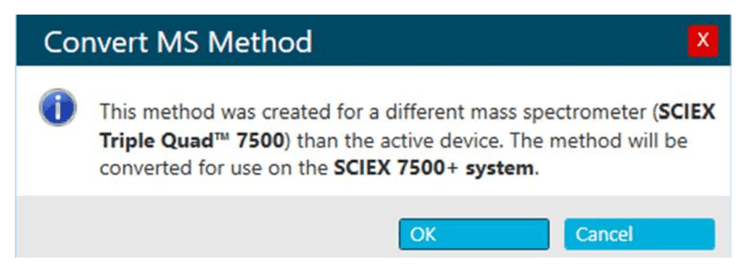
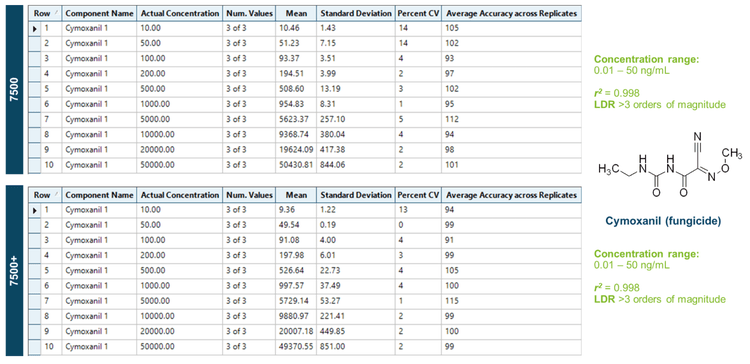
The target pesticides panel was quantified using a solvent-based calibration curve that spanned at least 3 orders of magnitude with r2 >0.99 for most analytes on the SCIEX 7500 system and SCIEX 7500+ system. To demonstrate the ease of method transfer and to create a normalized instrument comparison, the same instrument and compound parameter settings were used on both systems, and the same HPLC system was used for all experiments. The converter tool in SCIEX OS software facilitated a seamless transfer of the method parameters to ensure that the same acquisition methods were used on both systems (Figure 3).
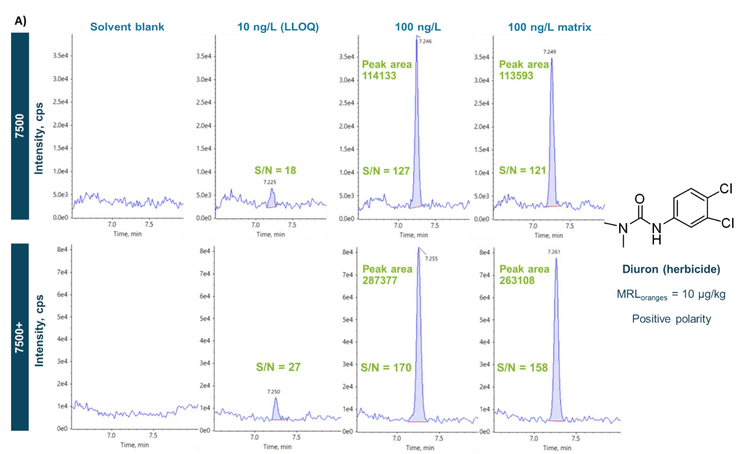
The measurement of pesticides in both the solvent and the orange juice matrix is illustrated in Figures 5A and B. Figure 5A shows the representative XICs of an example herbicide, diuron, in the solvent blank, solvent standards at the LLOQ of 10 ng/L and 100 ng/L and orange juice post-spiked at 100 ng/L acquired in positive ion mode using the two systems. Except for the solvent blank, which shows no apparent peak for diuron, all peaks had S/N values > 10, indicating they are above the instrumental LOQs for this compound. Figure 5B shows another representative series of XICs for the insecticide, fipronil acquired in negative ion mode. As with the data generated for diuron, the S/N ratio values are >10 for all concentrations measured, and the results were similar on both instruments. In addition, Figures 5A and B demonstrated similar peak areas between the 100 ng/L solvent standard and the orange juice matrix post-spiked at the same concentration. By calculating the quotient of the peak areas obtained in the post-spiked matrix and the solvent standard, the matrix effects for diuron and fipronil were <10% on both systems. The sensitivity of the SCIEX 7500 system and SCIEX 7500+ system enabled a dilution approach for rapid sample preparation and 1 µL injections, which helped minimize matrix effects and simplify quantitation via solvent-based calibration.
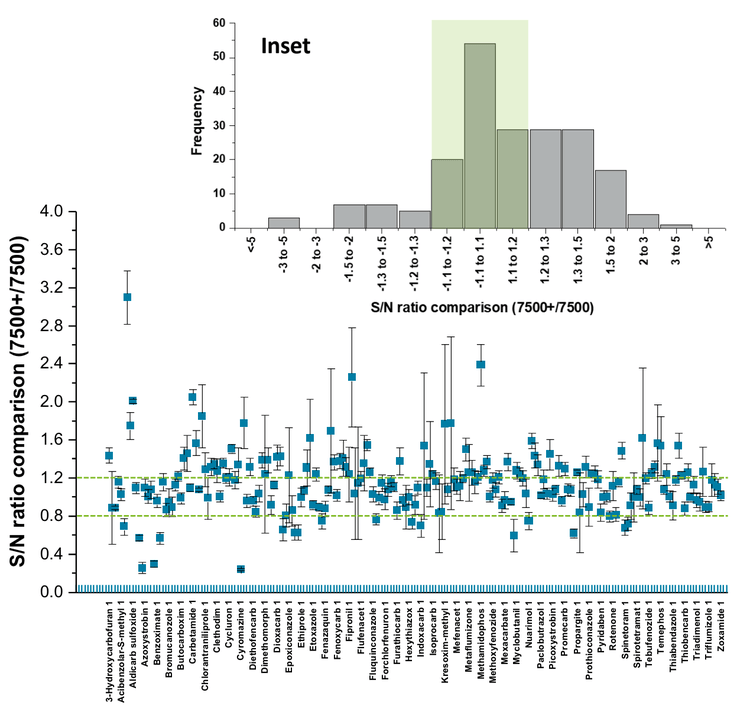
Another measure of instrument equivalency is illustrated in Figure 6, which shows the distribution of normalized S/N ratios for 205 pesticides (500 ng/L) measured on the two systems. Each pesticide was measured in triplicate on both instruments, and the S/N was calculated using SCIEX OS. These values were then normalized by dividing the S/N value computed using the SCIEX 7500+ system by the S/N value obtained using the SCIEX 7500 system. A value of 1.0 corresponds to equal S/N values for each instrument. Most of the pesticides had S/N ratios within 20% of one another, as indicated by the green lines that denote the mean ± 20%. The Inset of Figure 6 shows the same distribution in histogram form, with the green shaded area highlighting the range of ±20%. These data show that the results acquired on both instruments have similar S/N ratios and reinforce the conclusion that both systems have equivalent sensitivity for measuring pesticides.

Conclusion
- Equivalent or lower LOQ values were achieved for the quantitation of 90% of the pesticides measured on the SCIEX 7500+ system as compared to the SCIEX 7500 system
- The S/N calculations for pesticides were the same, if not slightly higher, on the SCIEX 7500+ system as compared to the SCIEX 7500 system
- User access to the DJet+ assembly enables a convenient way to manage front-end cleaning and ensure system uptime for routine analysis
References
- Lee, H; Moore, I; Butt, C.M; Jones, E.J. Achieving exceptional robustness for PFAS analysis in food with the next-generation SCIEX 7500+ system. SCIEX technical note, MKT-31304-A.
- European Commission. EU Pesticides Database. https://food.ec.europa.eu/plants/pesticides/eupesticides-database_en
- Build resilience with the 7500+ system. SCIEX brochure, MKT-31468-A.
- Schreiber, A. Using the iDQuant™ Standards Kit for Pesticide Analysis to Analyze Residues in Fruits and Vegetable Samples. 2011. Publication No: 3370211-01.

