Leveraging high-resolution mass spectrometry (HRMS) for resolving PFAS interferences and quantitation in food matrices
Brian Ng1, Maria Moreno-Santiago1, Susan Genualdi1, Christine M. Fisher1, Wendy Young1, Holly Lee2 and Craig M. Butt3
1Human Foods Program, U.S. Food and Drug Administration, USA; 2SCIEX, Canada; 3SCIEX, USA
Abstract
This technical note describes an LC-HRMS method for the simultaneous quantitation and identification of PFAS in food using the ZenoTOF 7600 system. The selectivity from HRMS acquisition helped mass-resolve PFAS from their interferences, resulting in more confident compound confirmation in complex food matrices (Figure 1). Matrix spikes demonstrated acceptable method performance for most analytes at target limits of quantitation (LOQs) set by food testing authorities and below the regulated maximum residue limits (MRLs). The instrument sensitivity from ZenoMRMHR acquisition also enabled a small injection volume of 3 µL and solvent-based calibration to minimize matrix effects, while still achieving sub-ppb LOQs.
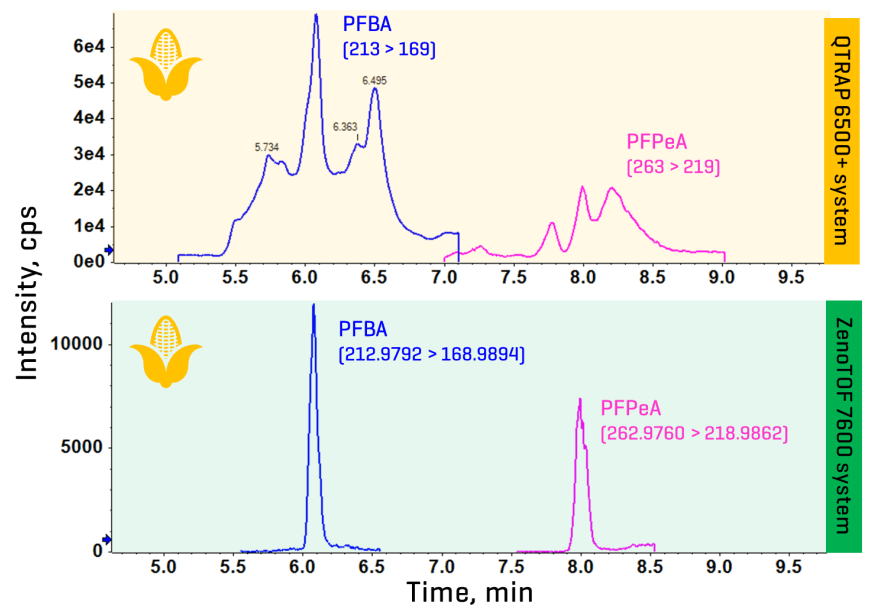
Figure 1. The power of high-resolution mass spectrometry for resolving matrix interferences in food. Comparison of representative extracted ion chromatograms (XICs) acquired on a nominal (top) and accurate (bottom) mass spectrometer demonstrates how the higher selectivity from the latter can be used to significantly improve the detection of PFBA and PFPeA by resolving co-eluting matrix interferences in a 0.15 µg/kg corn snaplage spiked extract.
Key benefits of the ZenoTOF 7600 system for analyzing PFAS in food matrices
- Mass-resolving matrix interferences: HRMS selectivity enabled more confident PFAS detection by mass-resolving co-eluting interferences in food matrices.
- Matrix recoveries meeting target criteria: >85% of the analyte/matrix combinations tested met the recovery and repeatability performance requirements established by food testing authorities
- Leveraging ZenoMRMHR sensitivity for quantitation: Reduced matrix effects from smaller injections enabled the use of solvent-based calibration, while achieving sub-ppb LOQs for quantitation
Introduction
Nominal mass triple quadrupole systems are predominantly used for quantifying PFAS in food due to their high sensitivity.1,2 However, high-resolution mass spectrometry (HRMS) is being increasingly adopted due to its high selectivity for differentiating PFAS and their interferences in complex matrices.3 Newer accurate mass systems, such as the ZenoTOF 7600 system, have also approached nominal mass sensitivity performance due to innovations like the Zeno trap, which can recover as much as 90% of duty cycle loss that typically occurs prior to detection.4 The resulting gains in MS/MS sensitivity produce more intense fragments with higher-quality MS/MS spectra, which simultaneously improve quantitation and identification. The latter is critical for confirming low-level detection of PFAS, especially in the presence of co-eluting interferences and for analytes with one MS/MS transition, such as PFBA and PFPeA.
Here, we demonstrate the application of HRMS for removing matrix interferences to unequivocally confirm PFAS detections in food. The method also met established performance criteria at the target levels required for PFAS quantitation in food, as prescribed in the EU recommendation 2022/1431 and AOAC standard method performance requirement (SMPR).5-8
Methods
Chemical standards and samples: Native and isotopically-labeled standards were purchased from Absolute Standards, Wellington Laboratories and Cambridge Isotope Laboratories. Solvent calibration standards were prepared at in-vial concentrations of 0.01–25 ng/mL in methanol. The matrices tested included salmon, clam, egg and corn silage feed.
Sample preparation: Prior to extraction, all samples were homogenized or ground into powder. The samples were extracted using a QuEChERS method that had been developed for PFAS analysis in food.1 In a 50 mL centrifuge tube, 5 g of homogenized food or 1 g of powdered feed was combined with water (5 mL for most foods, 15 mL for feed), then extracted with 10 mL of acetonitrile and 150 µL of formic acid. Upon adding a salt packet (6 g MgSO4, 1.5 g NaCl), the sample was vortexed and shaken for 5 min at 1,500 rpm. After centrifuging at 10,000 rcf for 5 min, the supernatant was transferred to a 15 mL dispersive solid phase extraction (dSPE) tube (900 mg MgSO4, 300 mg PSA and 150 mg GCB). After shaking and centrifuging the dSPE tube, the supernatant was filtered through a 0.2 µm nylon filter into a 15 mL centrifuge tube. For the salmon, clam and egg samples, 1 mL of the filtered supernatant was diluted to 12 mL with water for SPE clean-up. For the corn silage samples, the 5 mL dSPE extract was first concentrated to 1 mL before diluting to 12 mL with water for SPE clean-up.
SPE clean-up: Preconditioning of the Strata XL-AW SPE cartridge (100 µm, 200 mg/6 mL, Phenomenex P/N: 8B-S051-FCH) involved passing through 6 mL of 0.3% (v/v) ammonium hydroxide in methanol, followed by 5 mL of water. After loading the 12 mL QuEChERS extract, 5 mL of water was added to wash the cartridge before allowing it to dry for 1 minute. Analytes were eluted by the addition of 4 mL of 0.3% (v/v) ammonium hydroxide in methanol. After concentrating the sample to 1 mL, an aliquot of the extract was transferred to a filter vial for LC-MS/MS analysis. ENVI-carb clean-up was added for food matrices prone to bile acid interferences.
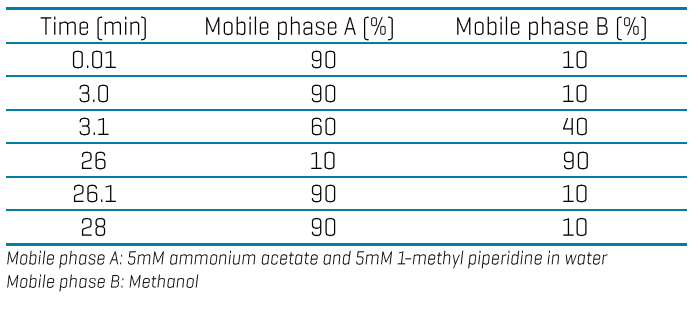
Chromatography: Chromatographic separation was performed on a Shimadzu Nexera X2 system using a Waters XBridge C18 column as the analytical column (150 x 2.1 mm, 3.5 µm) with a Waters Vanguard Acquity BEH C18 guard column (5 x 2.1 mm, 1.7 µm). The delay column was a Waters XBridge C18 column (50 x 2.1 mm, 5 µm). A flow rate of 0.3 mL/min, an injection volume of 3 µL and a column temperature of 40oC were used. The LC gradient used is shown in Table 1.
Table 1: Chromatographic gradient for PFAS analysis in food.
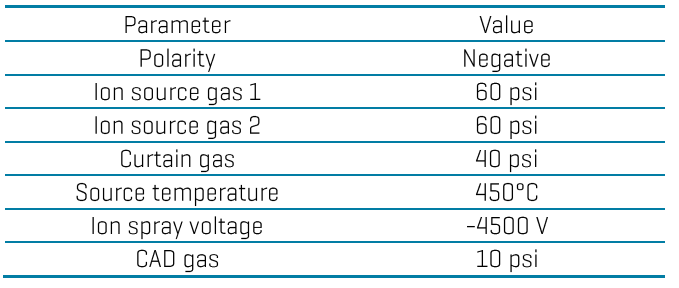
Mass spectrometry: Analysis was performed in negative electrospray ionization mode on the ZenoTOF 7600 system. Data were acquired using multiple reaction monitoring (MRMHR) with Zeno pulsing enabled. Table 2 lists the optimized source and gas conditions, while the TOFMS/MS compound-dependent parameters are listed in the Appendix. The TOFMS scan covered a mass range of 50–1000 Da with an accumulation time of 0.05 sec, declustering potential (DP) of -60V, collision energy (CE) of -10V and collision energy spread (CES) of 0V.
Table 2: Source and gas parameters for PFAS analysis in food using the ZenoTOF 7600 system.
Data processing: Data acquisition and processing were performed using SCIEX OS software (version 3.1.5). The SCIEX Fluorochemical HR-MS/MS Spectral Library (version 2.0) was used for library searching.
Leveraging HRMS for resolving interferences and providing orthogonal confirmation of PFAS
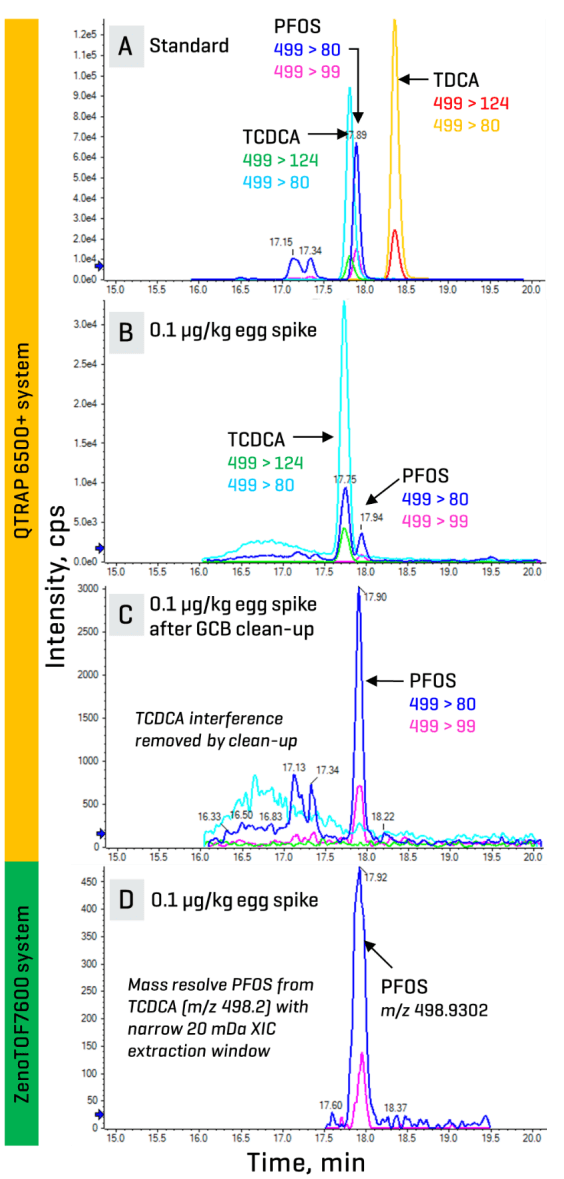
Identifying both known and unknown interferences is challenged by the diversity of food matrices and classes of PFAS. These interferences may be present as co-eluting chromatographic peaks or contribute to erroneously high levels, which can result in false positives or introduce quantitative biases.9 For example, the precursor mass (m/z 499) of taurodeoxycholic acid (TDCA), tauroursodeoxycholic acid (TUDCA) and taurochenodeoxycholic acid (TCDCA) is indistinguishable from that of PFOS at unit resolution on nominal mass systems. These bile acids are often observed co-eluting with PFOS when monitoring their common [SO3]- fragment (m/z 80) (Figures 2A, 2B).10,11 Individual monitoring of secondary transitions such as m/z 499 > 99 for PFOS and m/z 499 > 124 for the bile acids can help confirm their presence. Other solutions include time-consuming modifications to the LC method or sample preparation (Figure 2C) to either resolve or remove these interferences. On the other hand, an accurate mass system enabled the use of a narrow 20 mDa XIC extraction window to mass-resolve the high-resolution precursor mass of PFOS at m/z 498.9302 from that of the TCDCA interference at m/z 498.2619 in a spiked egg sample (Figure 2D).
Figure 2. Different approaches for managing interferences. XICs show the co-elution of PFOS and TCDCA in a solvent standard (A) and a spiked egg extract (B) on a nominal mass system. The TCDCA interference can be removed by an extra GCB clean-up step or monitoring the more specific, but less sensitive m/z 499 > 99 transition on the same nominal mass system (C). An accurate mass system enables the use of a narrow XIC window (20 mDa) centered over the precursor mass of PFOS (m/z 498.9302) to distinguish it from that of the TCDCA interference (D).
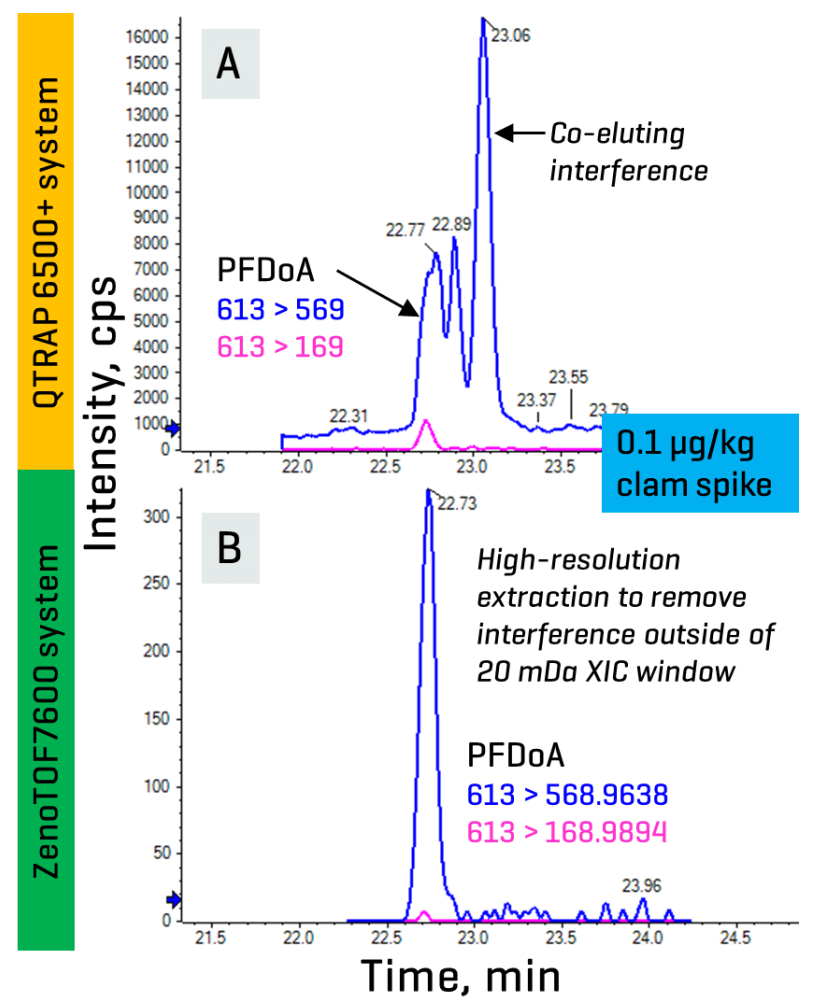
The benefit of HRMS for PFAS detection is more pronounced in the presence of novel interferences, which may not always be easily mitigated by chromatography or sample preparation due to their unknown properties. Figure 3A demonstrates such an interference co-eluting with the m/z 613 > 569 transition of PFDoA in a spiked clam extract on a nominal mass system.
Monitoring the more specific but less sensitive m/z 613 > 169 transition can help confirm the presence of PFDoA, but this was not possible for the interference due to a lack of known unique transitions. Figure 3B shows the XIC of PFDoA in the same clam sample acquired on the ZenoTOF 7600 system that had been extracted with a narrow 20 mDa width. Any background interferences with masses that fell outside this extraction window were mass-resolved from the target PFDoA.
Figure 3. Comparison of PFDoA in a 0.1 µg/kg clam spike analyzed on a nominal mass (top) and accurate mass (bottom) system. XICs show the co-elution of an unknown interference with PFDoA when monitoring the more sensitive, but less specific m/z 569 fragment on a nominal mass system (A). Narrowing the XIC width to isolate the high-resolution masses acquired on an accurate mass system mass-resolved the target PFDoA from interferences with masses outside the extraction window (B).
Matrix interference is even more problematic for analytes lacking a secondary transition such as PFBA and PFPeA. This can be partially remediated by monitoring for transitions specific to the suspect interference, such as those reported for PFBA and PFPeA in shellfish and chocolate.12,13 However, a targeted approach is challenged by the lack of a comprehensive list of potential interferences. The National Institute of Standards and Technology (NIST) is currently leading an ongoing effort to curate the PFAS Interferents List (PIL);14 however, some interferences may not produce additional fragments. HRMS is often necessary to provide secondary confirmation of PFBA and PFPeA detection based on well-established identification guidelines.7
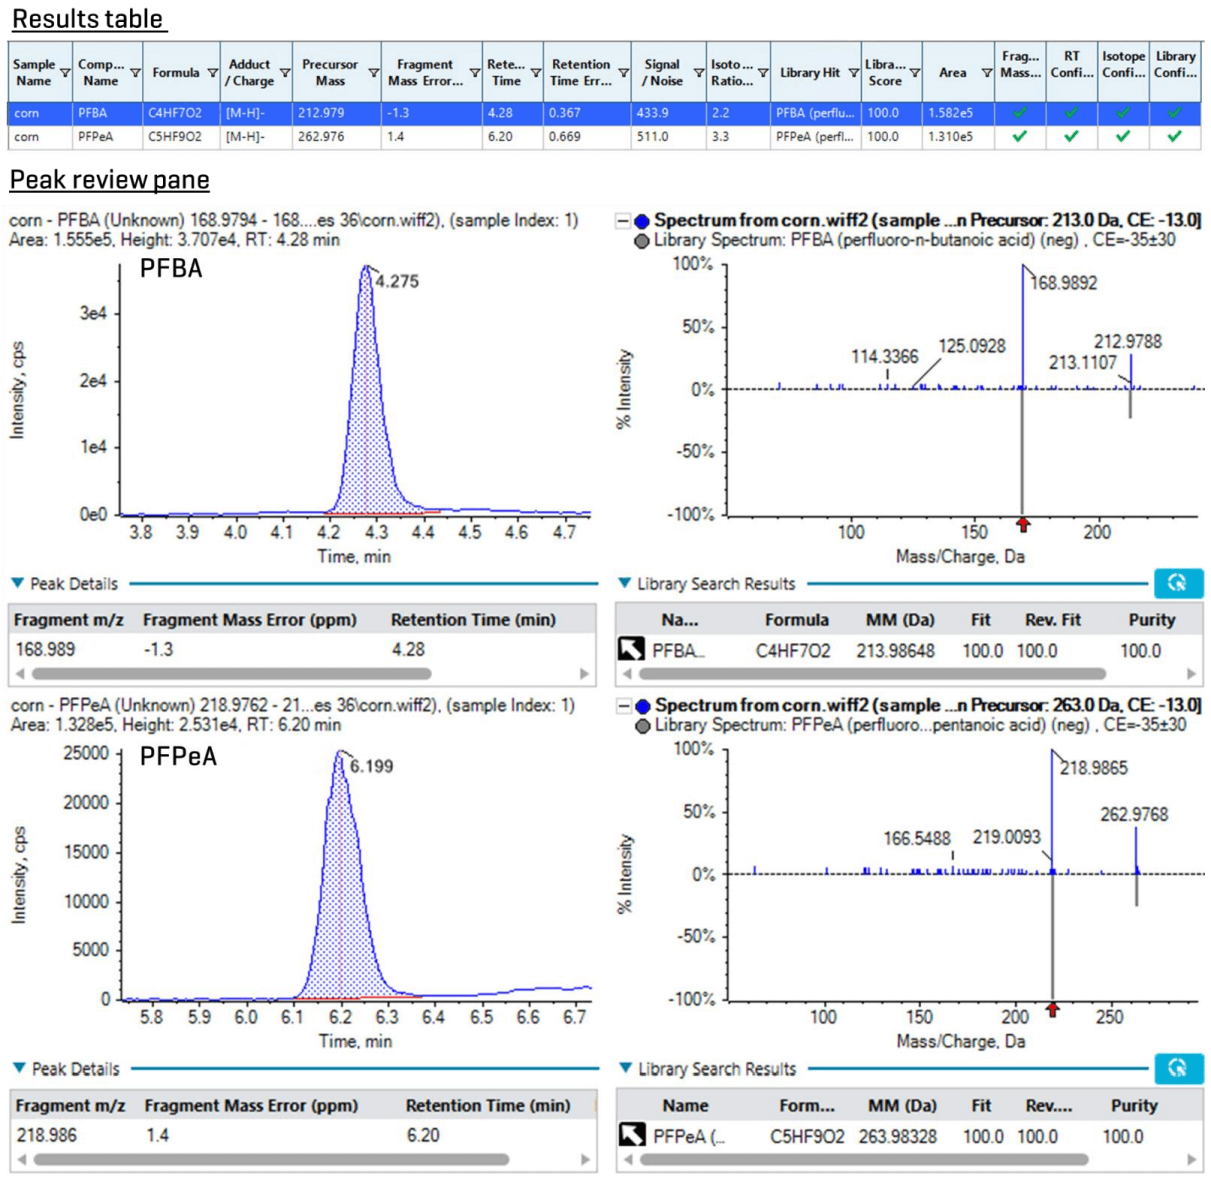
Figure 1 demonstrates XICs of the high-resolution fragment masses for PFBA and PFPeA in a 0.5 µg/kg corn snaplage spike on the ZenoTOF 7600 system. When acquired on a nominal mass system, the same sample exhibited significant matrix interferences. The ZenoTOF 7600 system provides additional confirmation criteria, including mass error (<5 ppm), S/N (≥3), retention time (RT) difference, isotope ratio difference and MS/MS library hit scores for more confident identification (Figure 4).
Figure 4. Qualitative results for the confirmation of PFBA and PFPeA in a 0.5 µg/kg corn snaplage spike in SCIEX OS software. The results table (top) contains identification parameters, such as mass error, RT, S/N, isotope ratio difference and library hit scores, which can be filtered and sorted to expedite data review. The bottom shows the XIC and MS/MS spectra for simultaneous review of peak integration for quantitation and MS/MS fragments for qualitative identification.
Sensitivity of the ZenoTOF 7600 system
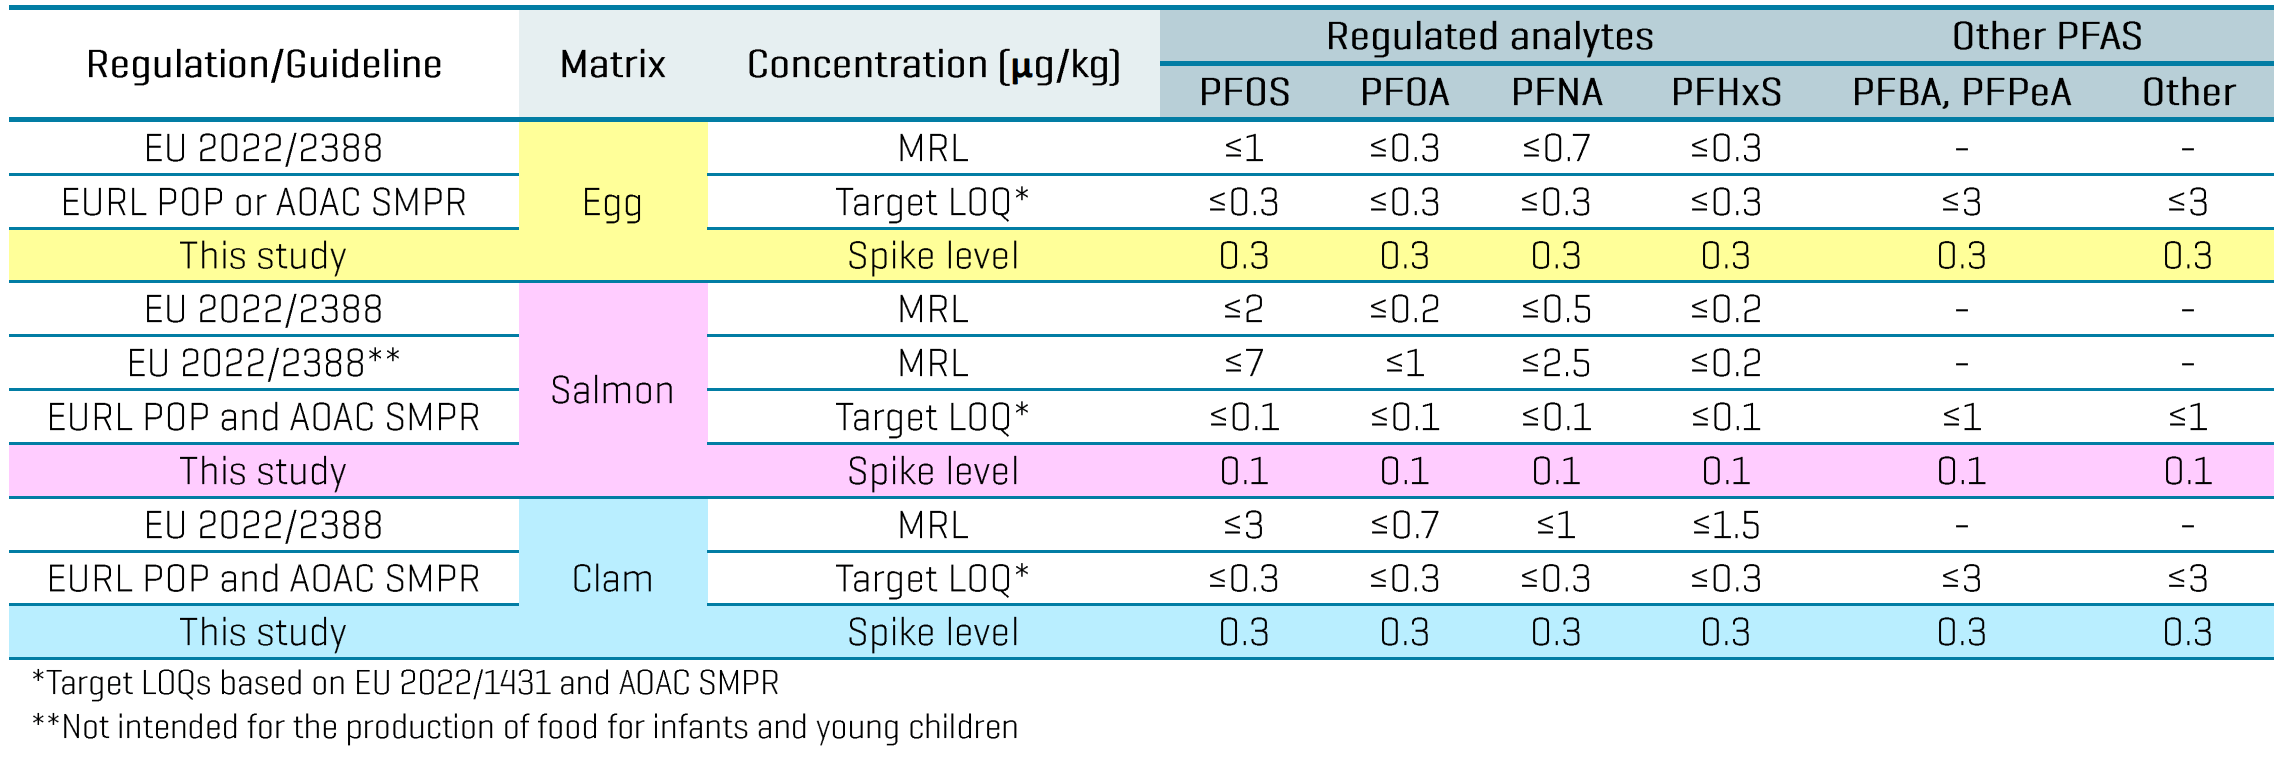
The high sensitivity of the ZenoTOF 7600 system enabled a small injection volume of 3 µL and the use of solvent-based calibration to minimize the matrix load on the instrument. The in-vial LOQs ranged from 0.01 to 0.2 ng/mL based on a single replicate injection of the calibration curve (Table 3). LOQ selection was based on the lowest concentration achieving signal-to-noise (S/N) ratio ≥10, calibration accuracy of ±30% and ion ratio tolerance of ±30%. Linear regression of r2 ≥0.99 was achieved for most analytes using the solvent-based calibration. Triplicate injections of a 1 ng/mL standard also exhibited good calibration accuracy (±20%) and precision (%CV ≤15%). Back-calculation of the solvent LOQs through the sample preparation steps resulted in an approximation of the in-sample LOQs at 0.02–0.4 ng/g. While further experiments are necessary to validate these LOQs in matrix, they highlight the sensitivity potential of the ZenoTOF 7600 system to meet the EU MRLs for PFOS, PFOA, PFNA and PFHxS and the target LOQs listed in the EU recommendation 2022/1431 and AOAC SMPR (Table 4).5-8
Table 3: Quantitative performance at the LOQ and at the midpoint level of 1 ng/mL in the calibration standards in solvent. All analytes are listed with their in-vial LOQ and LOQ accuracy, accuracy and precision from triplicate injections of a 1 ng/mL standard and the linearity, r2.
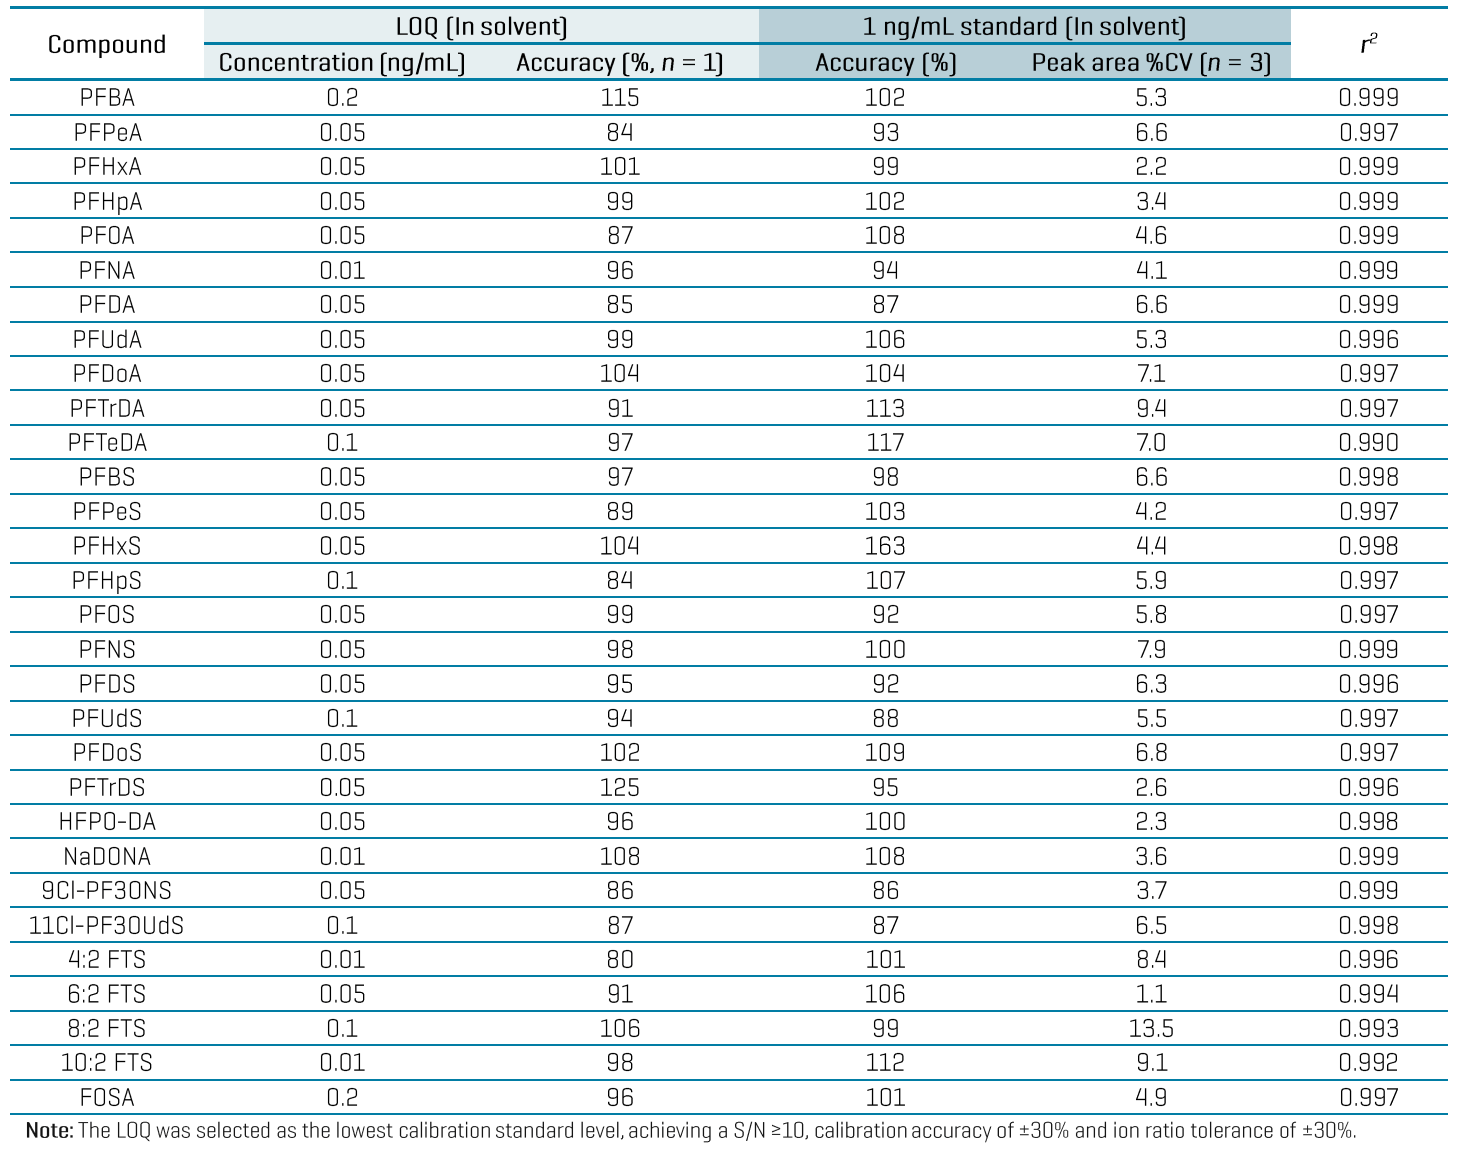
Table 4: Comparison of EU MRLs and target LOQs established by food authorities (EURL POPs and AOAC) against the spiking levels tested in 3 food matrices in this study
Method recoveries in matrix
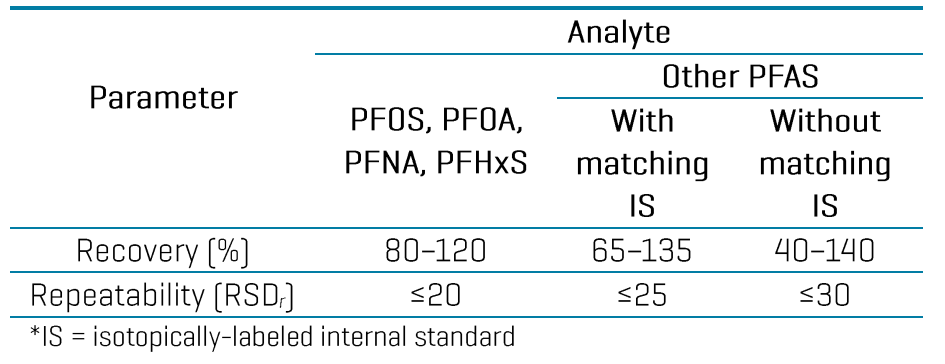
Method performance was assessed by triplicate matrix spikes in egg (0.3 µg/kg), salmon (0.1 µg/kg) and clam (0.3 µg/kg). Figure 5 highlights the recoveries achieved and whether they met the recovery and repeatability (RSDr) criteria in the EURL POPs guidance document7 and AOAC SMPR6 (Table 5).
Figure 5. Recoveries of PFAS in EU-regulated food matrices achieved using the ZenoTOF 7600 system. Data represent the recoveries with standard error bars based on triplicate (n = 3) matrix spikes in egg (0.3 µg/kg), salmon (0.1 µg/kg) and clam (0.3 µg/kg). The different analytes are separated into A, B and C based on different recovery and RSDr criteria established: (A) the 4 PFAS with regulated MRLs, (B) other PFAS with isotopically-labeled internal standards and (C) PFAS without isotopically-labeled internal standards. The horizontal dotted lines represent the different ±recovery tolerance for each, while analytes that did not pass either or both of the recovery and RSDr criteria are indicated by a red asterisk. PFBA recoveries were excluded due to significant matrix effects observed.
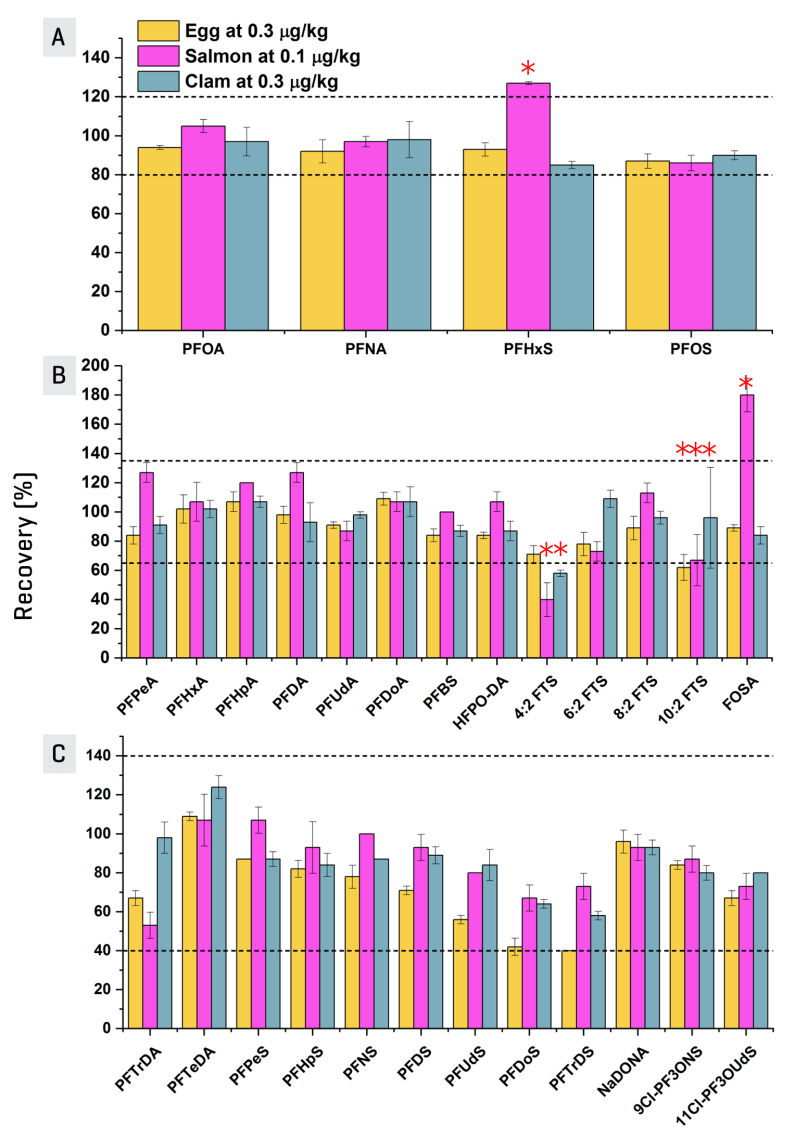
Table 5: Recovery and repeatability criteria for PFAS in food
Out of the 90 analyte/matrix combinations tested, only 10 fell outside of either or both acceptance criteria, as indicated by the red asterisk in Figure 5. Combined with the solvent LOQs achieved, these results are promising for using the ZenoTOF 7600 system for PFAS quantitation in food.
Conclusions
- Leveraging HRMS: The ZenoTOF 7600 system provides additional specificity for minimizing the risk of false positives and quantitative bias for PFAS in the presence of food interferences.
- Resolving chromatographic interferences: Co-eluting food interferences were mass-resolved by using narrow extraction windows to isolate the accurate masses of the target PFAS.
- ZenoMRMHR sensitivity: The ZenoTOF 7600 system enabled sensitive quantitation at sub-ng/mL LOQs using a small injection volume of 3 µL and solvent-based standards.
- Accurate and reproducible method performance: Matrix spikes in EU-regulated food matrices demonstrated acceptable recovery and repeatability for most of the target PFAS, meeting the criteria set in the EURL POPs guidance document and AOAC SMPR.
References
- Genauldi, S. et al. Analyte and matrix method extension of per- and polyfluoroalkyl substances in food and feed. Anal. Bioanal. Chem. 2024, 416, 627-633.
- Theurillat, X. et al. An LC-MS/MS method for the quantitative determination of 57 per- and polyfluoroalkyl substances at ng/kg levels in different food matrices. Food Addit. Contam.: Part A. 2023, 40, 862-877.
- Butt, C.M. et al. Reducing PFAS interferences during human plasma and serum analysis with accurate mass spectrometry. SCIEX technical note. 2021. RUO-MKT-02-13393-A.
- SCIEX. Qualitative flexibility combined with quantitative power. SCIEX technical note. 2021. RUO-MKT-02-13053-B.
- Commission Regulation (EU) 2022/2388 of 7 December 2022 amending Regulation (EC) No 1881/2006 as regards maximum levels of perfluoroalkyl substances in certain foodstuffs. Official Journal of European Union, Document 32022R2388.
- Commission Recommendation (EU) 2022/1431 of 24 August 2022 on the monitoring of perfluoroalkyl substances in food. Official Journal of European Union, Document 32022H1431.
- EURL for halogenated POPs in Feed and Food (2024): Guidance Document on Analytical Parameters for the Determination of Per- and Polyfluoroalkyl Substances (PFAS) in Food and Feed, version 2.0 of 10 September 2024.
- AOAC International (2023): Standard Method Performance Requirements (SMPRs) for Per- and Polyfluoroalkyl Substances (PFAS) in Produce, Beverages, Dairy Products, Eggs, Seafood, Meat Products, and Feed. AOAC SMPR 2023.003.
- Bangma, J. et al. PFAS ghosts: how to identify, evaluate, and exorcise new and existing analytical interference. Anal. Bioanal. Chem. 2024, 416, 1777-1785.
- Benskin, J.P. et al. Simultaneous characterization of perfluoroalkyl carboxylate, sulfonate and sulfonamide isomers by liquid chromatography-tandem mass spectrometry. Anal. Chem. 2007, 79, 6455-6464.
- Young, W. et al. Analysis of per- and poly(fluoroalkyl) substances (PFASs) in highly consumed seafood products from U.S. markets. J. Agric. Food Chem. 2022, 70, 13545-13553.
- Bangma, J. et al. Analytical method interferences for perfluoropentanoic acid (PFPeA) and perfluorobutanoic acid (PFBA) in biological and environmental samples. Chemosphere. 2023, 315, 137722.
- Genauldi, S. et al. Analysis of per- and poly-fluoroalkyl substances (PFAS) in processed foods from FDA’s Total Diet Study. Anal. Bioanal. Chem. 2022, 414, 1189-1199.
- Rodowa, A.E. et al. Per- and polyfluoroalkyl (PFAS) Interferents List. 2023. National Institute of Standards and Technology. https://data.nist.gov/od/id/mds2-3040
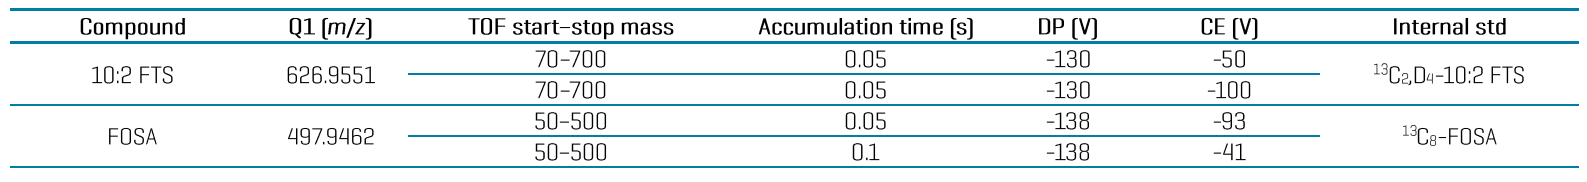
Table 6: Compound-specific MRMHR parameters and internal standard assignment for PFAS analysis in food using the ZenoTOF 7600 system.
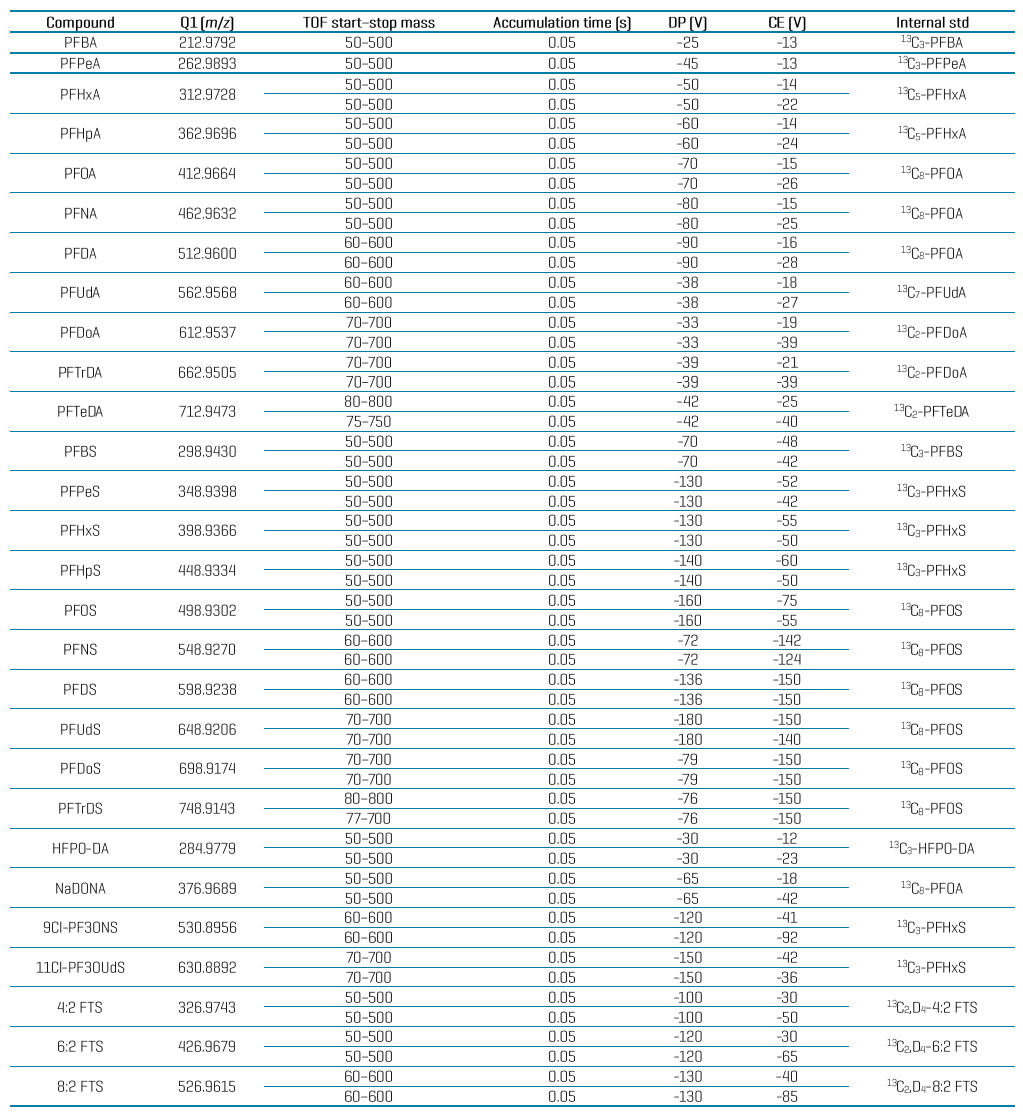
Table 6 (cont’d): Compound-specific MRMHR parameters and internal standard assignment for PFAS analysis in food using the ZenoTOF 7600 system.