Quantification of lipids by flow injection analysis and differential mobility spectrometry
Shotgun lipidomics using a SCIEX Triple Quad 6500+ system and Shotgun Lipidomics Assistant (SLA) software
Kevin J. Williams1, Baolong Su1, Rebekah Sayers2 and Mackenzie Pearson3
1 Department of Biological Chemistry at UCLA; 2SCIEX, UK, 3SCIEX, USA
Abstract
Flow injection analysis of lipids has been an established method for decades, but suffers from extensive isobaric overlap and the need for data tools to properly annotate and quantify the lipid species. Utilizing the SelexION+ device on the SCIEX Triple Quad or QTRAP 6500+ system to provide class based separation without chromatographic separation provides a high-throughput solution for lipid analysis. Partnered with SLA software for data visualization and transformation, this beginning to end solution provides users with the necessary tools to be successful in their lipid labs.

Introduction
Properly investigating, quantifying, visualizing, and reporting changes in the lipidome is an arduous undertaking in any laboratory. Bottlenecks exist in assay development, method deployment and proper data transformation and visualization and there are few complete solutions that provide lipidomic analyses that alleviate these bottlenecks.
Flow injection analysis (FIA) for profiling lipidomic changes has been an established workflow for many decades. Initially, precursor ion scans (PIS) or neutral loss scans (NLS) were utilized to monitor for the loss of headgroups or fatty acids. Without additional separation, the amount of isobaric overlap between lipid classes can lead to high numbers of false positive or false negative identifications. To avoid these errors, the data must be annotated, which can be an overwhelming process without proper software. As the technology has advanced, the increased speed of quadrupoles has enabled more MRMs per injection, reducing the time required for data analysis. Today, targeted methods with thousands of MRMs are used to monitor specific lipids. Despite these advancements, isobaric overlap remains a challenge to achieving accurate identifications.
Differential mobility spectrometry (DMS) adds an orthogonal dimension of separation to the flow injection workflow.1,2 The SelexION+ device sits in front of the orifice of the mass spectrometer at atmospheric pressure. The planar design allows for modifier introduction to induce a dipole moment of the lipid molecules which provides class-based separation that is independent of the shape or size of the molecule. This separation effectively reduces the amount of isobaric overlap between lipid classes.
Partnering this technology with Shotgun Lipidomics Assistant (SLA) software facilitates a simplified and updated workflow to investigate and quantify the lipidome of any matrix. SLA software provides SelexION+ device tuning, compensation voltage (COV) determination and a system suitability test to benchmark the instrument. It also performs data analysis and transformation and provides tools to visualize results.3 This third-party software provides acquisition flexibility and the confidence in data analysis that users require for their lipidomic research.
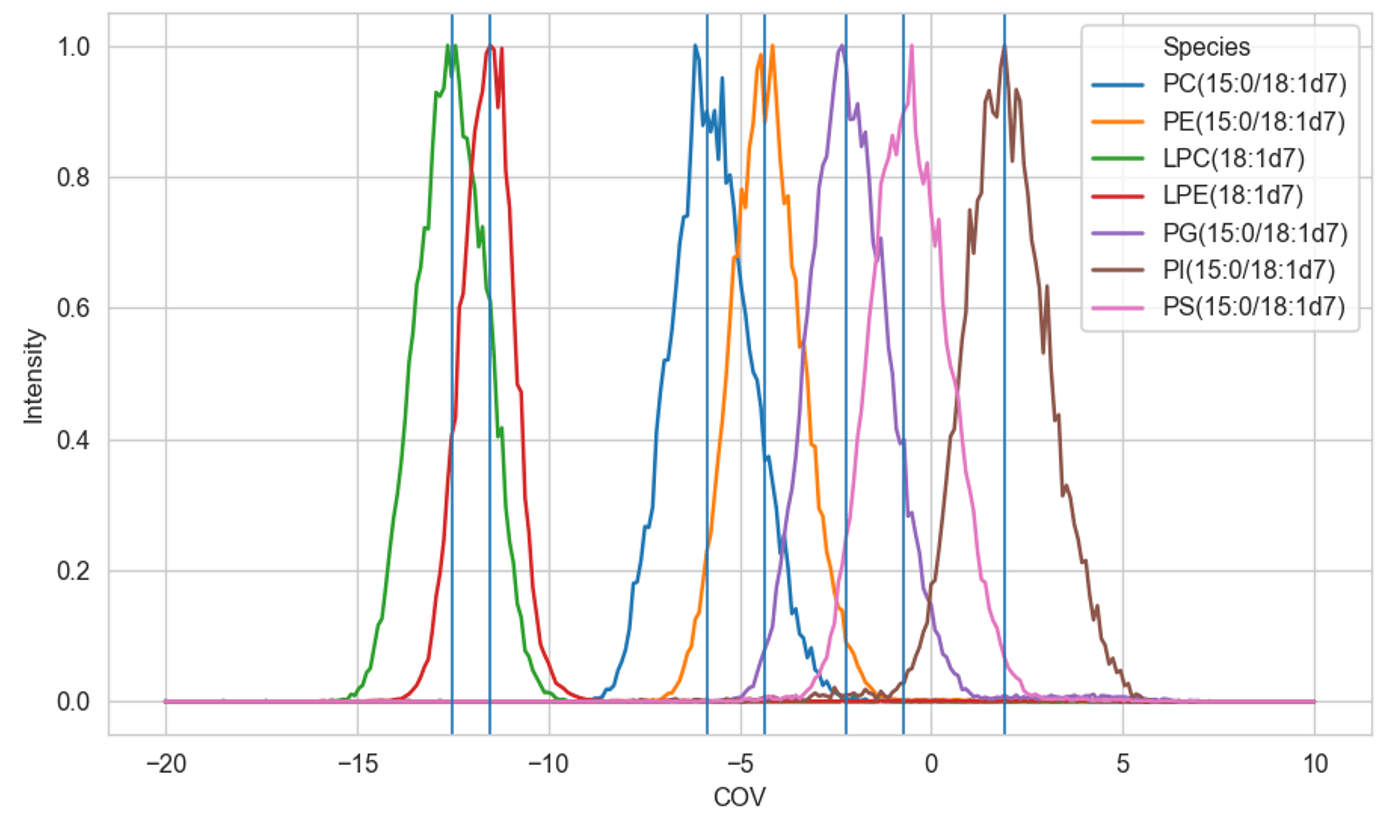
Figure 1. Optimization of COV values using SLA software. EquiSPLASH was used to optimize COV values. These COV values were then generated for each MRM in the assay. Values were pasted directly into Analyst software.
Key features of the FIA lipidomic workflow
- SelexION+ device achieves separation of phospholipid classes to reduce isobaric overlap
- SLA software provides flexibility to add or remove lipid classes and species and includes over 1400 lipid MRM transitions
- Standard operating procedure (SOP) is provided to facilitate easy implementation
- Ability to run any matrix for lipidomic profiling
- Improved quantification results using Lipidyzer and UltimateSPLASH internal standards
- SLA software provides 6 data tables, TG class analysis and data visualization to simplify data analysis and improve results turnaround time.
Methods
Sample preparation: EquiSPLASH standards were diluted in sample running solution (1:1 methanol/dichloromethane with 10 mM ammonium acetate) at a 1:50 concentration. A 1 mL syringe was used to infuse the standard for COV value optimization.
The Lipidyzer System Suitability LOD mixture was diluted 1:20 in sample running solution. Avanti standards were added to this mixture to enable coverage of all phospholipid subclasses, as defined in the protocol.8
NCI-H1299 cells (ATCC, CRL-5803) were passaged in RPMI 1640 with 10% FBS and PenStrep. For the experiment, 2 million cells per 15 cm dish (20 dishes total) were seeded in RPMI with 2% FBS + PenStrep and allowed to settle for 24 hours. Cells were then treated with 100nM SCD inhibitor (Cayman Chemical PN: 10012562) or vehicle (DMSO) for 24 hours. For collection, cells were trypsinized and resuspended in PBS. Cells were treated with trypan blue stain and counted with Nexcelom Cellometer K2 in bright field mode. Cells were diluted to a concentration of 2 million cells/mL and 0.1, 0.2, 0.4 and 0.8 mL aliquots were pipetted into glass vials, resulting in samples containing between 200,000 and 1,600,000 cells. Triplicate samples were collected for each, resulting in a total of 24 samples analyzed, including vehicle and SCDi-treated cells. The volume of each was brought up to 0.8 mL with PBS before freezing down for consistency in extraction.
Chromatography: An ExionLC system was used for the flow injection setup. A flow rate of 8 µL/min was used for the elution of a 70 µL injection volume. The sample running solution used for mobile phase and sample diluent and was was 1:1 methanol/dichloromethane with 10 mM ammonium acetate.
Mass spectrometry: A SCIEX Triple Quad 6500+ system with the IonDrive Turbo V ion source was used. The ion source was equipped with a 65 µm electrode to improve %CVs at this low flow rate. The SelexION+ device was installed and 1-propanol was used as the modifier. More details on the LC-MS conditions can be found in the protocol.8
Data processing: Data were collected using Analyst software version 1.7.1. Data were then processed using the SLA software available on GitHub.
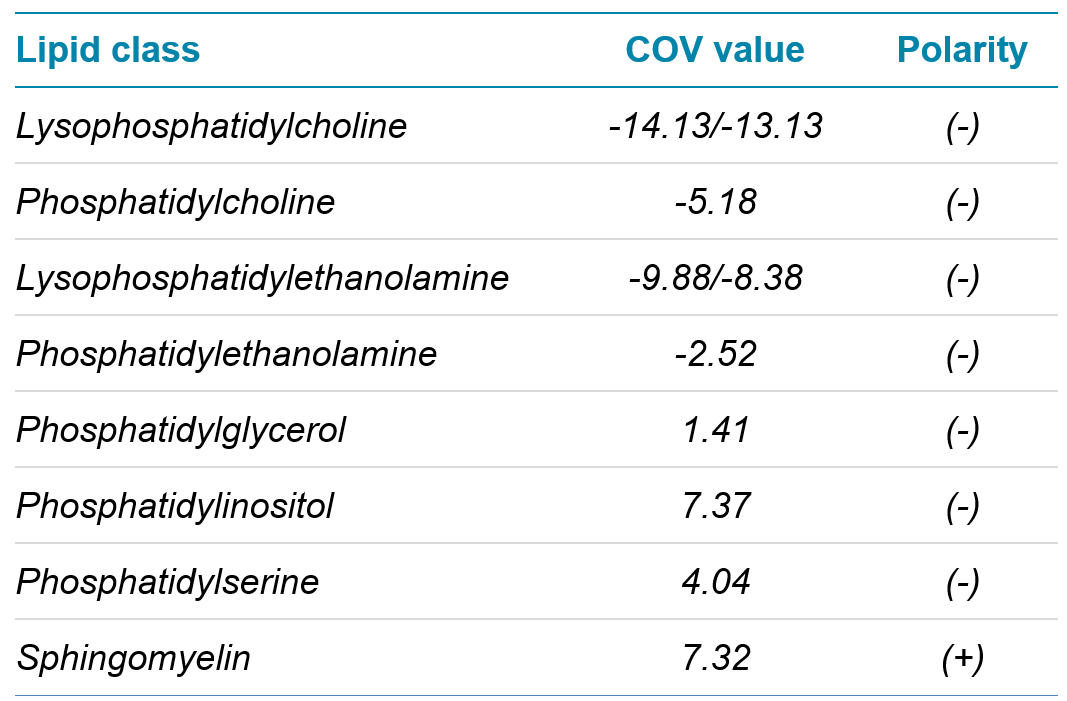
Table 1. COV values. Values found in SLA software and updated in MRM table for analysis.
Optimization of COV values
The COV values provided by the SelexION+ device need to be optimized at the beginning of each run to ensure proper separation of each lipid subclass. A SelexION+ device tuning mix made of diluted EquiSPLASH mix is used to ramp through a range of COV values. The labeled standards provide unique transitions for each lipid subclass. Additional lipid subclasses can be added to the platform by purchasing standards for lipid classes of interest to find a class-specific COV value.
Figure 1 shows the negative ion mode COV ramp as it is visualized in SLA software. Each phospholipid subclass has a unique COV value but the ability to baseline resolve varies between subclasses. SLA software can overcome a lack of baseline resolution by allowing the manual selection of COV values to gain selectivity.
After COV values have been chosen for each lipid subclass of interest, these values are exported into the directory generated by the SLA software. These values can then be copied and pasted directly into the MRM table in Analyst software. The COV values chosen for this experiment are displayed in Table 1.
System suitability test
The System suitability test (SST) was designed to ensure that the proper COV values were picked for each phospholipid subclass and to benchmark the sensitivity of the instrument over time. An MRM list is provided to cover the lipid subclasses present in the Lipidyzer SST mix and the extended panel that is supported by the current platform and can be purchased from Avanti Polar Lipids.
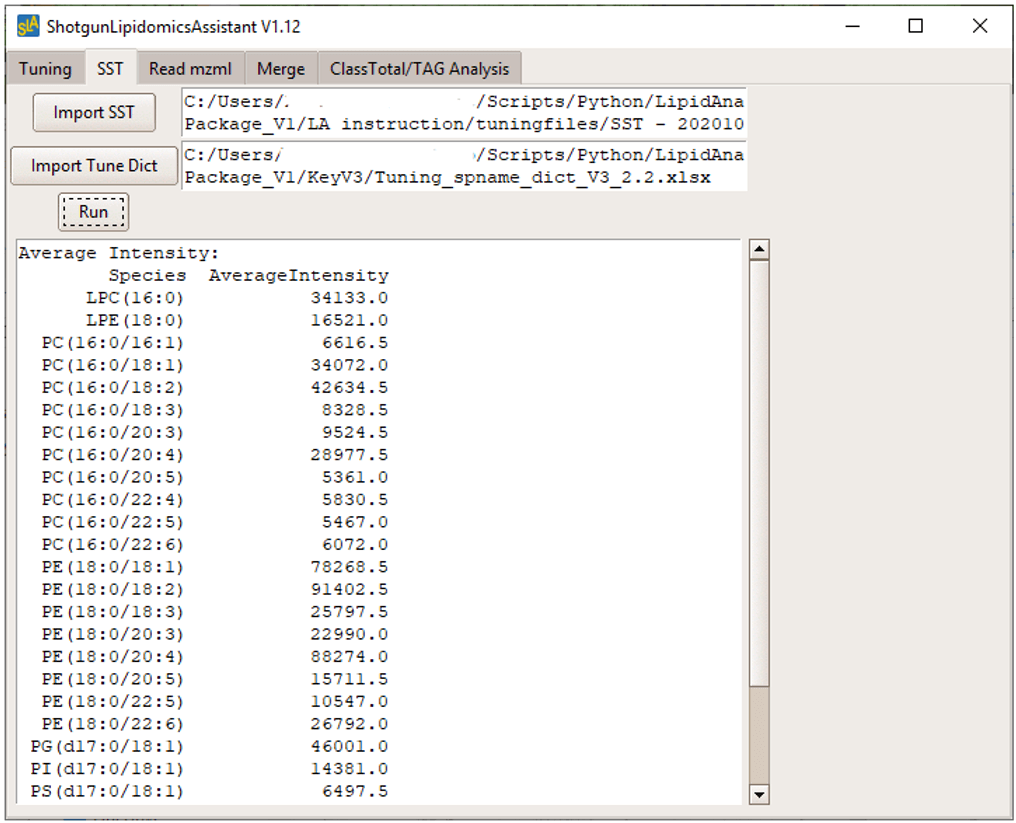
After injecting the LOD sample on the system, data were analyzed in the SLA software. Figure 2 shows the output generated by the software. The average peak intensity for each lipid species in the MRM list was calculated. It is recommended to copy and paste these values in an Excel spreadsheet to track and compare SST values over time.
Figure 2. SST output. After running the LOD mixture, SLA software calculated the average intensities for each lipid specified in the tuning dictionary.
Method implementation
The platform supports the analysis of 17 lipid subclasses that include more than 1400 lipid species. Figure 3 displays the lipidome coverage by lipid class. Two methods were used to analyze the lipid subclasses. Method 1 was implemented with the SelexION+ device turned on, whereas method 2 was implemented with the SelexION+ device in transparent mode. Method 1 was used to analyze the LPC, PC, LPE, PE, PG, PI and PS lipid subclasses in negative ion mode and the SM lipid subclass in positive ion mode. Method 2 was used to analyze the TG, DG, CE, CER, DCER, HexCER, LacCER and PA lipid subclasses in positive ion mode and the FFA lipid subclass in negative ion mode. Total runtimes per sample was 25.4 mins, when both method 1 and 2 were used.
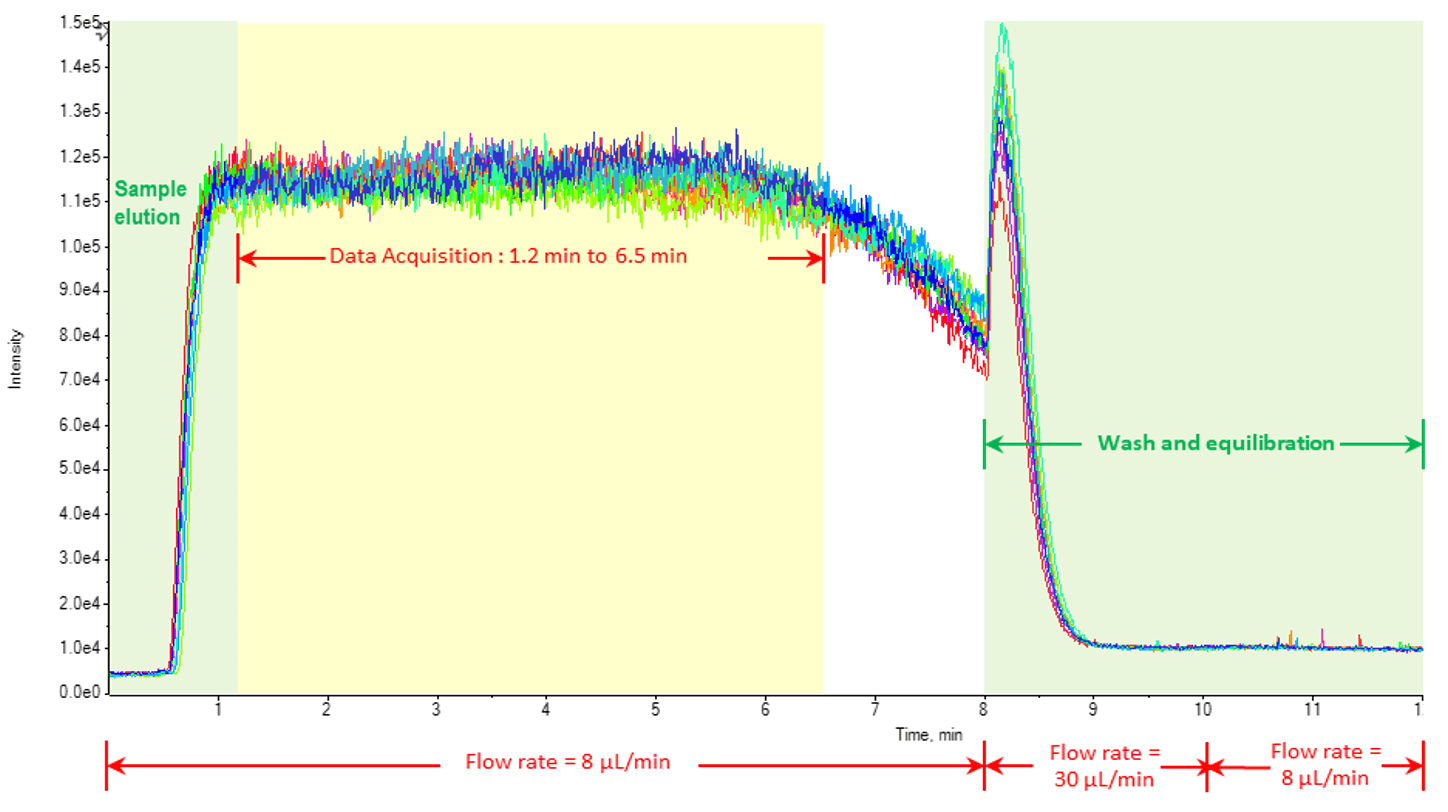
The flow injection analysis method was optimized on an ExionLC system with a flow rate of 8 µL/min. Peeksil tubing with a 50 µm inner diameter was used along the entire flow path to minimize carryover, reduce the elution time of the sample and improve the %CVs of replicates. The sample running solution was 1:1 methanol/dichloromethane with 10 mM ammonium acetate to assist with the ionization of neutral lipids in the positive ion mode and the formation of acetate adducts for PC in the negative ion mode. A 65 µm electrode was used in the IonDrive Turbo V ion source to further improve %CV values of replicates. This setup provided robust, reproducible injections to maintain accuracy and stability over the course of the run (Figure 4).
Figure 3. Number of transitions by lipid subclass. Each lipid class is represented by the number of transitions. Numbers include any internal standards or duplicates needed for deisotoping the data.
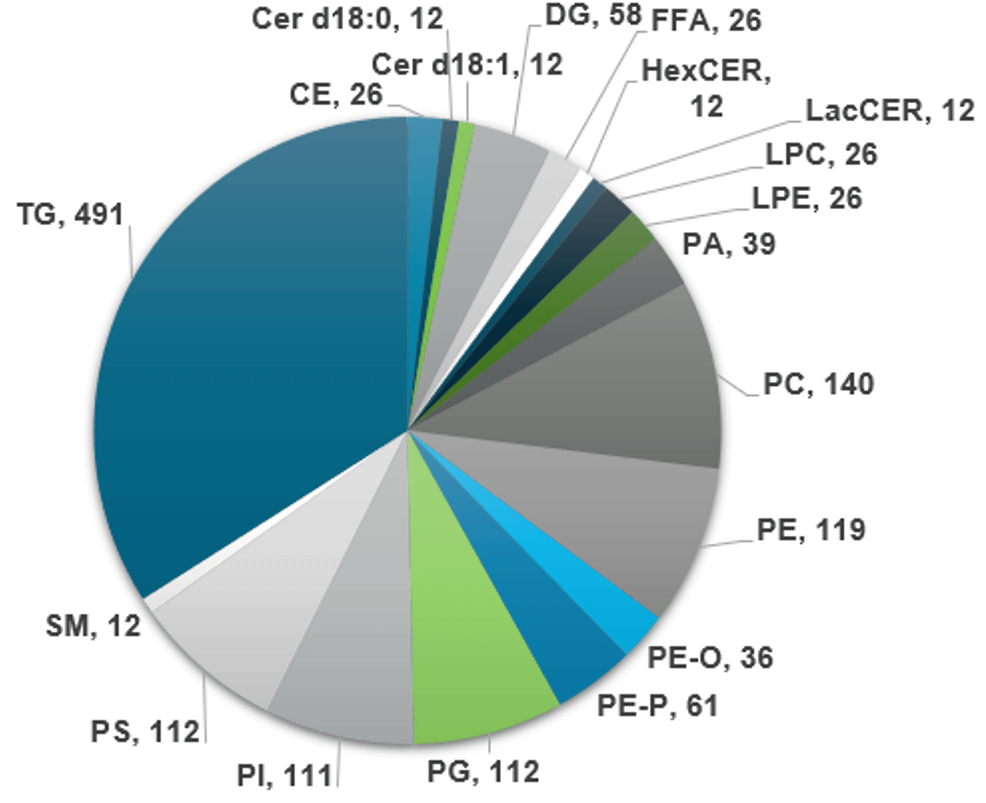
Figure 4. Reproducibility of flow injection analysis. The elution program of the flow injection analysis is shown for a 50 µL sample injection volume. After sample elution, data acquisition began and 20 cycles of the flow injection were collected. After completion of 20 cycles for all MRMs, a wash cycle and equilibration occurred to clean the line and equilibrate the pumps back to 0.008 µL/min. |
Quantification strategy and data analysis
Absolute quantification is not possible for large lipid panels due to the limited availability of labeled standards for all endogenous lipids. A single internal standard has historically been used for each lipid subclass, but due to unequal fragmentation based on the carbon length and number of double bonds in the lipid species, the relative concentrations of these lipid species can be skewed depending on the internal standard used. If several internal standards are provided for each lipid class to cover a broad range of acyl chain lengths and degrees of desaturation, a level of accuracy can be regained. The Lipidyzer internal standards are a panel of carefully curated standards to support accurate quantification.4 However, there are some lipid classes not contained in the kit and these can be supplemented with UltimateSPLASH standards. This approach provides less than 10% bias for each lipid class in the panel.4
After data acquisition in Analyst software, SLA software was utilized for all data analysis. A tutorial is available on GitHub that provides full instructions for how to use the software.6,7 Briefly, a sample map file is built to provide a directory for the software. This directory provides group information and any normalization data, if needed. After data files are converted to mzMLl files, they are uploaded and 6 data tables are created.
These 6 tables display the concentrations and compositions of lipid species, lipid classes and free fatty acids. An additional TG summary plot is provided to take a deeper look at this class. For each sample, each given carbon length or double bond number are summed together and then reported in their own data table.
Analysis of cell extracts
NCI-H1299 cells were analyzed at 200K, 400K, 800K and 1.6M cell counts. There were 3 biological replicates for each cell count and each was treated with and without Stearoyl Co-A Desaturase inhibitor (SCDi). The SCD enzyme plays an integral role in the conversion of saturated fatty acids to their monounsaturated fatty acid counterparts by adding a double bond. Figure 5 shows the increased concentrations in saturated fatty acids and decreases in concentrations of the SCDi-treated cells with monounsaturated fatty acids in a range of lipid species.
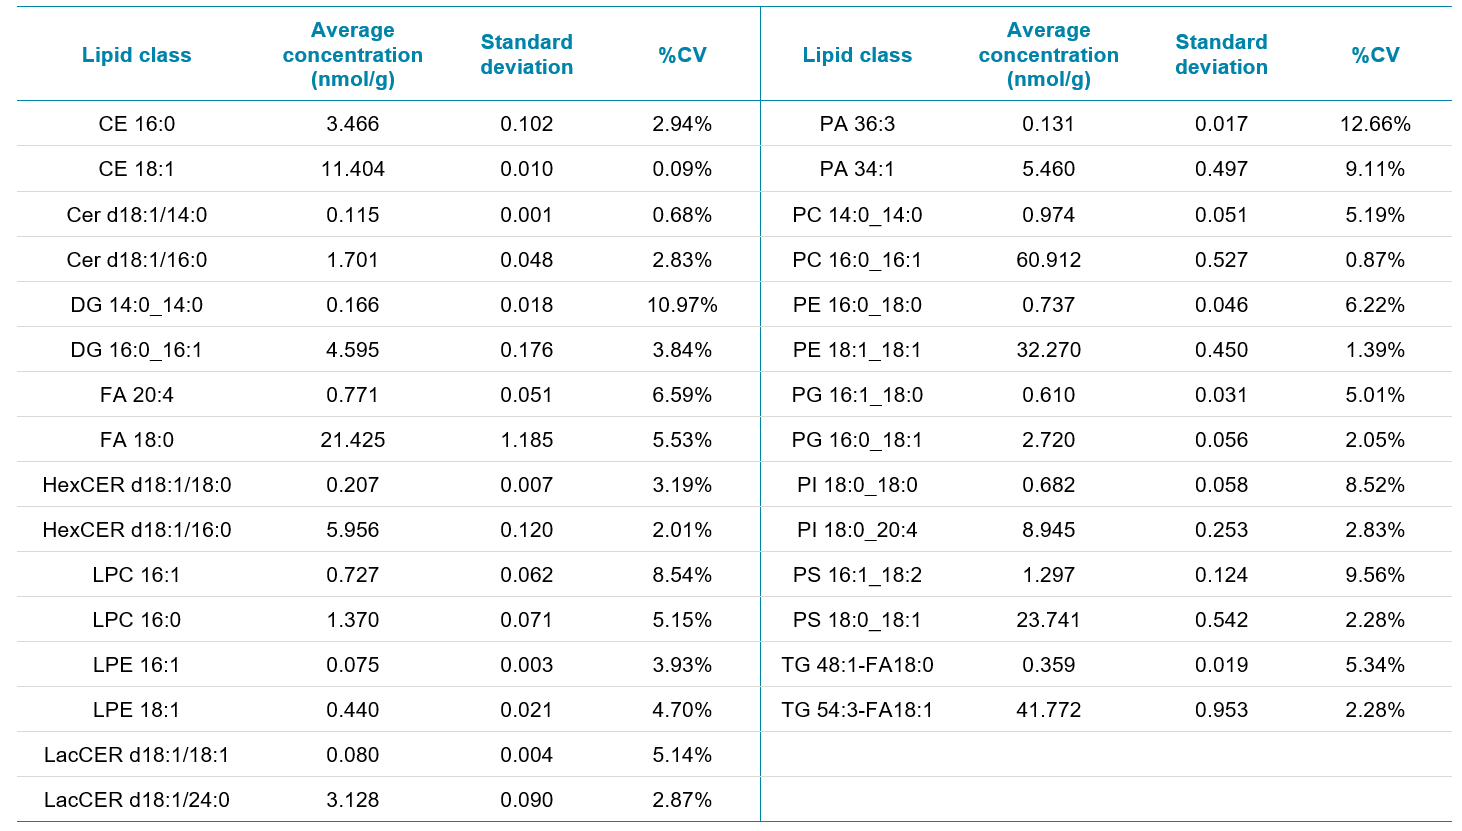
To demonstrate the robustness and reproducibility of the DMS-FIA workflow, a low abundant species and a relatively abundant species were picked from each lipid subclass analyzed using the platform. The average concentrations for the non-treated 200K cell count and %CVs of each lipid species are displayed in Table 2. Note that even with low- or sub-nmol/g concentrations, the %CVs reported were lower than 10%. Phosphatidic acid (PA) is often a difficult lipid subclass to analyze either by direct infusion or chromatographic methods. The high %CVs for this subclass could be due to several factors and any changes in this class should be further investigated with optimal extraction protocols and methods.
Figure 5. Analysis of lipid species with and without SCDi treatment. A subset of lipid species was taken from several lipid classes to investigate the change from saturated to monounsaturated fatty acids. In CE, DG, LPC and LPE lipid subclasses, the SCDi-treated cells showed a marked increase in the concentrations reported at all cell counts. For PC, PE, PI, PS and TG subclasses, a species was chosen that contained all monounsaturated fatty acids.
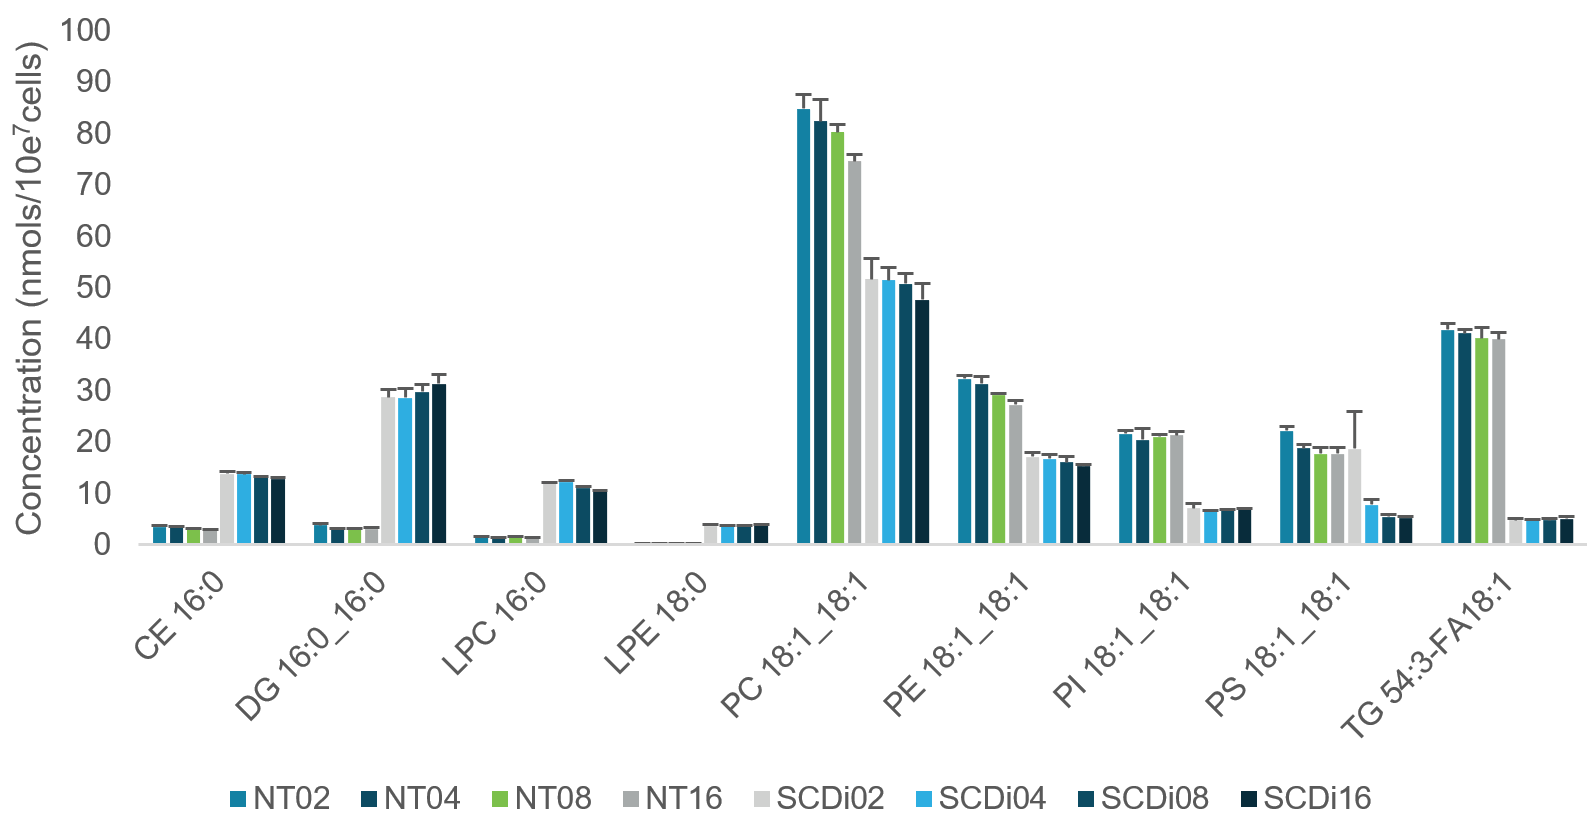
Table 2. Reproducibility of lipid species. A low abundant and a relatively high abundant species from each lipid class were chosen to demonstrate the reproducibility of the method.
Conclusions
- DMS-FIA analysis provided a robust solution to profile and quantify over 1400 lipid species in 2 injections
- With a total runtime of 25.4 minutes for both analyses, the DMS-FIA method provided a high-throughput solution
- SLA software provided the tools necessary to update the methods with COV values and to benchmark the instrument performance
- Determining changes in the lipidome at the level of lipid species, class or fatty acid was streamlined using the data transformation and visualization tools from SLA software
- Lipid class separation provided by the SelexION+ device reduced isobaric interferences and improved confidence in lipid identification and quantification.
References
- Duchoslav E, Campbell JL, Ekroos K. (2014) Differential mobility spectrometry-driven shotgun lipidomics. Analytical Chemistry. 2014 Oct 7;86(19):9662-9.
- Differential mobility separation for improving lipidomic analysis by mass spectrometry. SCIEX technical note, RUO-MKT-4802-A.
- Su B, Bettcher LF, Hsieh WY, Hornburg D, Pearson MJ, Blomberg N, Giera M, Snyder MP, Raftery D, Bensinger SJ, Williams KJ. (2021) A DMS Shotgun Lipidomics Workflow Application to Facilitate High-Throughput, Comprehensive Lipidomics. J Am Soc Mass Spectrom. 32(11):2655-2663.
- Novel chemical standards kits enable facile lipid quantitation. SCIEX technical note, RUO-MKT-02-3879-B.
- Ghorasaini M, Mohammed Y, Adamski J, Bettcher L, Bowden JA, Cabruja M, Contrepois K, Ellenberger M, Giera M, et al. (2021) Cross-Laboratory Standardization of Preclinical Lipidomics Using Differential Mobility Spectrometry and Multiple Reaction Monitoring. Analytical Chemistry. 93(49):16369-16378.
- Shotgun Lipidomics Assistant. – download software and instructions from Github.
- Su B, et al. (2021) A DMS Shotgun Lipidomics Workflow Application to Facilitate High-Throughput, Comprehensive Lipidomics. J. Am. Soc. Mass Spectrom. 32(11), 2655–2663.
- SHOTGUN LIPIDOMICS WITH DIFFERENTIAL ION MOBILITY SEPARATION: A comprehensive targeted method for flow injection analysis of lipids - Using the SCIEX 6500+ series systems or SCIEX 5500+ system and SelexION device. SCIEX technical note RUO-MKT-02-14428-A.