Abstract
This technical note demonstrates a sensitive method for the quantitation of LRRK2 in human CSF using triple quadrupole mass spectrometry. The method uses a Stable Isotope Standard Capture by Anti-peptide Antibody (SISCAPA) sample preparation methodology. A lower limit of quantitation (LLOQ) of 10 pg/mL was achieved in human CSF (Figure 1).
Introduction
Parkinson's disease is the second-most common neurodegenerative disorder, affecting millions worldwide. It is characterized by symptoms such as tremors, stiffness, slowed movements and impaired balance.1-3 While the exact cause of Parkinson's remains unknown, both genetic and environmental factors are believed to contribute to its development. Research has shown mutations in the gene encoding LRRK2 to be one of the most common causes of the disease. The ability to detect and quantify LRRK2 protein in human CSF will be a crucial companion diagnostic to a therapy that might modulate disease state and protein levels.
This technical note presents a reliable and highly sensitive workflow to support the routine quantitative analysis of LRRK2 protein using the SCIEX 7500 system coupled with the M5 MicroLC system.
Key features for the analysis of LRRK2 protein using the SCIEX 7500 system coupled with the M5 MicroLC system
- Low pg/mL level of quantitation: Achieve 10 pg/mL LLOQ for quantitation of LRRK2 protein in human CSF
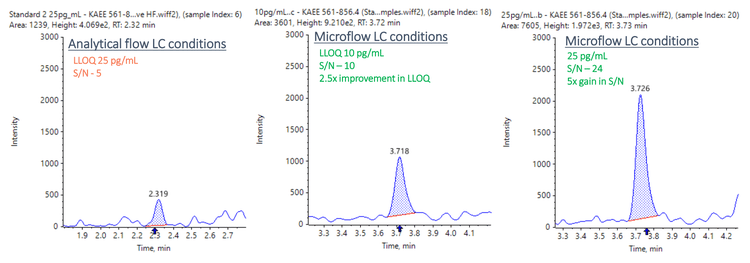
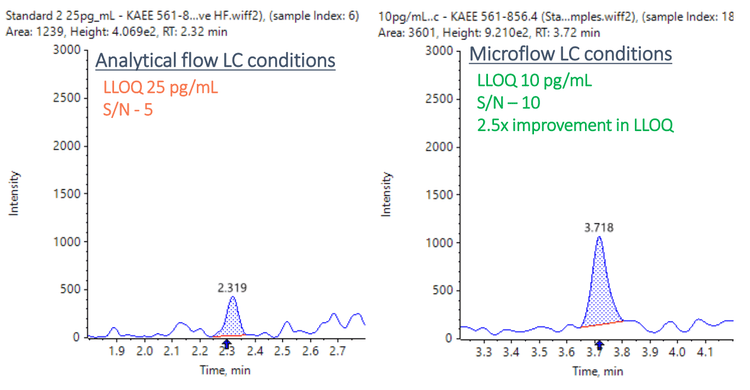
- Enhanced sensitivity: Achieve a 2.5-fold improvement in LLOQ and a 5-fold improvement in signal-to-noise (S/N) using the M5 MicroLC system compared to conventional analytical flow conditions
- Lower solvent consumption: The trap-and-elute workflow uses up to 50x less solvent than the analytical flow method, resulting in significant cost savings, waste reduction and a more sustainable solution
- Robust analytical performance: Achieve accurate quantitative performance with %CV <10% at all concentration levels across a linear dynamic range (LDR) of 3 orders of magnitude
- Streamlined data management: Data acquisition and processing are simplified with SCIEX OS software, a 21 CFR Part 11-compliant platform
Methods
Sample preparation: Calibration standards were prepared at concentrations ranging from 10–10000 pg/mL by serially diluting recombinant LRRK2 protein (rLRRK2) using 0.1% BSA in 1X PBS as a surrogate matrix. A total of 1 mL of standard samples, human CSF samples and blanks were first treated with radioimmunoprecipitation assay (RIPA) buffer. Digestion was performed using trypsin for 90 minutes at 40°C with shaking. After digestion, SIL synthetic peptide was spiked into the samples to serve as an internal standard (IS).
Immunoaffinity extraction was performed on the digests using anti-peptide antibody-coated magnetic beads to capture the signature peptide, KAEEKAEEGDLLVNPDQPR (KAEE peptide), used for quantitative analysis. Samples and beads were incubated at 4°C for 90 minutes on an end-over-end rotating mixer. After several washing steps, the KAEE peptide was eluted from the beads before LC-MS/MS analysis.1
Mass spectrometry: Samples were analyzed using the SCIEX 7500 system in MRM mode. The system was controlled by SCIEX OS software. The optimized MS parameters are listed in Table 1.


Quantitative performance
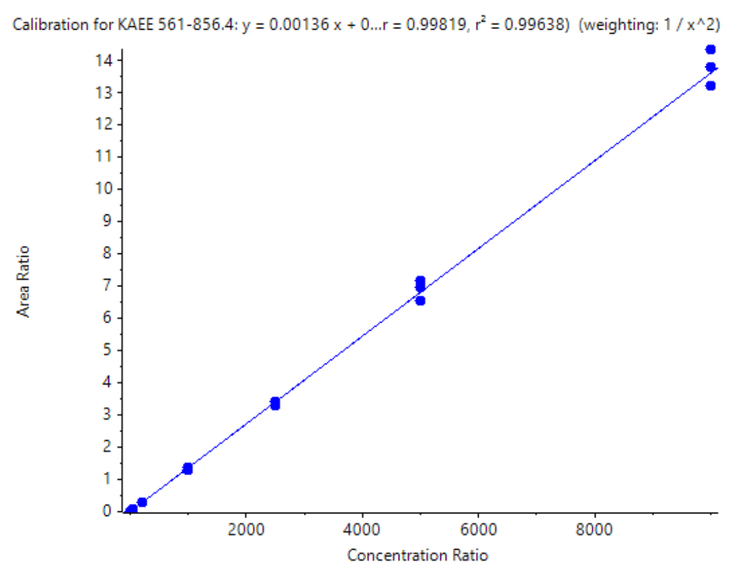
A calibration curve was analyzed for concentrations ranging from 10–10000 pg/mL. To evaluate reproducibility, each concentration was analyzed in triplicate.
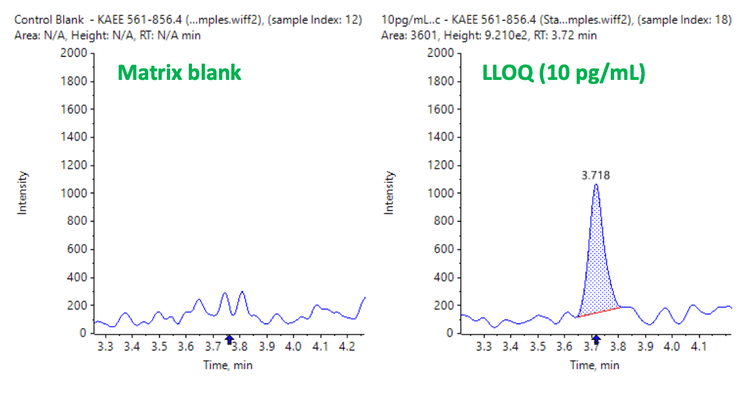
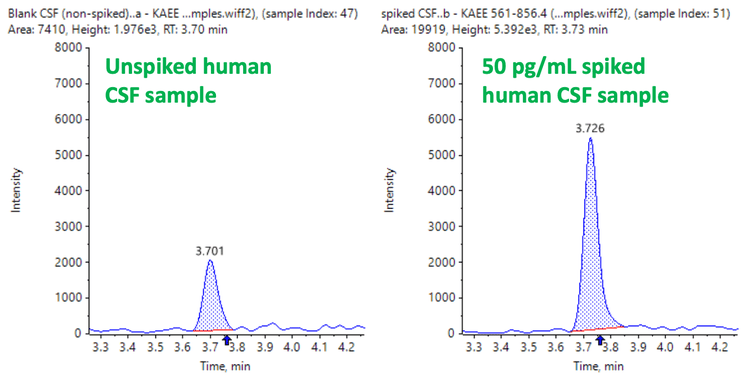
The LLOQ achieved for LRRK2 protein in human CSF was accurately measured at 10 pg/mL. No interferences were observed in the blank matrix (Figure 2).
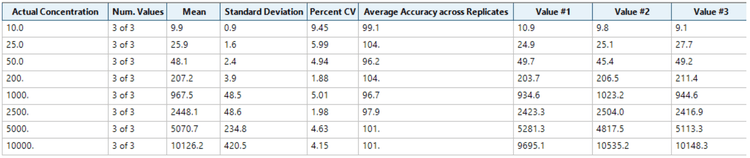
Analytical performance was evaluated based on the criteria that the accuracy of the calculated mean should be between 80% and 120% at the LOQ and between 85% and 115% at the higher concentrations. In addition, the %CV of the calculated mean of the concentration should be <20% at the LLOQ and <15% at all higher concentrations.
The assay accuracy was within ±4% of the actual concentration and the %CV was <10%. Calculated percent accuracy and %CV values were within the acceptance criteria at each concentration level (Figure 4).
Matrix equivalency
Since experiments were performed in the surrogate matrix, a matrix equivalency experiment was carried out to ensure quantitative performance aligns with the human CSF samples. Pooled human CSF samples were analyzed for their endogenous LRRK2 concentration and spiked with the known concentrations of LRRK2 protein used for calibration standards. The calculated concentrations for all spiked samples were within 10% of the theoretical post-spike concentrations. Results meet regulatory requirements and suggest good matrix equivalency and an absence of matrix effects (Table 3).

Enhanced sensitivity with the M5 MicroLC system
Matrix-extracted samples were also analyzed using analytical flow conditions at 0.4 mL/min using the Kinetex XB-C18 column (2.1 mm x 100 mm, 1.7 µm, 100 Å) with the same mobile phase conditions described in Table 2. Data were compared between the 2 systems. The results showed a 2.5- fold improvement in LLOQ and a 5-fold improvement in S/N using the M5 MicroLC system compared to conventional analytical flow conditions (Figure 6).
Compliance-ready SCIEX OS software
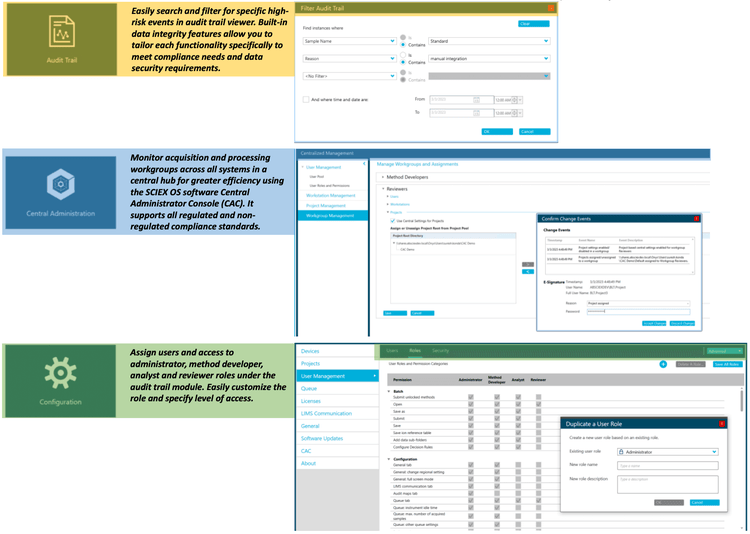
SCIEX OS software is a closed system and requires records and signatures to be stored electronically, meeting the regulations outlined in 21 CFR Part 11. SCIEX OS software can open raw data files from any visible storage location within a closed network by using designated processing workstations. Figure 7 illustrates the features of the SCIEX OS software for monitoring the audit trail, performing acquisition, processing data and configuring user access. The audit trail feature enables users to monitor high-risk events and evaluate the data integrity. The Central Administrator Console (CAC) feature allows users to centralize acquisition and processing in a single platform to enable higher efficiency for multi-instrument laboratories, whether for meeting regulated or non-regulated compliance standards. Using the configuration module, users can assign roles and access to the administrator, method developer, analyst and reviewer.
Conclusion
- An LLOQ of 10 pg/mL was achieved to quantify LRRK2 protein in human CSF samples using LRRK2-SISCAPA methodology
- Good linearity was achieved across concentrations ranging from 10–10000 pg/mL with an r2 of 0.996 and an LDR spanning 3 orders of magnitude
- Compared to conventional analytical flow conditions, a 2.5- fold improvement in LLOQ and a 5-fold improvement in S/N were achieved using the M5 MicroLC system. The improvement in sensitivity could allow for a more robust assay in which smaller volumes can be injected with improved limits of quantitation.
- Accurate and highly reproducible quantitative performance was demonstrated at all concentration levels with a %CV <10%
- Matrix equivalency between the surrogate and authentic matrices was achieved with no significant matrix effects observed
- Up to 50x lower solvent consumption was achieved with the microflow method using a trap-and-elute setup compared to an analytical flow method. Minimizing LC-MS-grade solvent consumption increases cost savings, reduces waste generation and promotes an eco-friendly option.
- The assay exhibited the ability to routinely quantify low levels of LRRK2 protein with a 10-minute runtime, enabling bioanalytical labs to deliver high-quality data with good throughput
References
- Mabrouk, Omar S., et al (2020). Quantitative Measurements of LRRK2 in Human Cerebrospinal Fluid Demonstrates Increased Levels in G2019S Patients. Frontiers in Neuroscience 14.
- Cabezudo, Diego, et al (2020). Multiple-Hit Hypothesis in Parkinson's Disease: LRRK2 and Inflammation. Frontiers in Neuroscience 14.
- Goldman, Jennifer G., et al (2016). Parkinson’s disease. Encyclopedia of Mental Health, 2nd edition Volume 2 (242-248).