Abstract
This technical note demonstrates the comprehensive characterization and confident identification of glucuronide metabolites from hepatocyte incubations of midazolam. An orthogonal fragmentation mechanism was applied to generate diagnostic fragment ions for confident identification of glucuronide metabolites using EAD. Several key glucuronide conjugations were identified, including aromatic/aliphatic hydroxylation, o-glucuronide conjugation and N-dealkylated midazolam N-glucuronide. A streamlined workflow was developed to efficiently characterize and identify conjugated structures during drug metabolism studies using the ZenoTOF 7600+ system paired with Mass-Metasite software for data reduction.
Introduction
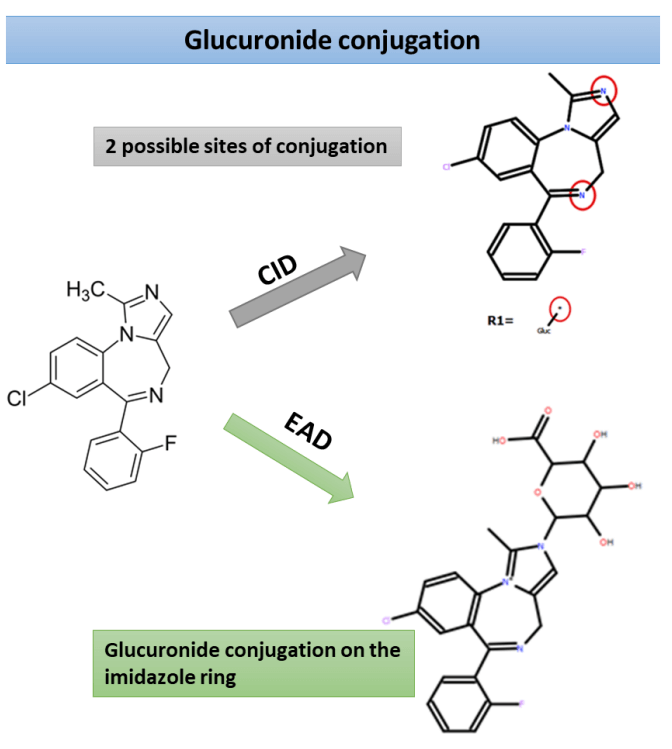
Glucuronide conjugation can be challenging to characterize thoroughly by MS/MS alone, as the glucuronic acid bond is often labile, both in the ionization source and the collision cell of mass spectrometers.3 One of the significant challenges when implementing a soft-spot analysis approach is the ability to produce data promptly in alignment with the pace of the drug discovery process. This technical note demonstrates a quick and robust soft-spot identification procedure using a novel orthogonal fragmentation mechanism, EAD, on the ZenoTOF 7600+ system (Figure 1). Sites of midazolam glucuronide conjugation were predicted using Mass-MetaSite software. Structural determination was performed using unique EAD fragments.
Key features for metabolite identification using the ZenoTOF 7600+ system
- Comprehensive characterization and confident identification: Achieve comprehensive characterization and identification of glucuronide metabolites from hepatocyte incubations of midazolam using the ZenoTOF 7600+ system.
- Site-specific identification: Acquire diagnostic fragments to easily identify the site of metabolism for glucuronide metabolites with EAD. EAD is the only non-CID/HCD fragmentation mechanism that works well on singly charged molecules.
- Detection of low-level metabolites: Identify all critical metabolites present in drug metabolism studies with enhanced MS/MS sensitivity provided by the Zeno trap.
- Streamlined data processing: Develop confident structuremetabolic stability relationships for drug products utilizing a quick, easy-to-use methodology from acquisition to analysis.
Drug metabolism characterization is essential for optimizing pharmacokinetics (PK), pharmacodynamics (PD) and safety profiles of drug candidates in the drug discovery and development process. Drugs must reach the site of action to elicit their pharmacological effects after administration. If results indicate inferior PK properties—such as high clearance, short half-life (t1/2) and/or low bioavailability—PD effects will likely be sub-optimal. In vitro metabolism studies in human and animal tissue preparations are valuable for identifying major metabolism pathways.1
Glucuronidation is the most critical phase II metabolic pathway responsible for clearing many endogenous and exogenous compounds. In addition to being an essential detoxification mechanism for structurally diverse drugs, glucuronidation also leads to a short duration of action and loss of pharmacological activity. The prediction of glucuronidation is crucial for the earlystage characterization of drug clearance properties in humans to improve PK results.2
Methods
Sample preparation: Midazolam was incubated at 37°C in human hepatocytes at a starting concentration of 5 µM. Samples were removed from incubation and quenched with acetonitrile at 0-, 30-, 60-, 90-, 120- and 240-minute intervals.
Chromatography: LC separation was performed on a Phenomenex Kinetex Polar C18 column (2.1 x 100 mm, 2.6 µm, 100 Å) at a column temperature of 40°C. Mobile phase A was 0.1% (v/v) formic acid in water and mobile phase B was 0.1% (v/v) formic acid in acetonitrile. An injection of 5 µL was subjected for analysis.
The chromatographic gradient conditions are summarized in Table 1.


EAD provides positional information on glucuronide conjugation sites
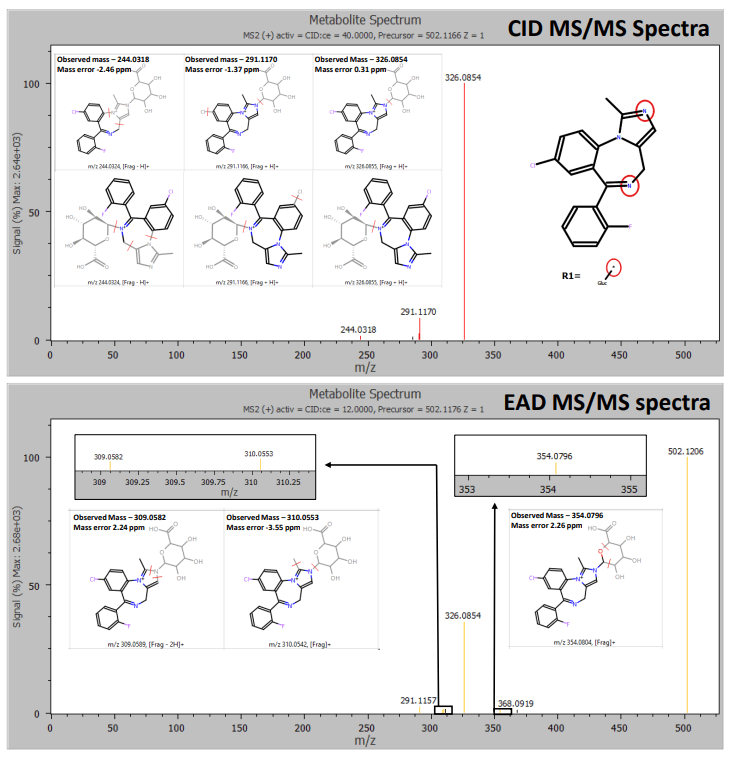
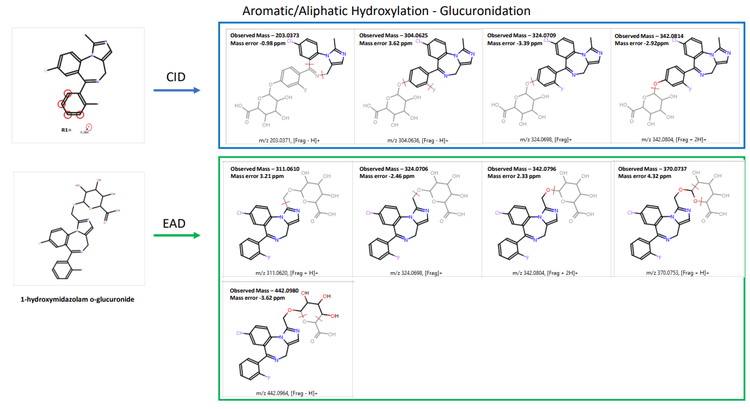
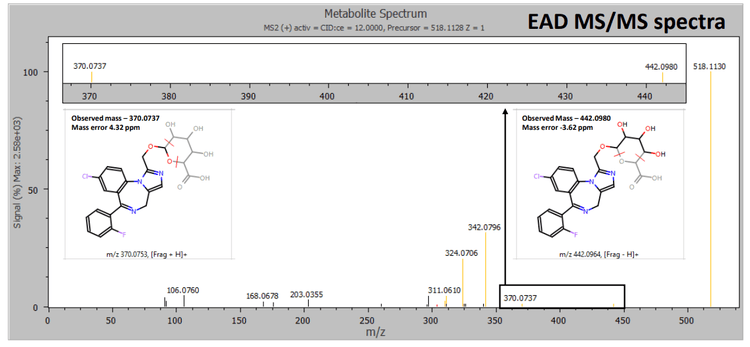
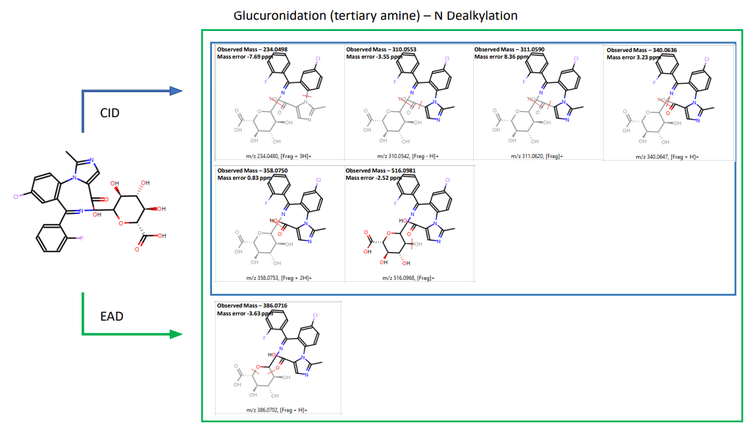
Zeno DDA data provided excellent MS/MS coverage for TOF MS peaks of interest in both CID and EAD acquisitions. MassMetaSite software automatically predicted the metabolites based on MS1 data and performed structural elucidation by comparing the precursor and metabolite-specific fragment ions. The 240- minute incubation sample showed a significant peak for midazolam N-glucuronide at a retention time of 4.21 minutes. Zeno CID DDA did not indicate any specific fragments for midazolam N-glucuronide (Figure 2). Instead, fragments from CID originated from the primary midazolam structure. The Mass-MetaSite software predicted 2 possible sites of metabolism with CID MS/MS spectra. EAD showed unique fragments at m/z 309.0582 and m/z 354.0796 and confirmed N-glucuronide conjugation on the imidazole ring. Another metabolite with aromatic/aliphatic hydroxylation and o-glucuronide conjugation was detected at a retention time of 4.40 minutes. Due to the absence of any glucuronide-specific fragments with CID, four possible sites of metabolism on the benzene ring of midazolam were predicted (Figure 3). EAD indicated metabolite-specific fragments at m/z 311.0610, m/z 324.0706, m/z 342.0796, m/z 370.0737 and m/z 442.0980.
Therefore, information from EAD enabled the identification of the peak as 1-hydroxymidazolam o-glucuronide (Figure 4). EAD provided rich MS/MS spectra, enabling the identification of an N-dealkylated midazolam N-glucuronide metabolite. EAD spectra included all fragments generated using CID along with a glucuronide-specific fragment at m/z 386.0716, confirming the site of conjugation (Figure 5).
The ZenoTOF 7600+ system demonstrated excellent mass accuracy for the workflow. All metabolites and fragments were identified with <10 ppm error. This enabled the confident identification of critical metabolites present in an in vitro metabolism study of midazolam. Furthermore, identification of all critical metabolites was easily performed with the improvement in MS/MS sensitivity provided by the Zeno trap on the ZenoTOF 7600+ system.
Gathering information on structure metabolism relationships is critical for developing chemical strategies for stabilization.10 This method demonstrates a robust soft-spot identification procedure for characterization and identification of glucuronide conjugates using EAD on the ZenoTOF 7600+ system coupled with Mass-MetaSite software.
Conclusion
- Comprehensive characterization and identification of critical glucuronide metabolites from hepatocyte incubations of midazolam were demonstrated on the ZenoTOF 7600+ system.
- Diagnostic fragment ions were used to identify the site of metabolism for several glucuronide metabolites using EAD.
- A highly sensitive workflow enables the detection of lowlevel metabolites and can be easily adapted for in vivo metabolism studies with the enhanced sensitivity provided by the Zeno trap.
- A streamlined data processing method was utilized for ease of data reduction and development of confident structuremetabolic stability relationships for drugs.
References
- Zhang, Z.; Tang, W. (2018). Drug metabolism in drug discovery and development. Acta Pharm Sin B. 8(5): 721-732.
- Hyland, R. et al. (2009). In vitro and in vivo glucuronidation of midazolam in humans. Br J Clin Pharmacol. 67(4): 445-54.
- Orthogonal fragmentation mechanism enables new levels of metabolite characterization, SCIEX technical note, RUO-MKT02-13348-A.
- Boon, B. et al. (2010). Enhanced metabolite identification with MS(E) and a semi-automated software for structural elucidation. Rapid Commun Mass Spectrom. 24(21): 3127-38.
- Zamora, I. et al. (2013). High-throughput, computerassisted, specific MetID. A revolution for drug discovery. Drug Discovery Today Technol. 10(1): e199-205.
- Strano-Rossi, S. et al (2014). Metabolism of JWH-015, JWH-098, JWH-251, and JWH-307 in silico and in vitro: a pilot study for the detection of unknown synthetic cannabinoids metabolites.Analytical and Bioanalytical Chemistry. 406(15): 3621-3636.
- Zelesky, V. (2013). Software automation tools for increased throughput metabolic soft-spot identification in early drug discovery. Bioanalysis, 5(10): 1165-1179.
- Li, A.C. (2013). Update on hydrocodone metabolites in rats and dogs aided with a semi-automatic software for metabolite identification Mass-MetaSite. Xenobiotica, 43(4): 390-398.
- Brink, A. et al. (2014). Post-acquisition analysis of untargeted accurate mass quadrupole time-of-flight MS(E) data for multiple collision-induced neutral losses and fragment ions of glutathione conjugates. Rapid Commun Mass Spectrom. 28(24): 2695-703.
- Ge, S; Tu, Y; Hu, M. Challenges and opportunities with predicting in vivo phase II metabolism via glucuronidation from in vitro data (2016). Curr Pharmacol Rep. 2(6): 326-338.