How Do I Display the Calibration Peak List in Analyst® Software?
| Date: | 11/01/2021 |
| Categories: | Analyst software |
For research use only. Not for use in diagnostic procedures.
Answer
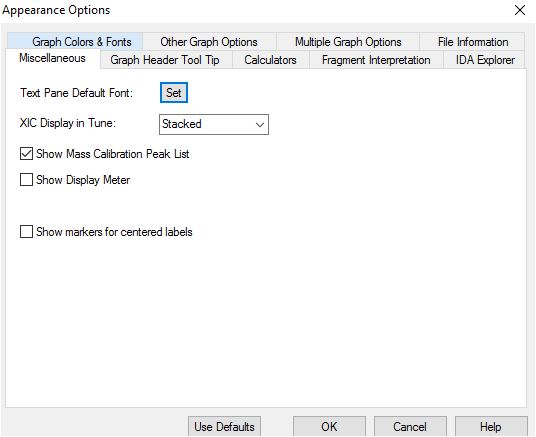
In Analyst® software, select the Tools menu, then Settings, and then Appearance Options. Click on the Miscellaneous tab in the Appearance Options screen. Check the box next to the option Show Mass Calibration Peak List.

The table will show the list of masses in the sample as well as the peak width for each.
After opening the acquired file, the spectrum will show the calibrant masses. In the spectrum, click with the right mouse and select List data. A table with three tabs at the top will appear. Right mouse click anywhere in the table, and the menu will show possible reference tables. Select the appropriate one and set it as a reference.
Posted: now