Comprehensive characterization of SARS-CoV-2 spike protein and its mutant by LC-MS/MS
Featuring the ZenoTOF 7600 system and Biologics Explorer software from SCIEX
Haichuan Liu1, Sibylle Heidelberger2, Rachel Rowlinson3, Raquel Faba3 and Zoe Zhang1
1SCIEX, USA;2SCIEX, UK; 3Peak Proteins, UK
Abstract
The comprehensive characterization of the acute respiratory syndrome coronavirus 2 (SARS-CoV-2) spike protein with complex mutation and glycosylation patterns using highly sensitive LC-MS/MS approaches is shown. The unique capabilities of the Zeno and electron activated dissociation (EAD) enabled confident confirmation of mutations, accurate quantification and localization of glycosylation and unambiguous differentiation of deamidation isomers.
Introduction
The spike protein of SARS-CoV-2 is the primary target for vaccine design, development of protein therapeutics and scientific research surrounding COVID-19. However, it is challenging to achieve comprehensive characterization of the protein due to its complex glycosylation patterns1, ever-evolving mutations and deamidations that may affect the function and molecular aging of the spike protein.2 Traditional peptide mapping workflows using CID struggle with localization of glycosylation and differentiation of amino acid isomers, such as aspartic acid (Asp) and isoaspartic acid (isoAsp), leading to incomplete characterization of these important quality attributes. By comparison, these challenges can be addressed using Zeno EAD.3-5 In this technical note, the highly sensitive data-dependent acquisition (DDA) method with EAD was employed to completely characterize the SARS-CoV-2 spike protein and its N501 mutant.
Key features of the ZenoTOF 7600 system for characterization of the spike protein
- Sensitive DDA method for obtaining high sequence coverage: Highly sensitive CID method using the Zeno trap provides >95% sequence coverage in 1 injection
- Powerful EAD for glycopeptide analysis: EAD is a proven tool for confident identification of glycopeptides and accurate localization of glycosylation
- Unique ability of EAD for differentiation of isomers: EAD possesses the unique capability of differentiating amino acid isomers, such as Asp and isoAsp
- Versatile tools for identification and characterization of mutation: The various mutation sites in SARS-CoV-2 spike protein can be confidently identified by CID and EAD methods with different characteristics in peptide fragmentation
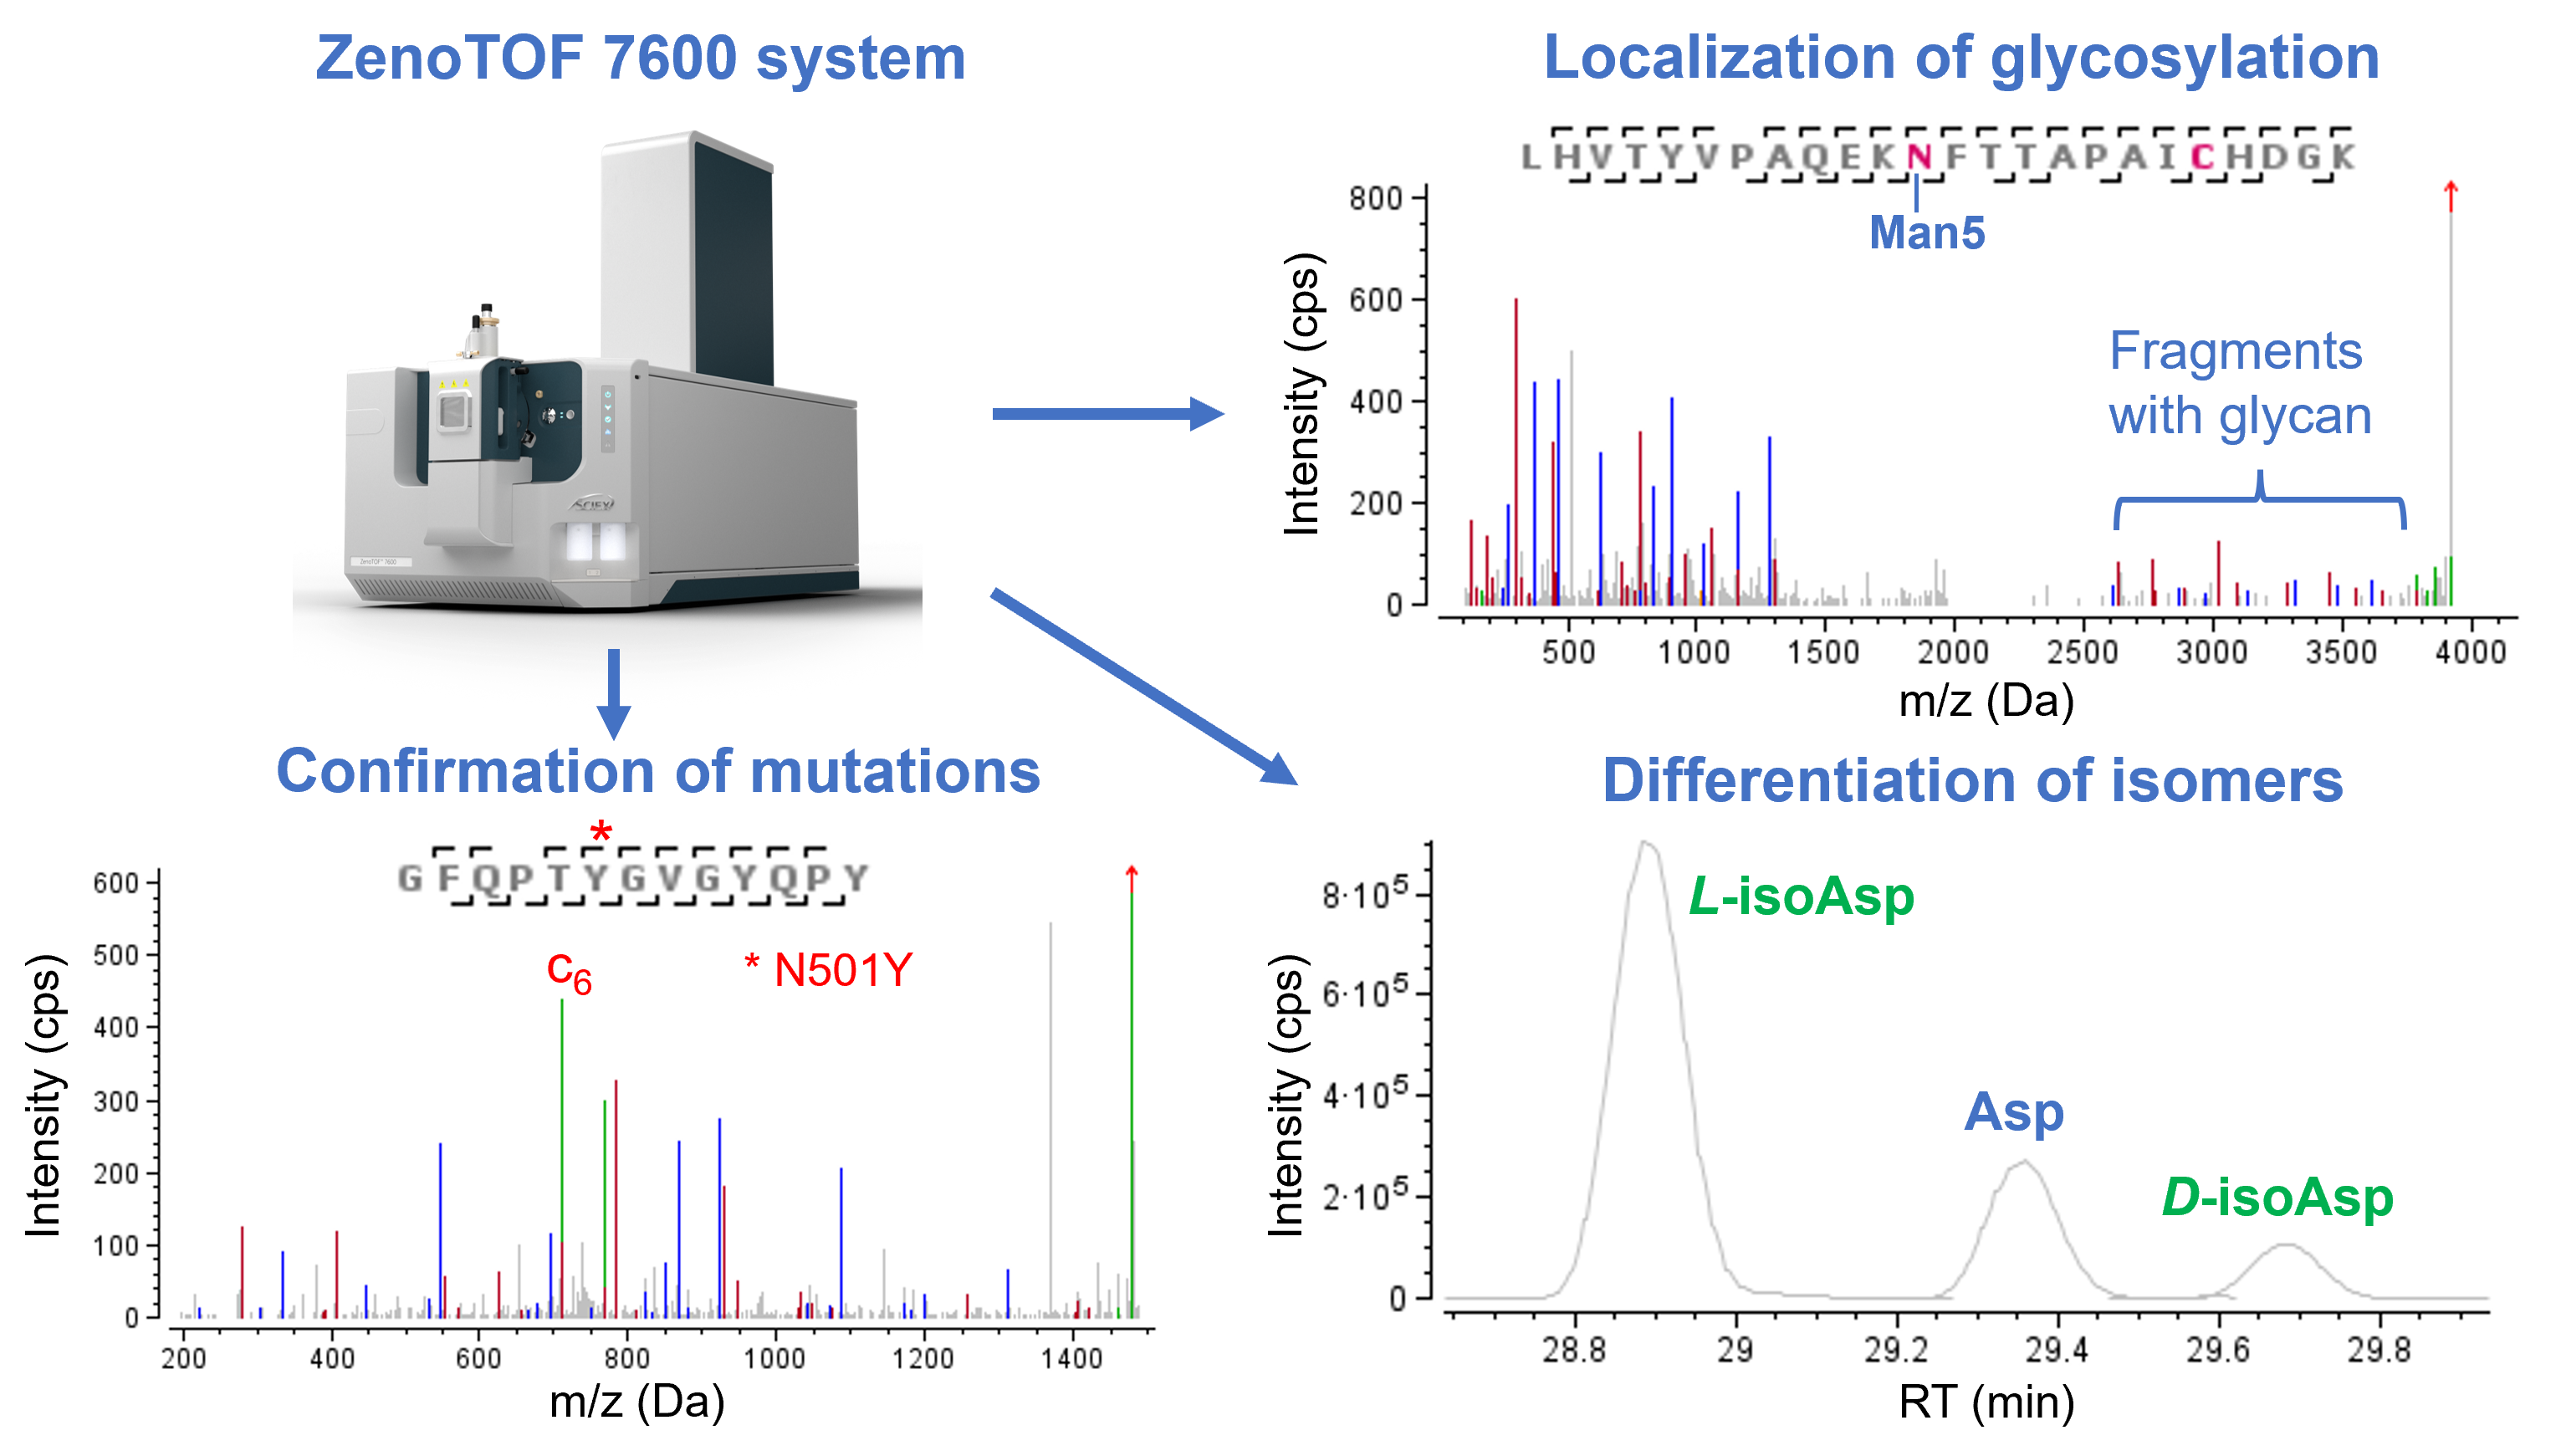
Figure 1. Overview of characterization of SARS-CoV-2 spike protein using the ZenoTOF 7600 system and Biologics Explorer software. The combination of Zeno CID and Zeno EAD methods led to high sequence coverage, confident identification of mutation sites, accurate localization of N- and O-linked glycosylation and unambiguous differentiation of amino acid isomers.
Methods
Sample preparation: The wild type (WT) and N501Y mutant forms of SARS-CoV-2 spike protein were expressed in a HEK293 system. The WT and N501Y proteins consist of amino acid residues 14-1213 with a T4 foldon trimerization domain and a histidine-tag at the C-terminus. An internal furin recognition site with the sequence of RRAR was substituted by GSAS to increase stability against proteases.6 In the commonly found N501Y mutant variant of SARS-CoV-2, the asparagine at position 501 was replaced by a tyrosine. The 2 protein samples (~50 µg in a concentration of ~0.8 mg/mL) were denatured using 8 M urea in 20 mM Tris-HCl (pH = 7.9), reduced at 37°C for 45 min with 20 mM dithiothreitol (DTT) and alkylated in the dark at room temperature with 100 mM iodoacetamide. Subsequently, trypsin and chymotrypsin were added in a ratio of 1:10 (enzyme:protein) and the samples were incubated at 37°C for overnight. The digestion was quenched with 10% trifluoroacetic acid. 10-20 µL of the 2 digestion samples, which correspond to ~1-2 µg of protein, assuming 60% sample recovery, were injected for DDA using CID and 40 µL (~4 µg) of the samples were injected for EAD analyses.
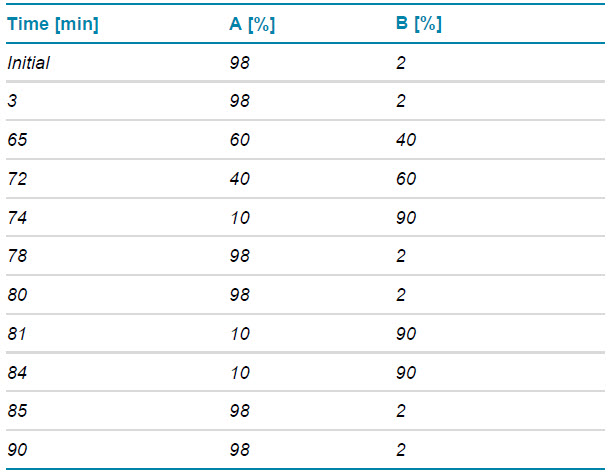
Chromatography: The peptides were separated with the gradient displayed in Table 1 using an ACQUITY CSH C18 column (2.1 × 150 mm, 1.7 µm, 130 Å, Waters). A flow rate of 0.25 mL/min was used. The column was kept at 60ºC in the column oven of an ExionLC system (SCIEX). The mobile phases A and B consisted of 0.1% formic acid in water and 0.1% FA in acetonitrile, respectively.
Table 1. LC method for peptide mapping.
Mass spectrometry: LC-MS data were acquired in SCIEX OS software using the ZenoTOF 7600 system. The key TOF MS and DDA settings for peptide mapping are listed in Tables 2 and 3, respectively.
Table 2. TOF MS parameters.
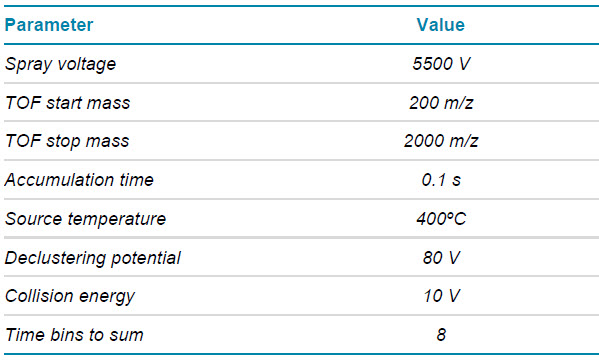
Table 3. DDA parameters using CID or EAD.
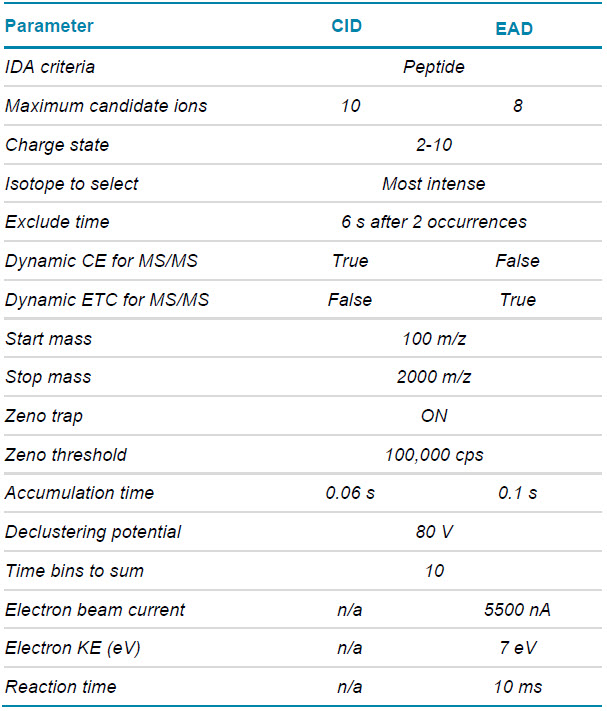
Data processing: CID and EAD DDA data were processed using the peptide mapping workflow templates in the Biologics Explorer software. The mass tolerances for MS and MS/MS were set to 10 ppm and 20 ppm, respectively. The instrument type was set to “CID (Glycopeptides)” and “EAD” for processing CID and EAD DDA data, respectively. The c+57/z–57 fragment ion type was enabled in the EAD method for differentiation of deamidation isomers. Trypsin and chymotrypsin were chosen from the enzyme list. Carbamidomethyl at cysteines was set as a fixed modification. The variable modifications included deamidation at N and Q, Gln to pyro-Glu for N-terminal Q, oxidation at M and ammonia loss for N. For identification of N-linked glycopeptides, a large library containing 133 N-glycan structures, based on Chinese Hamster Ovary cells, was chosen from the libraries available in the Biologics Explorer software. A library of 7 common O-glycan structures was used for subsequent identification of O-linked glycopeptides. It should be highlighted that identification of N- and O-linked glycopeptides can be performed in a stepwise manner using an extended peptide mapping template within the Biologics Explorer software, which limits false positive hits.
Peptide mapping of SARS-CoV-2 spike proteins
The highly sensitive CID DDA method led to a nearly complete sequence coverage for both WT and N501Y mutant (>95%) of the SARS-CoV-2 spike protein, thereby allowing in-depth characterization of mutations and modifications in the 2 proteins.
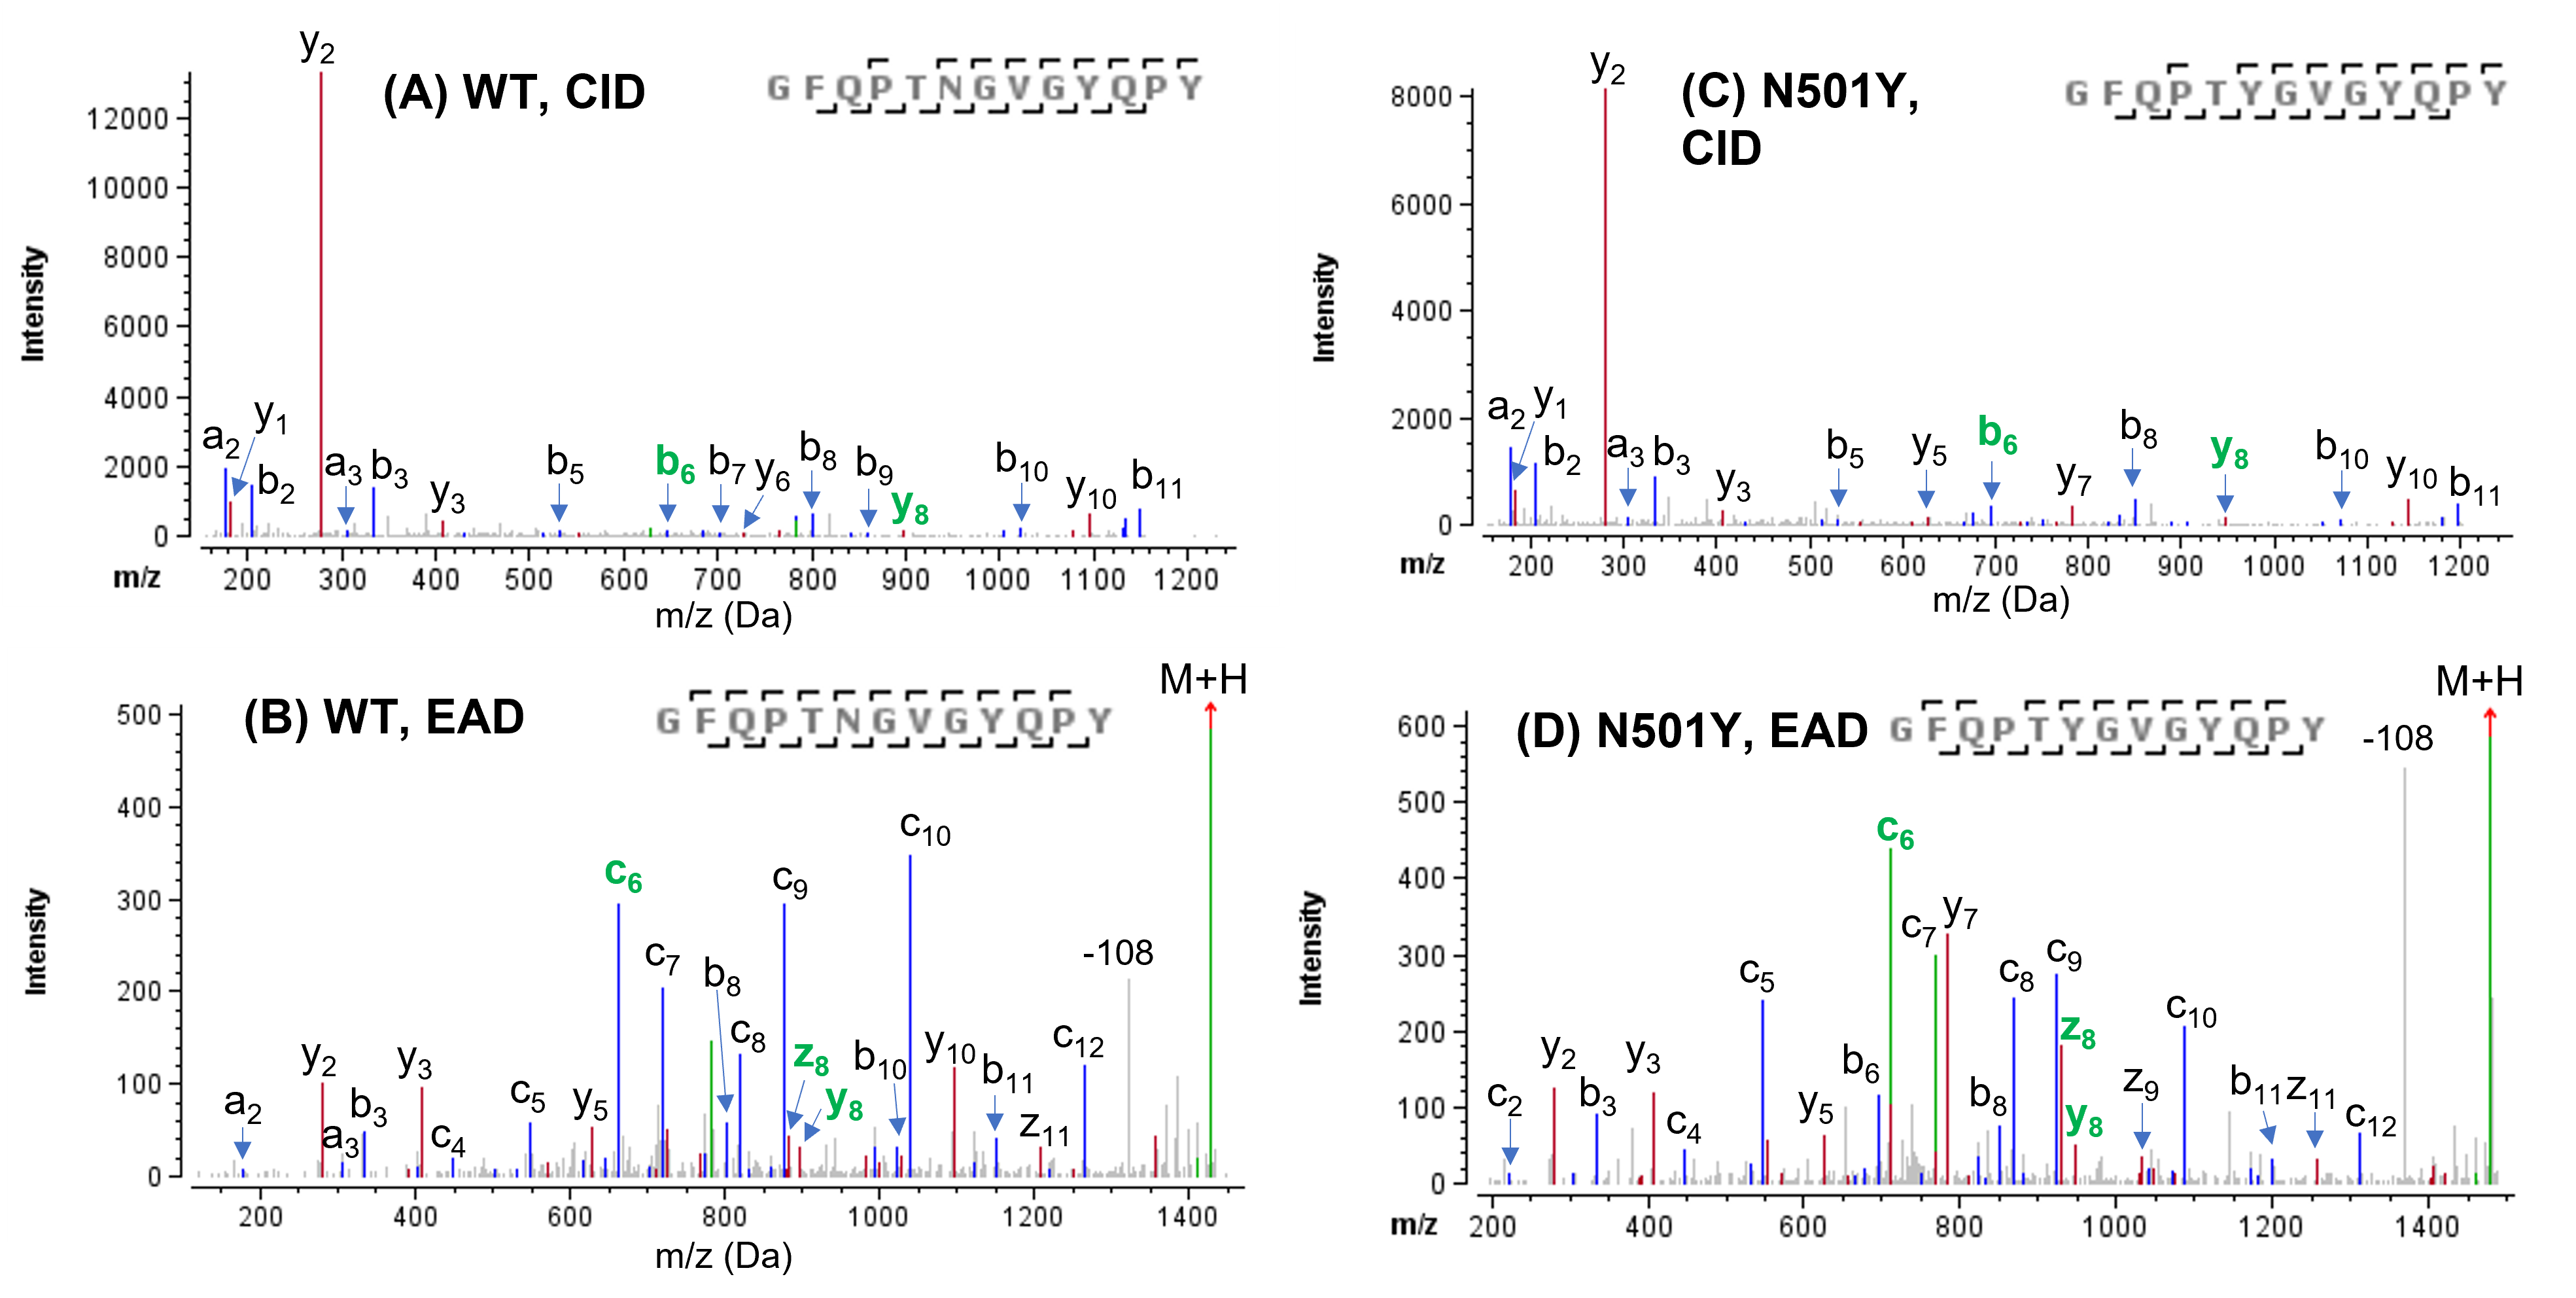
The naturally occurring N501Y mutation was confidently confirmed based on the identification of the peptides GFQPTNGVGYQPY and GFQPTYGVGYQPY in the WT and N501Y sample, respectively, using CID or EAD (Figure 2). While the CID MS/MS spectra (Figure 2A and 2C) of these 2 peptides were dominated by a y2-ion due to preferential cleavage at proline near the C-terminus, a more even distribution of sequence ions (b/y and c/z) with high signal-to-noise was observed in the EAD spectra (Figure 2B and 2D), thereby allowing for improved confidence in peptide identification.
Figure 2. CID and EAD MS/MS spectra of WT peptide and its N501Y mutant. The N501Y mutation was confidently confirmed by the m/z of b6/c6 and z8/y8 (highlighted in green) in the high-quality CID or EAD data of 2 peptides. While the CID spectra of WT and N501Y peptides (A and B) are dominated by the presence of a y2 ion resulting from the preferential cleavage at proline near the C-terminus, EAD generated a more even distribution of sequence ions (b/y and c/z) for the 2 peptides (C and D). The neutral loss of 108 amu of the remaining precursor ion corresponds to a side chain loss from the tyrosine residue. Note: All CID and EAD spectra displayed in this technical note were the deconvoluted and deisotoped in the Biologics Explorer software. Not all fragments were labeled for spectral clarity.
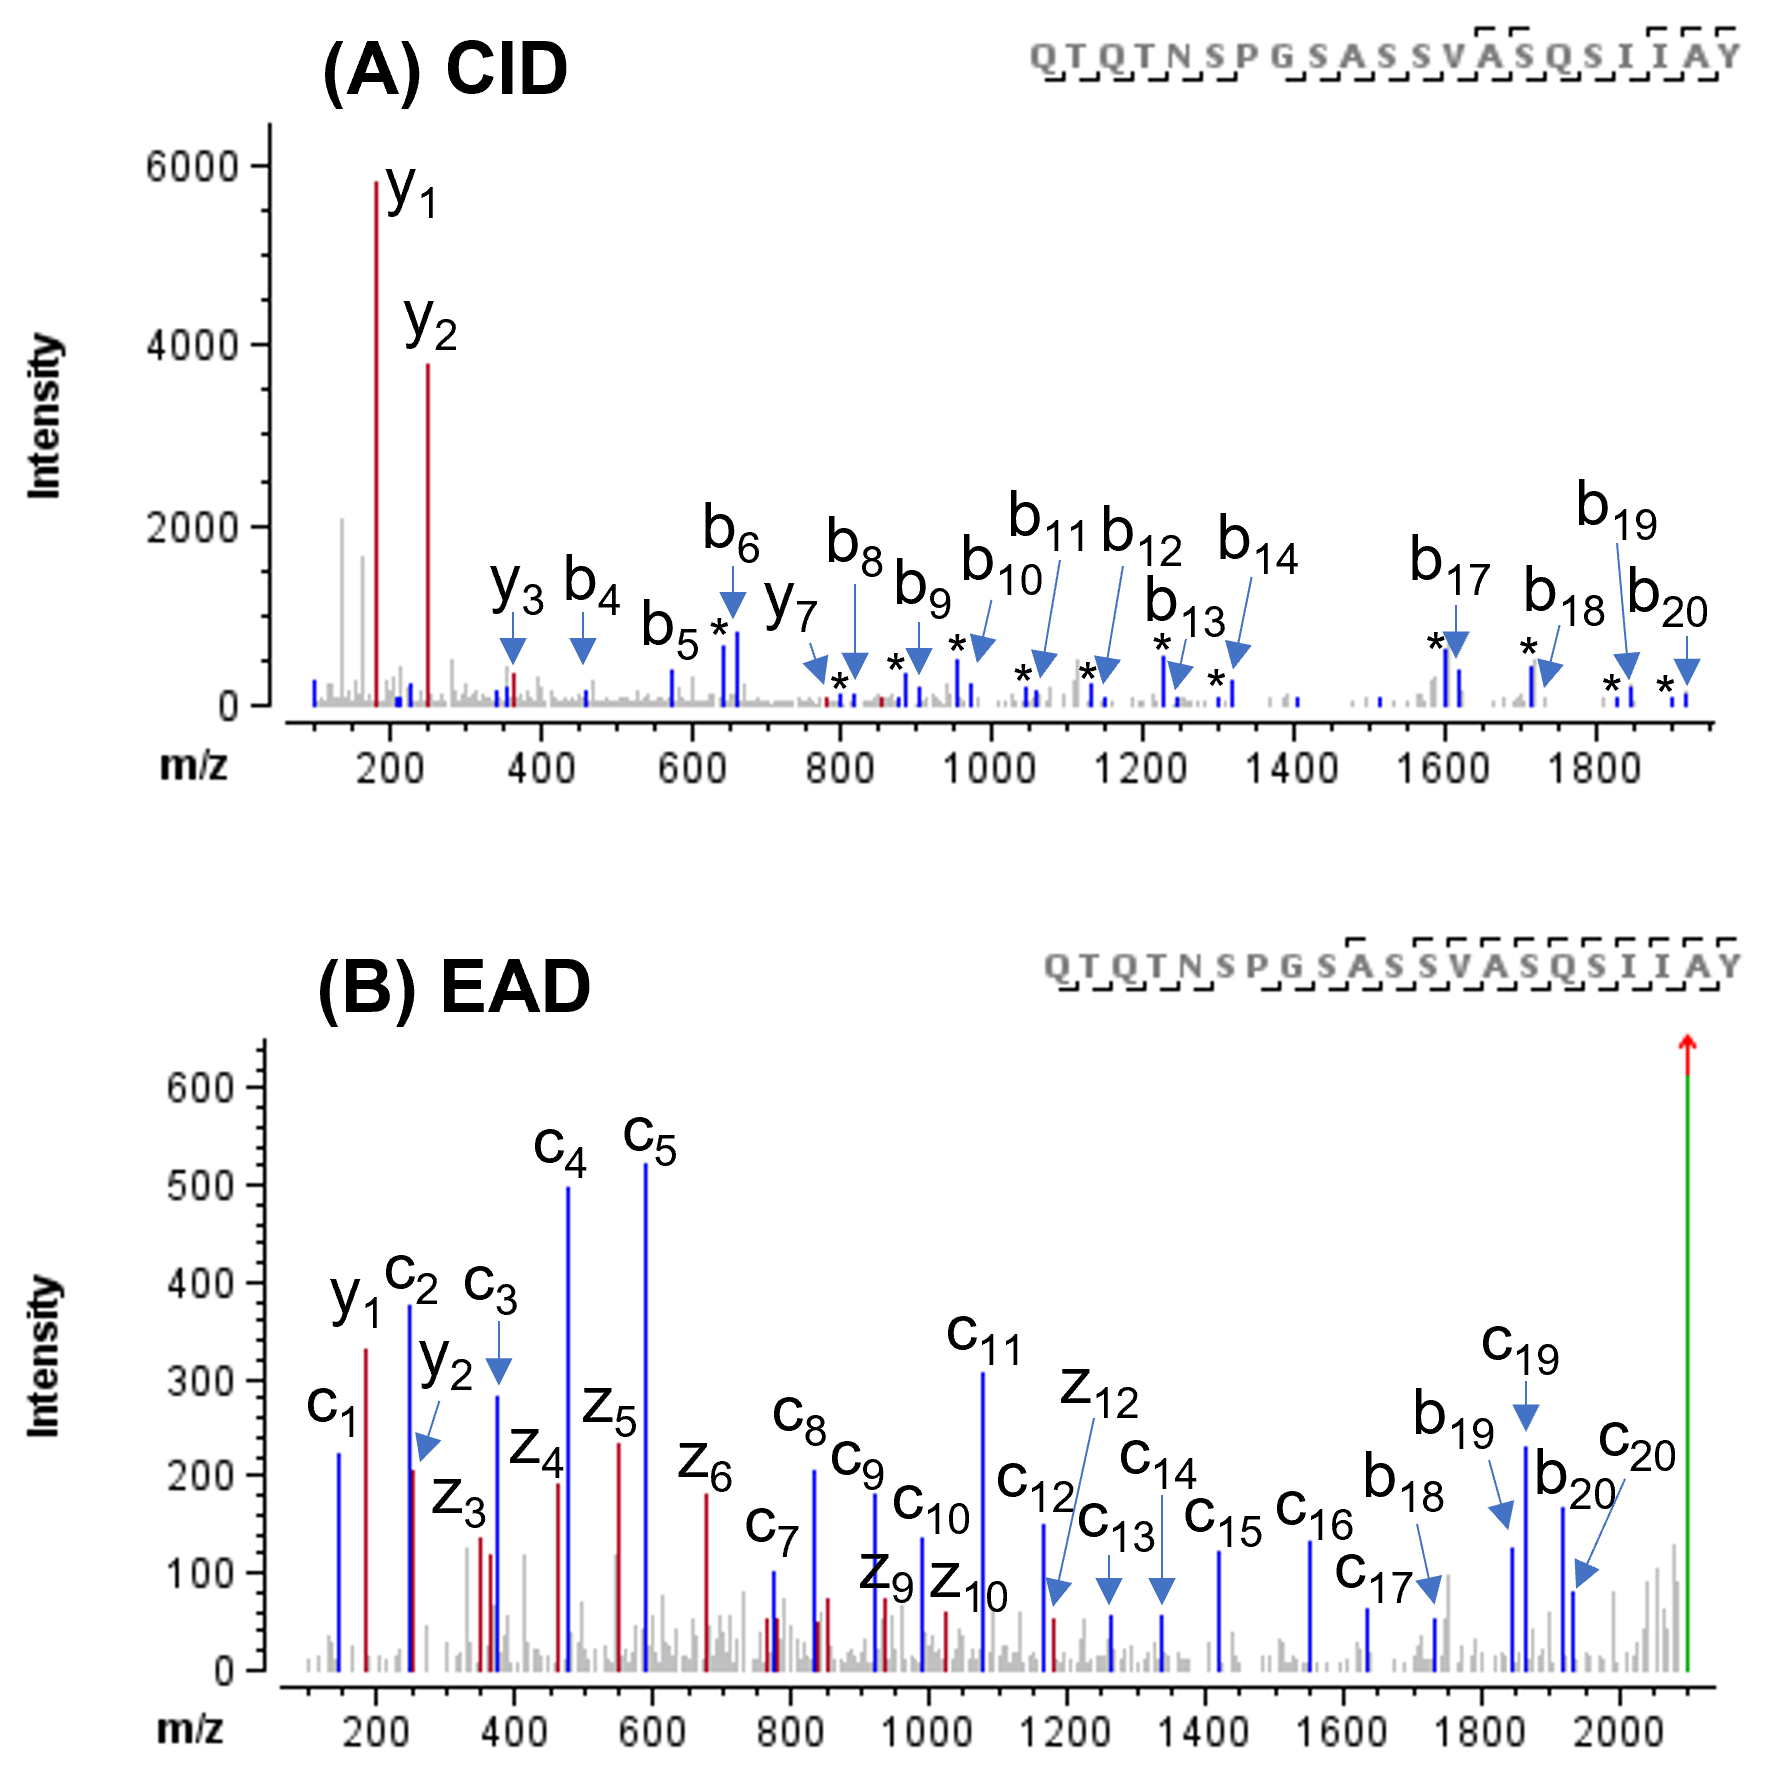
The sequences of both WT and N501Y forms analyzed in this study were engineered to increase their resistance to proteases and the stability between S1 and S2 subunits.6 Specifically, the sequence RRAR in a furin recognition site was replaced by GSAS and 2 amino acid residues at positions 986 and 987 were replaced by 2 proline residues. These sequence changes were confidently confirmed by CID or EAD data. Displayed in Figure 3 are CID and EAD MS/MS spectra of the peptide with RRAR to GSAS mutation. Both MS/MS spectra were rich in sequence ions, enabling confident peptide identification and confirmation of the sequence change. However, compared to the CID spectrum (Figure 3A), where y1 and y2 were dominant, the EAD spectrum (Figure 3B) was featured with more sequence ions (c/z and b/y) in a more even distribution. Additionally, while the b-H2O ions were prevalent in the CID spectrum (peaks labelled with “*” in Figure 3A) of this serine-rich peptide (6 Ser in total), these fragments were not detected in the EAD spectrum (Figure 3B). These unique characteristics of EAD improved confidence in characterization of mutations of single or multiple amino acid residues in the SARS-CoV-2 spike protein.
Figure 3. CID and EAD MS/MS spectra of the peptide with RRAR to GSAS mutation. Peaks labeled “*” in the CID spectrum (A) correspond to the H2O-loss of the corresponding b-ions. Both CID (A) and EAD (B) provided confident peptide identification and confirmation of the sequence change. As compared to CID (A), which generated abundant b-H2O ions from this serine-rich peptide, EAD (B) produced more extensive sequence ions (c/z and b/y) and no H2O-losses, thereby improving the confidence in sequence analysis.
Characterization of N- and O-linked glycosylations
The SARS-CoV-2 spike protein is heavily glycosylated with a variety of glycan structures, including predominantly high-mannose and complex N-glycan types as well as trace level of O-glycosylation.1 Comprehensive characterization of glycosylation in the spike protein may enhance the understanding of viral pathobiology and facilitate vaccine design to combat future viruses.
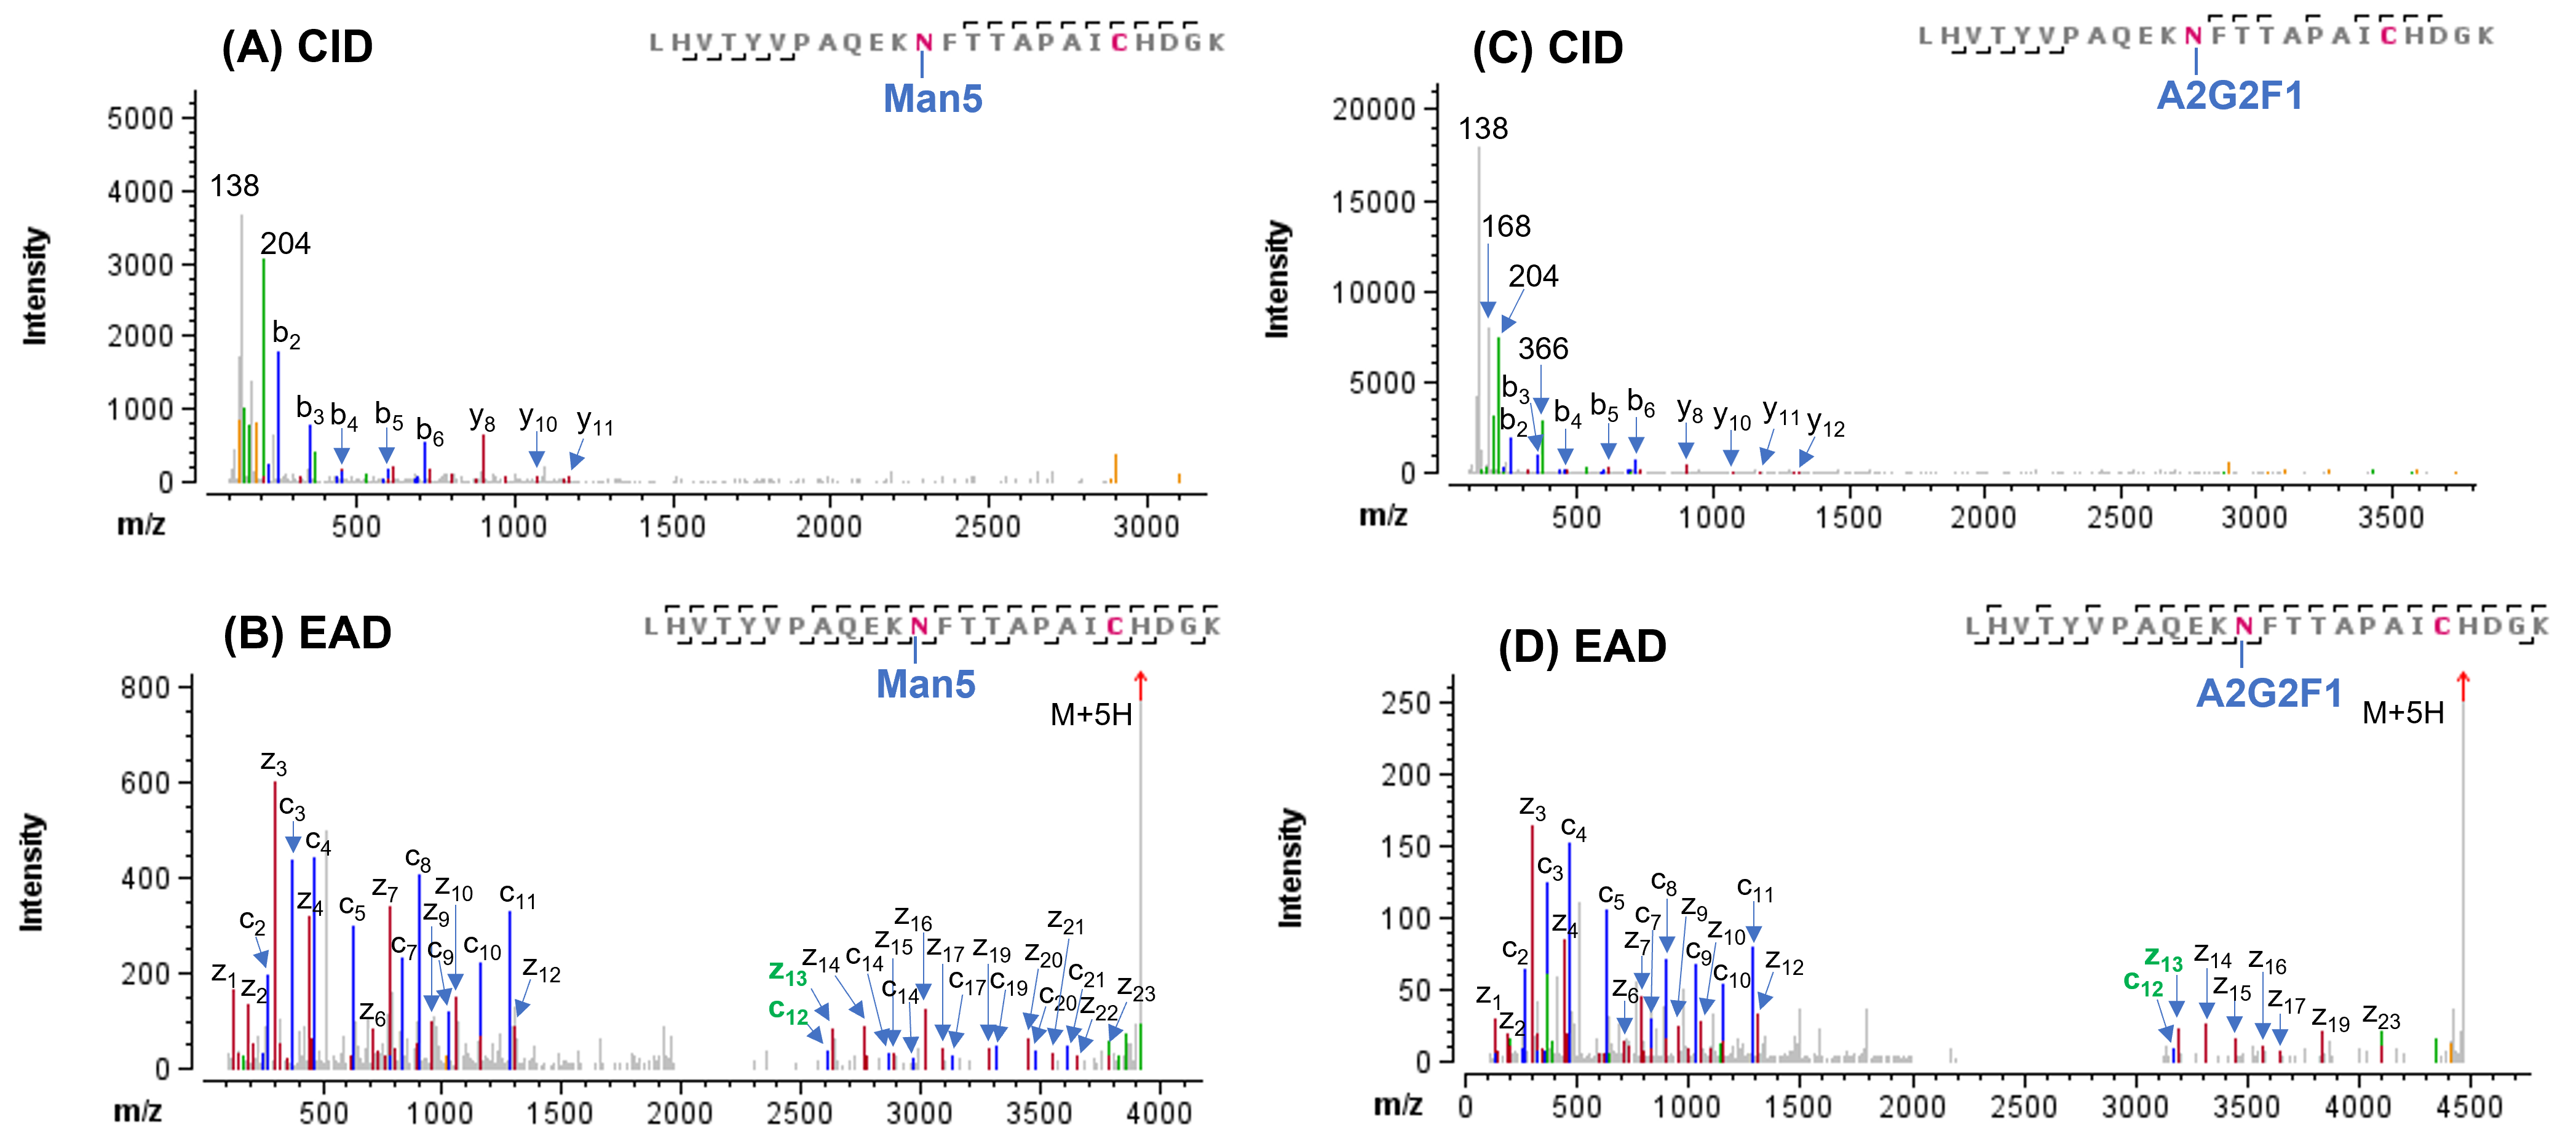
In this study, 21 N-linked glycosylation sites were identified from CID and EAD data. In agreement with previously published results,1,6 most of the N-linked glycosylation sites carried high-mannose and complex glycans. The CID and EAD MS/MS spectra of the 2 N-glycopeptides carrying these 2 glycan types at N234 and N1074 were displayed in Figures 4 and 5, respectively. In both examples, the CID MS/MS spectra (Figure 4A/4C and 5A/5C) were enriched with abundant oxonium ions (such as, m/z 204) derived from the glycan moieties. Although the detection of a series of low abundance b/y ions in CID enabled confident sequence identification, no fragments containing the glycans were observed. Thus, site-specific information about glycosylation was missing in the CID data. By comparison, EAD MS/MS of these 2 N-linked glycopeptides (Figure 4B/4D and 5B/5D) generated more complete sequence ions (c/z) for improved confidence in glycopeptide identification and preserved the intact glycans on the fragments, thereby allowing precise localization of glycosylation. These results demonstrate again the capability of EAD for in-depth characterization of glycopeptides.
Figure 4. CID and EAD MS/MS spectra of N-linked glycoforms Man5 and Man8 of peptide DLPQGFSALEPLVDLPIGINITR. This glycopeptide contains an N-glycosylation site at Asn-234. The CID spectra of glycoforms Man5 and Man8 (A and C) were dominated by oxonium ions from the glycans (such as, m/z 204). Although the detection of a series of low abundance b-ions in CID allowed confident identification of these 2 glycopeptides, no fragments containing the glycan were observed and hence no site-specific information about glycosylation was obtained. By comparison, EAD of these 2 glycopeptides (B and D) generated more sequence ions (c/z) for improved confidence in identification and also produced fragments with the glycan (such as, c20 and z4) for unambiguous localization of the glycosylations.
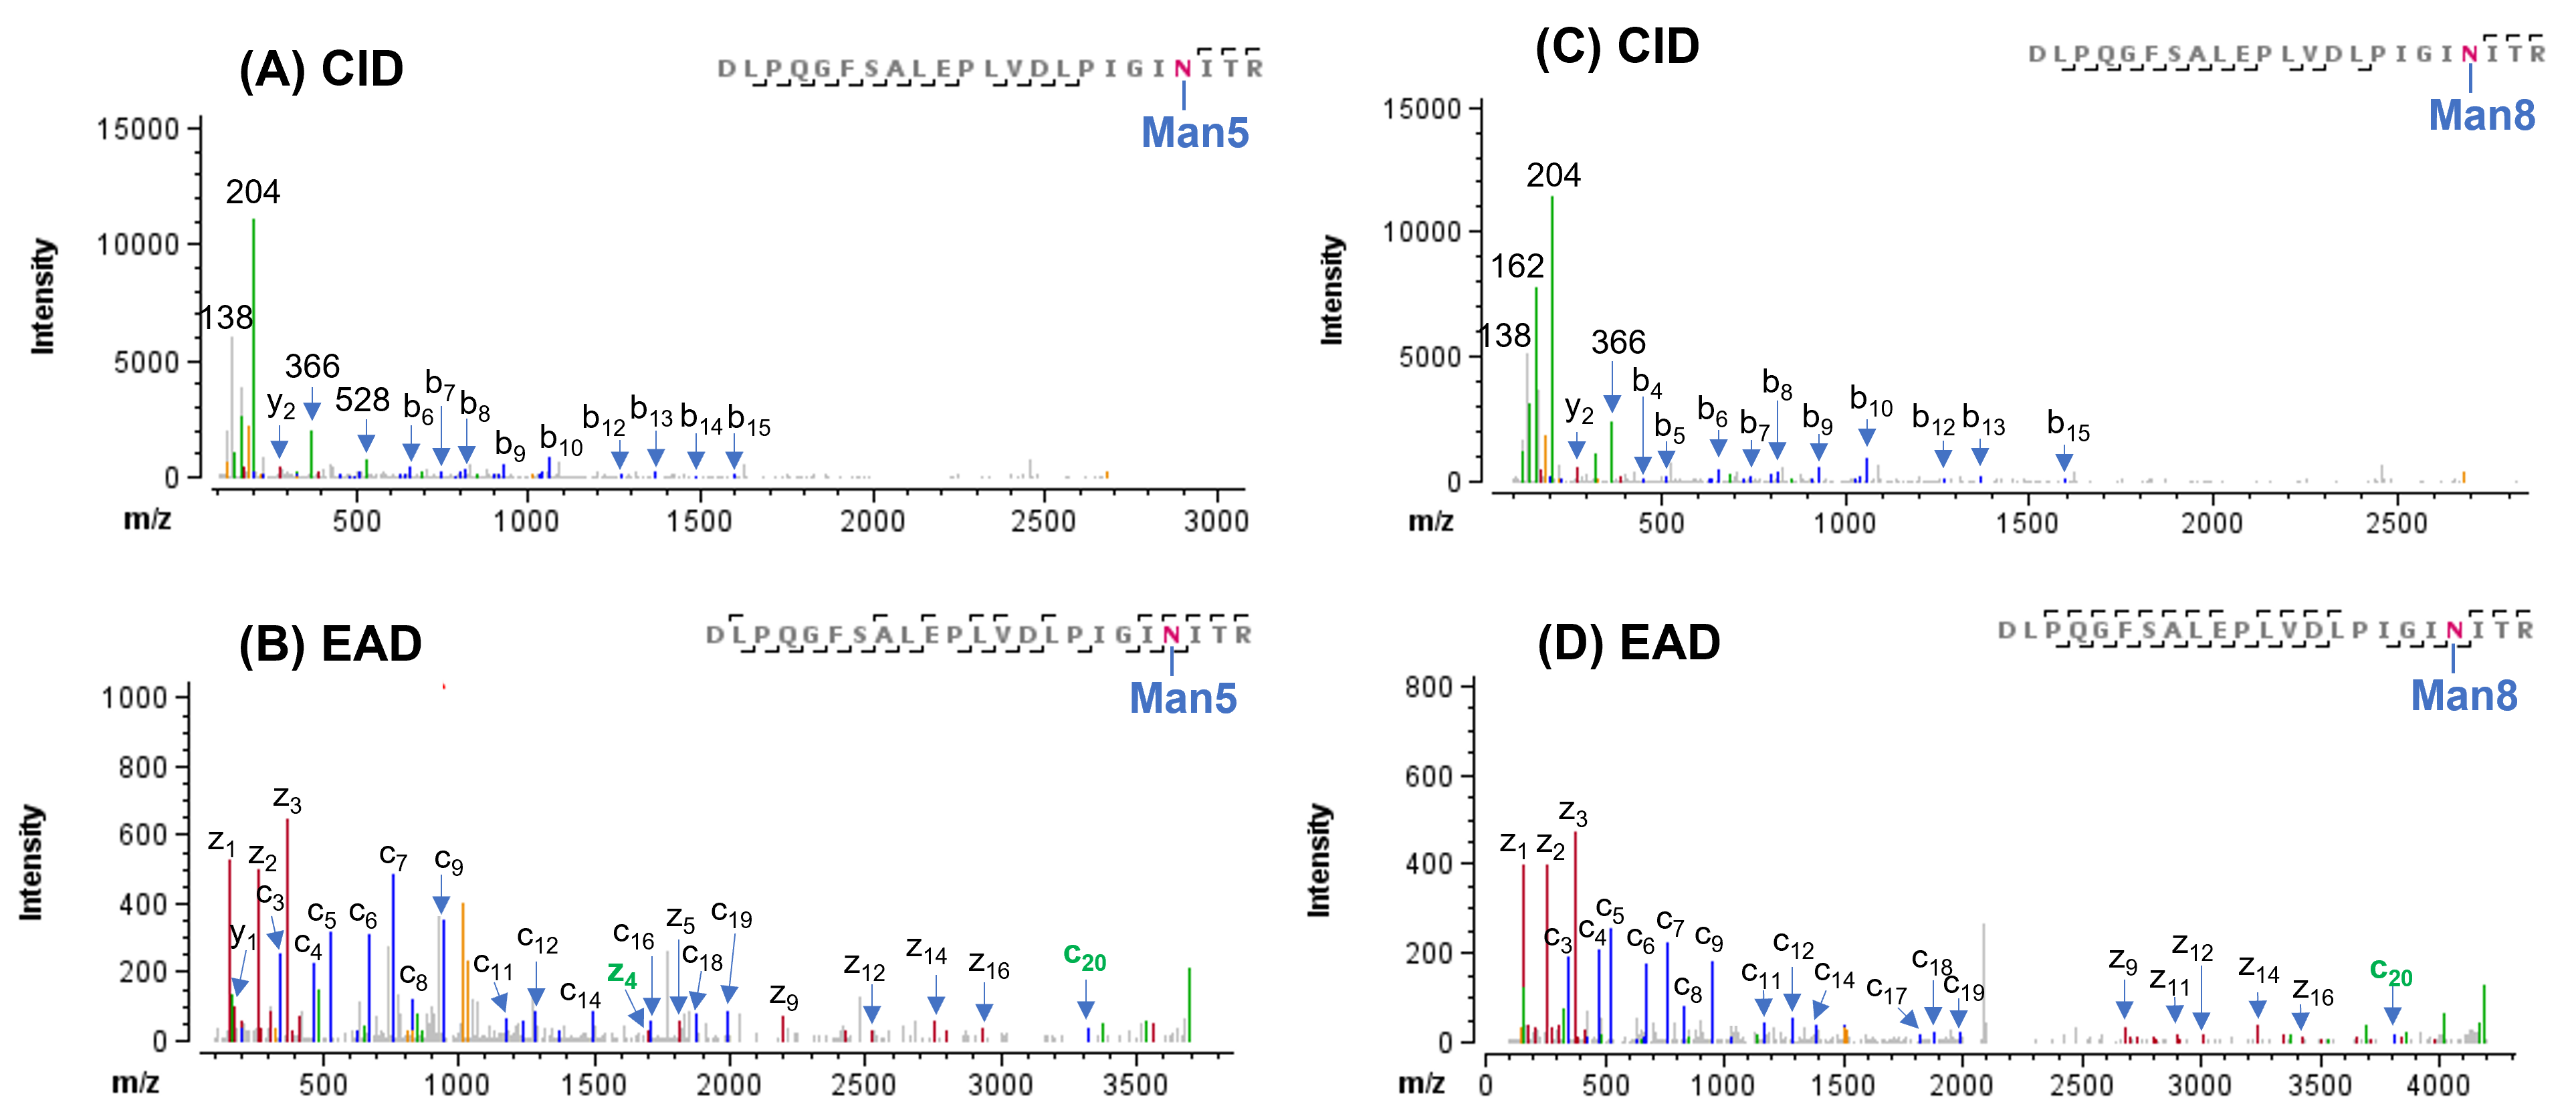
Figure 5. CID and EAD MS/MS spectra of N-linked glycoforms Man5 and A2G2F1 of LHVTYVPAQEKNFTTAPAICHDGK. This glycopeptide contains an N-glycosylation site at Asn1074. The CID spectra of 2 glycoforms (A and C) contained mostly the oxonium ions and limited number of b/y ions without the glycan, resulting in low confidence in peptide identification and no site-specific information about glycosylation. By comparison, EAD of these 2 glycopeptides (B and D) generated not only rich sequence ions (c/z) for high confident peptide identification, but it also produced fragments with the glycan (such as, c12 and z13) for unambiguous localization of glycosylation.
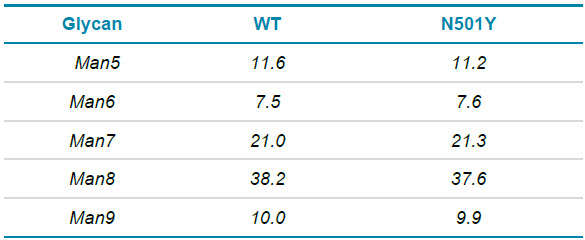
By default, the Biologics Explorer software considers all peptides containing the same glycosylation site for percentage calculation with the option for user-defined changes. As an example, all N-glycoforms identified for the peptide DLPQGFSALEPLVDLPIGINITR were chosen in the result table for relative quantification of the glycosylation at N234. The relative abundances of the five most abundant high-mannose species were determined based on MS1 of the EAD data (Table 4). The result show that the levels of these high-mannose glycoforms on N234 were nearly the same between WT and N501Y proteins. While Man8 (44%) and Man9 (30%) were the top glycoforms found for N234 in a previous study,1 Man8 (~38%) and Man 7 (~21%) were the dominant species identified in this work. This difference in the glycosylation profile may be attributed to different cell lines used for protein expression in the two studies (FreeStyle293F cells used previously1 versus HEK293 cells employed here).
Table 4. Relative abundances (%) of major high-mannose glycoforms of peptide DLPQGFSALEPLVDLPIGINITR in WT and N501Y mutant. Percentages were calculated based on respective XICs of MS1 data from EAD.
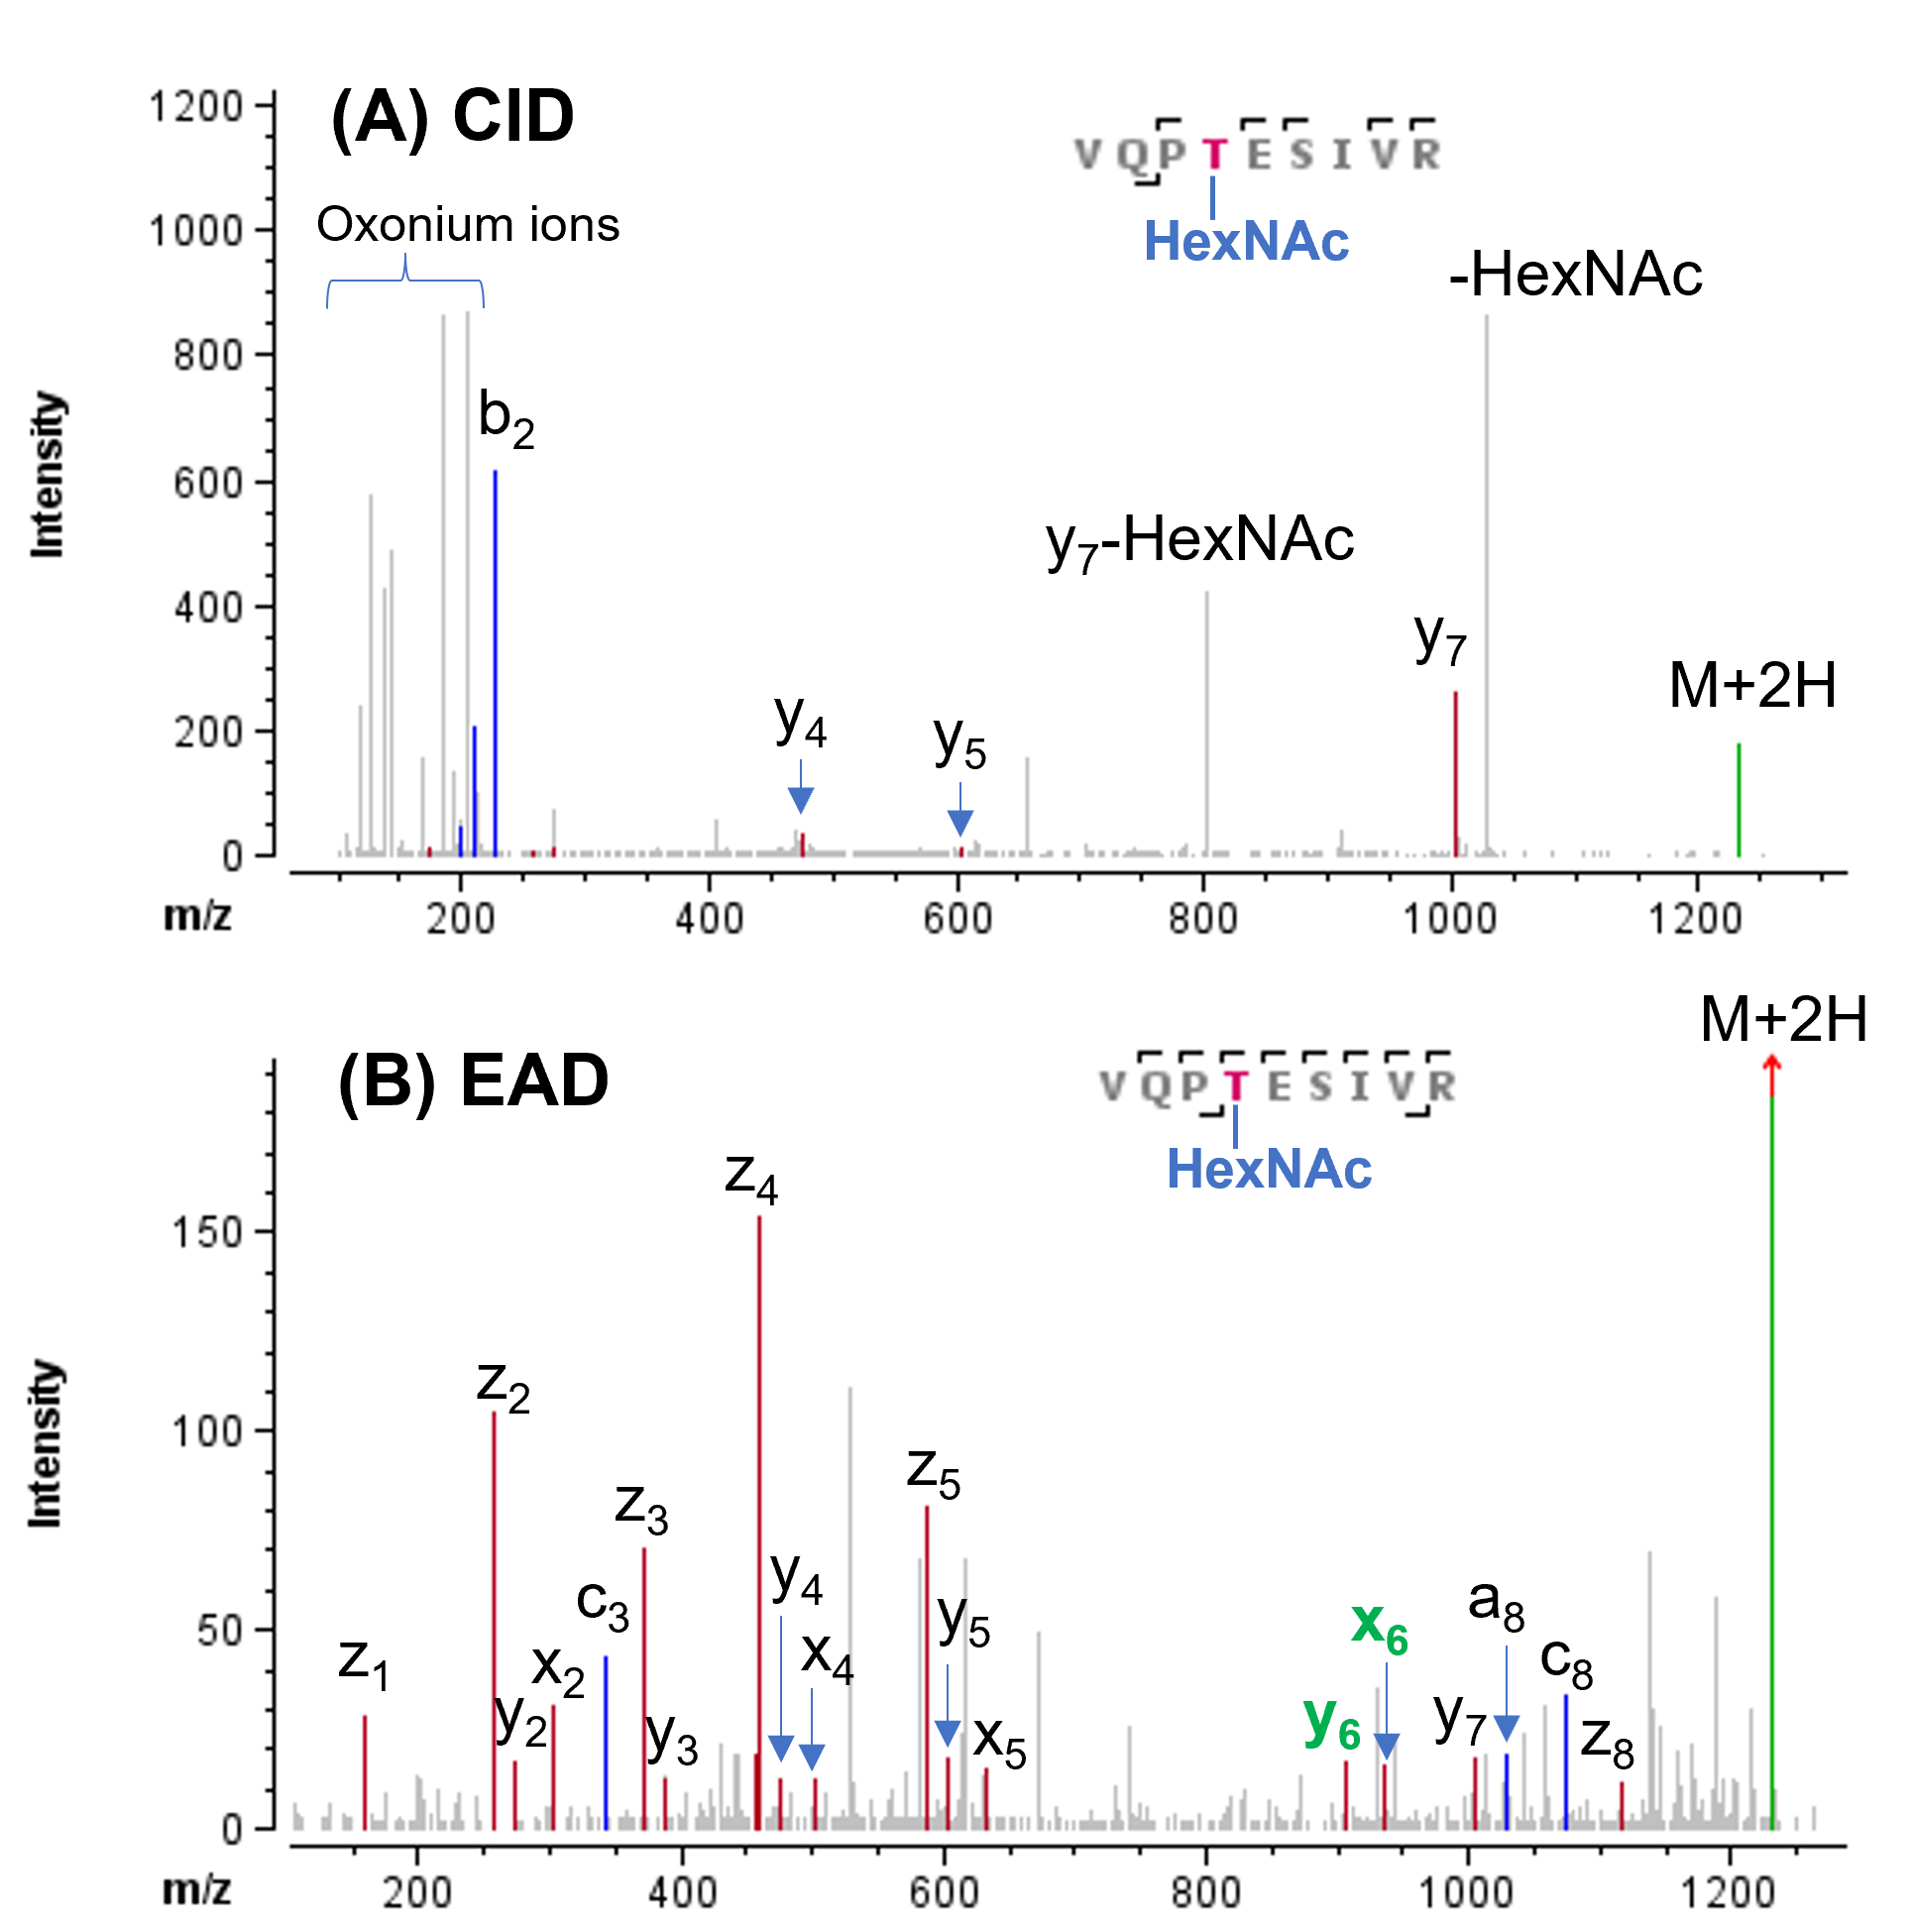
In contrast to abundant N-glycosylation detected in SARS-CoV-2 spike protein, O-glycosylation was previously found to be present at very low levels.1,6 The major O-glycosylation site was identified to be T323.6 The CID and EAD data from this study both led to confident identification of this O-glycopeptide (Figure 6). The occupancy of O-linked glycan at T323 (0.6%) was confirmed based on a series of fragments from EAD with or without the glycan HexNAc (Figure 6B). Specifically, the accurate site information of this glycan was obtained from non-glycosylated x5/y5/z5 and HexNAc-containing x6/y6-ions detected in the EAD data (Figure 6B).
Figure 6. CID and EAD MS/MS spectra of O-linked glycopeptide VQPTESIVR. The CID spectrum (A) was featured with abundant oxonium ions, but did not show fragments containing the O-glycan, impeding accurate localization. By contrast, EAD with KE of 7 eV (B) and 1 eV (C) preserved the O-glycan in the fragments, allowing for accurate localization of this glycan to the Thr instead of Ser residue. While EAD with KE=7 eV (B) provided a more complete coverage of this glycopeptide, the EAD spectrum (C) obtained using KE=1 eV was simpler for easier data reduction.
Differentiation of deamidation isomers
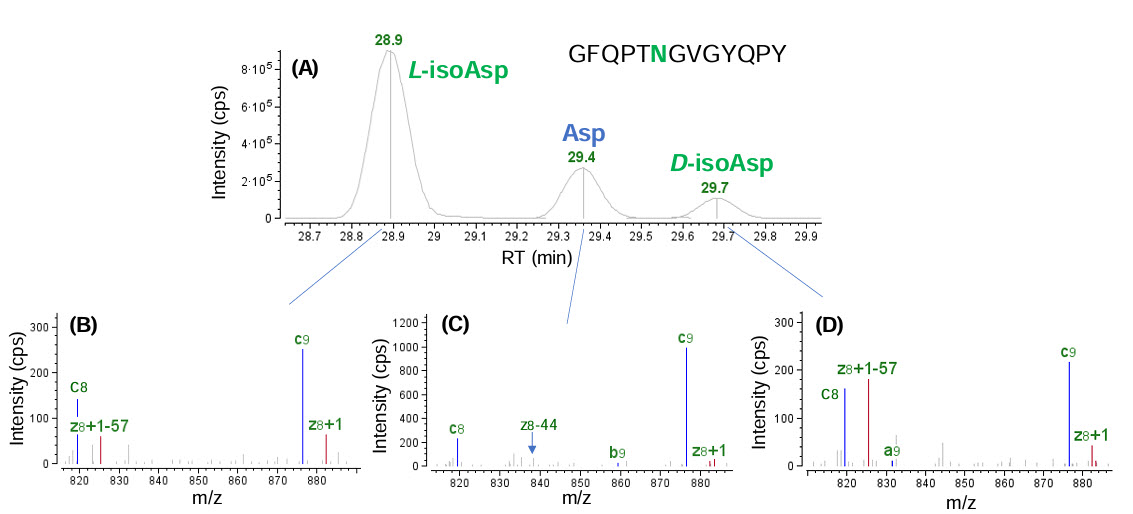
As reported previously, it is challenging to differentiate deamidation isomers, such as, Asp and isoAsp, based on their elution patterns or using CID MS/MS.3,5 However, EAD is capable of generating signature fragments (z-57 and z-44 for the isoAsp and Asp isomers, respectively) enabling differentiation of these 2 isomers.3,5 Illustrated in Figure 7 is an example of isomer differentiation for an Asn-deamidated peptide of the SARS-CoV-2 spike protein (GFQPTNGVGYQPY) using EAD MS/MS. The 3 isomeric Asn-deamidated species observed in the extracted ion chromatogram (XIC) (Figure 7A) can be differentiated based on the detection of a signature z8-57 fragment for the isoAsp isomer (Figure 7B and 7D) and a z8-44 fragment for the Asp isomer (Figure 7C). The presence of 2 isoAsp isomers can be attributed to racemization, which converted the naturally occurring L- form to its D- counterpart in lower abundance, as reported previously.7–9
Figure 7. Differentiation of isoAsp and Asp isomers of Asn-deamidated peptide GFQPTNGVGYQPY using EAD. Three isomeric species were observed in the XIC (A) this deamidated peptide. The detection of a signature z8-57 fragment allowed confident assignment of 2 isoAsp isomers (B and D) in the software automatically, while the absence of this fragment and the detection of a z8-44 ion enabled assignment of the Asp isomer (C). The presence of 2 isoAsp isomers can be explained by racemization from the naturally occurring L- form to its D- counterpart, as reported previously.7–9
Conclusion
- Comprehensive characterization of SARS-CoV-2 spike protein and its mutant was achieved using DDA with CID or EAD
- Nearly complete sequence coverages (>95%) were obtained for the wild type and N501Y mutant of the spike protein in a single injection using the highly sensitive CID method with Zeno trap enabled
- The mutations in the SARS-CoV-2 spike proteins were confidently confirmed using CID or EAD, with EAD providing better fragment coverage and more even distribution of sequence ions for higher confidence in correct identification
- Improved confidence in the identification of N- and O-linked glycopeptides as well as unambiguous localization of glycosylation was achieved with EAD
- Differentiation of deamidation isomers was enabled by EAD-derived signature ions
References
- Yasunori Watanabe et al. (2020) Site-specific glycan analysis of the SARS-CoV-2 spike. Science 369(6501):330-333.
- Ramiro Lorenzo et al. (2021) Deamidation drives molecular aging of the SARS-CoV-2 spike protein receptor-binding motif. J. Biol. Chem. 297(4):101175.
- Differentiation of aspartic and isoaspartic acid using electron activated dissociation (EAD). SCIEX technical note, RUO-MKT-02-12550-B.
- Differentiation of leucine and isoleucine using electron activated dissociation (EAD). SCIEX technical note, RUO-MKT-02-12605-B.
- An evaluation of single injection platform method for advanced characterization of protein therapeutics using electron activation dissociation (EAD). SCIEX technical note, RUO-MKT-02-13965-A.
- Use of mass spectrometry to assist production of SARS-CoV-2 spike protein. SCIEX technical note, RUO-MKT-02-13965-A.
- Marine Morvan and Ivan Miksik. (2021) Recent advances in chiral analysis of proteins and peptides. Separations 8(8): 112.
- Intact LC-MS analysis and peptide mapping of recombinant adeno associated virus (rAAV) capsid proteins. SCIEX technical note, RUO-MKT-02-14244-A.
- Superior characterization and monitoring of product quality attributes using an electron activated dissociation (EAD)-based multi-attribute method (MAM). SCIEX technical note, RUO-MKT-02-14240-A.