Abstract
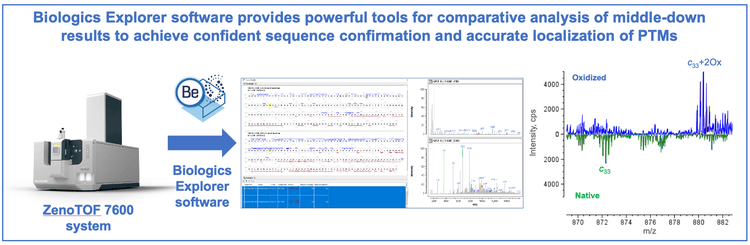
This technical note highlights the comparative analysis of biotherapeutics utilizing a streamlined, single-injection EADbased middle-down workflow to accelerate decision making in biopharmaceutical development. Biologics Explorer software provides powerful tools that enable fast and detailed comparisons of middle-down results to increase confidence in sequence confirmation and localization of post-translational modifications (PTMs).
Introduction
Middle-down mass spectrometry (MS) combines the advantages of bottom-up and top-down MS approaches and offers high sequence coverages of monoclonal antibody (mAb) subunits following simple sample preparation. 1-3 Traditionally, a middledown workflow requires time-consuming method development and often involves multiple fragmentation techniques and/or injections to obtain high sequence coverage. This challenge can be addressed using a single-injection, EAD-based middle-down workflow. 4,5 This streamlined workflow provided consistently high sequence coverage of mAb subunits, enabling confident sequence and PTM confirmations. 5
In this technical note, comparative analyses of the middle-down results of mAb subunits were performed using Biologics Explorer software (Figure 1). These analyses highlight the advantages of tools offered by Biologics Explorer software for sequence confirmation and PTM localization. The potential application of comparative middle-down analysis for the characterization of biosimilars or sequence variants will be discussed.
Key features of the EAD-based middle-down workflow
- Single-injection platform method: The EAD-based middledown workflow provides high sequence coverages in a single injection with a single fragmentation technique
- Reproducible high sequence coverage: Sequence coverages ranging from 70% to 85% are obtained between runs for the subunits of various biotherapeutics
- Localization of PTMs: High sequence coverage and preservation of labile modifications by EAD allows for comprehensive PTM analysis
- Streamlined: The workflow consists of simple sample preparation, efficient data acquisition and automatic data analysis, with limited method development required
- Comparative data analysis: Biologics Explorer software provides tools to rapidly compare middle-down results across most stages of protein therapeutic development or stress studies
Methods
Sample and reagents: The trastuzumab emtansine antibody was purchased from Myonex. SILUmab (MSQC3, Sigma) was used as an internal standard (IS). A trypsin/lys-C mixture (Promega) was used for digestion.
Sample preparation: The sample was extracted using immunoaffinity extraction and was analyzed by microflow LCMS/MS after digestion. The antibody and the internal standard mixture were spiked into rat plasma. Samples were incubated with Biozen Magbeads (Phenomenex, CA) according to the manufacturer's manual. Conjugated magnetic beads were pulled down using magnetic racks and washed as per directions from the manufacturer's manual. Antibodies were eluted using 0.1% trifluoroacetic acid (TFA). For the digestion process, the pH was adjusted to >7 using 1mM calcium chloride in 500mM ammonium bicarbonate. Samples were denatured at 90°C for 10 minutes and digested with 0.25 µg/mL of trypsin/lys-C overnight at room temperature. The digestion was stopped by adding 3 µL of formic acid. Samples were spun down and transferred to vials. The final concentration of the antibody trastuzumab emtansine was 500 ng/mL, and the internal standard (IS), SILUmab, was 125 ng/mL.

Mass spectrometry: MRMHR experiments were performed in SCIEX OS software using the ZenoTOF 7600 system. Two or 3 charge states were targeted per subunit for EAD fragmentation. The key TOF MS and MRMHR EAD settings used are listed in Tables 2 and 3, respectively. CID data for the NISTmAb Fc/2 G0F subunit were acquired using collision energies of 25-30 eV, 33-37 eV and 45-50 eV for charge states 29+, 24+ and 20+, respectively.
Data processing: MRMHR data were analyzed using a new middle-down workflow template in the Biologics Explorer software, as previously described. 4,5


Comparative analysis of middle-down results using Biologics Explorer software
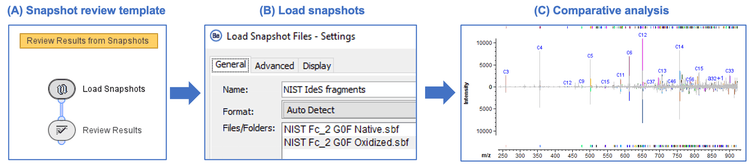
The EAD-based middle-down workflow leverages reproducible and information-rich fragmentation by EAD and automated data analysis by Biologics Explorer software.4,5 This powerful workflow requires minimal effort in method development because of the reproducibility of EAD fragmentation and the capability of Biologics Explorer software for rapid comparative analysis. The Biologics Explorer software offers easy-to-use middle-down templates optimized for therapeutic characterization from data processing to results review and comparison. Figure 2 shows the streamlined process of using the snapshot review template for the comparative analysis of 2 EAD “snapshots” (results files). All results files saved from the middle-down workflow template are simultaneously loaded into the review template (Figures 2A and 2B). The results can be compared in detail using the sequence coverage map, summary table and/or combined MS/MS spectrum. Furthermore, MS/MS spectra can be compared in an overlaid or stacked view or using a mirror plot for confident sequence confirmation or PTM localization.
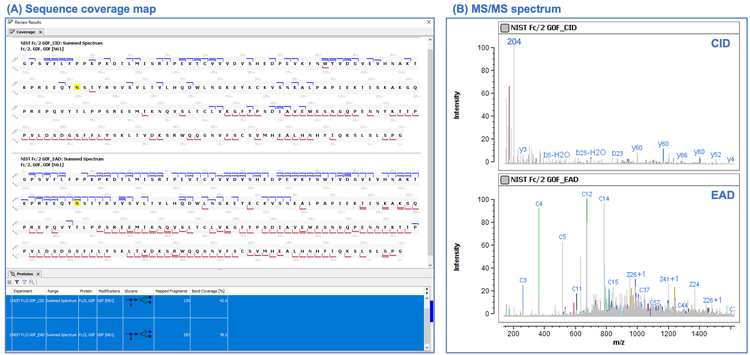
Figure 3 shows the middle-down results of the NISTmAb Fc/2 G0F subunit obtained using CID and EAD fragmentation approaches. It is evident from the sequence coverage maps and summary table (Figure 3A) that EAD provided more extensive fragmentation and higher sequence coverage than CID. Detailed comparison of 2 MS/MS spectra (Figure 3B) showed that EAD led to an information-rich spectrum with fragments detected across the full mass range. In contrast, the CID spectrum was dominated by the fragments generated from preferential cleavages, such as the oxonium ions from the fragmentation of the glycan moiety (for example, m/z 204) and the fragments associated with the cleavage of the N-terminus of proline residues (for example, y60). These results highlight the advantage of EAD over CID for middle-down analysis and the benefit of Biologics Explorer software for rapid comparative analysis.
Comparative analysis for confident sequence confirmation and PTM localization
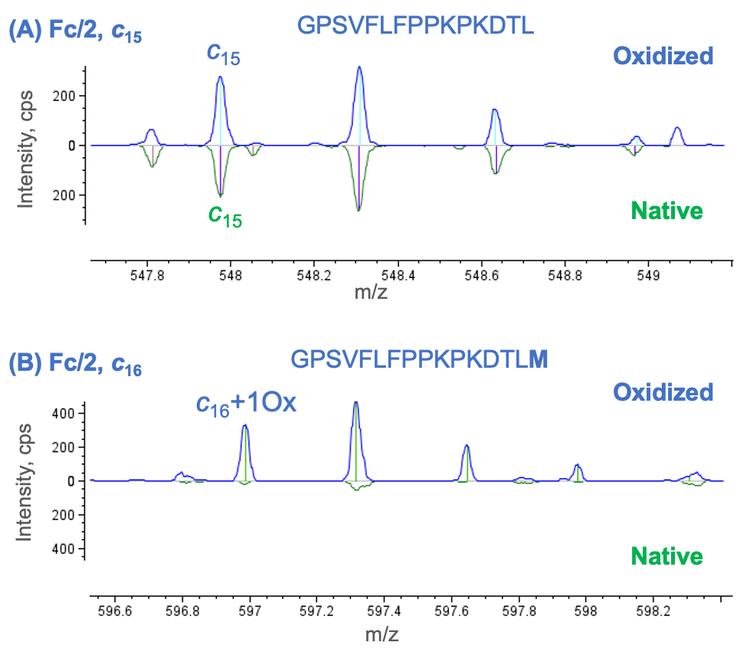
The mirror plot provided by Biologics Explorer software enables an in-depth comparison of 2 middle-down results files in an intuitive manner. This functionality can be leveraged to compare the results of native and forced degradation samples to localize PTMs or to compare 2 highly similar sequences, such as biosimilars or sequence variants, for sequence confirmation or differentiation. Figure 4 shows an example of using the mirror plot to localize an oxidation site in the oxidized NISTmAb Fc/2 subunit. The detection of a non-oxidized c15 fragment in the middle-down results of the native and oxidized Fc/2 subunit indicated the absence of oxidation for the first 15 amino acid residues (Figure 4A). A c16 ion containing 1 oxidation was detected for the oxidized Fc/2 subunit. However, the oxidized c16 ion was absent in the EAD spectrum of the native species (Figure 4B), indicating that Met16 was oxidized in the oxidized Fc/2 subunit.
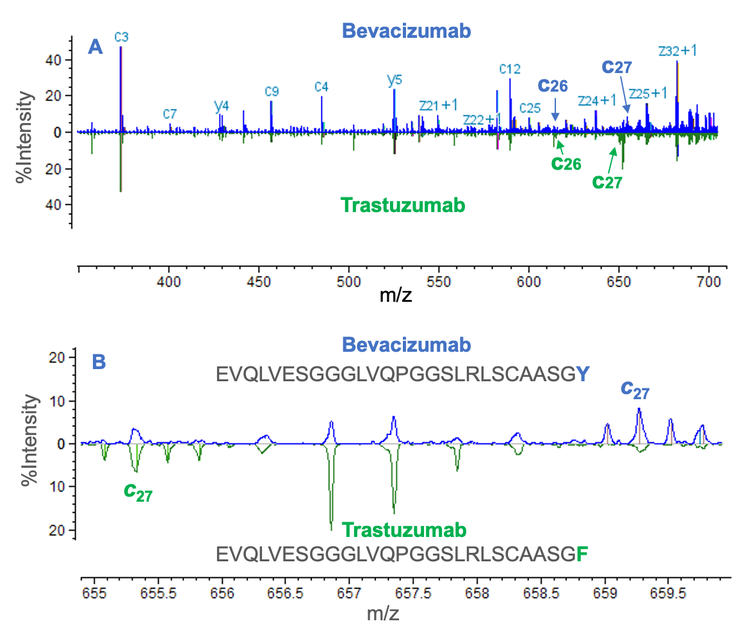
The mirror plot can also be employed to compare the middledown results of mAb subunits with highly similar sequences, such as biosimilars and sequence variants. The middle-down results from bevacizumab and trastuzumab Fd subunits with highly similar sequences were compared in Figure 5 using the mirror plot. The comparative analysis confirmed that the first 26 amino acid residues are shared between the 2 Fd subunits (Figure 5A). The amino acid residue in position 27 differs between the 2 subunits, with Tyr present in bevacizumab and Phe present in trastuzumab (Figure 5B) based on different m/z values measured for the c27 fragments. These results highlight the power of the single-injection, EAD-based middledown workflow for confident differentiation between similar sequences and accurate localization of PTMs. Further, these results indicate that this approach could be beneficial for performing comparative analysis to facilitate data analysis during biotherapeutic characterization.
Conclusion
- The streamlined, single-injection, EAD-based middle-down workflow can be a valuable addition to the biopharmaceutical toolkit to accelerate biotherapeutic development
- Biologics Explorer software provides powerful tools for comparative analysis of middle-down results to enable confident sequence confirmation and accurate PTM localization
- The comparison between EAD and CID middle-down results demonstrated the advantage of EAD over CID for the fragmentation of mAb subunits
- Comparative analysis of the native and oxidation samples using the mirror plot led to accurate localization of an oxidation site
- The mirror plot facilitated the confirmation and differentiation of 2 mAb subunits with highly similar sequences
References
- Milos Cejkov et al. (2021) Electron transfer dissociation parameter optimization using design of experiments increases sequence coverage of monoclonal. J. Am. Soc. Mass Spectrom. 32(3): 762-771.
- Luca Fornelli et al. (2018) Accurate sequence analysis of a monoclonal antibody by top-down and middle-down Orbitrap mass spectrometry applying multiple ion activation techniques. Anal. Chem. 90(14): 8421-8429.
- Kristina Srzentic et al. (2020) Interlaboratory study for characterizing monoclonal antibodies by top-down and middle-down mass spectrometry. J. Am. Soc. Mass Spectrom. 31(9): 1783-1802.
- A streamlined single-injection middle-down workflow using electron activated dissociation (EAD) for biotherapeutics characterization. SCIEX technical note, MKT-26997-A.
- Obtaining high sequence coverage and confident posttranslational modification (PTM) analysis of biotherapeutics using an electron activated dissociation (EAD)-based middle-down workflow. SCIEX technical note, MKT-27223- A.