Complete automation of the charge heterogeneity assay using the Biomek i5 Multichannel Workstation with downstream analysis on the BioPhase 8800 system
Introduction
Protein therapeutics is a rapidly growing industry for treating serious illnesses like cancer, autoimmune diseases, etc.1 Monoclonal antibodies, antibody-drug conjugates, fusion and multi-specific antibodies are a few examples of protein therapeutics on the market today2. These molecules may undergo post-translational modifications (PTM), producing sequence variants directly affecting the overall protein charge. Capillary isoelectric focusing (cIEF) is a robust, reproducible, and high-resolution technique to characterize therapeutic recombinant proteins' charge variant heterogeneity. The BioPhase 8800 system can achieve ~8 times faster charge heterogeneity analysis (compared to a single channel CE system)3. However, sample preparation for high throughput workflow can be labor-intensive and frequently becomes the bottleneck of analytical characterization workflows. This application note demonstrates the complete automated preparation of the cIEF assay for downstream analysis on the BioPhase 8800 system. The workflow includes preparing all reagent inlet and outlet plates required for cIEF separations and the inlet and outlet sample plates using United States Pharmacopoeia (USP) Immunoglobulin (IgG) system suitability reference standard (SS RF) antibody as a test article. The automated platform used in this work is the Biomek i5 MC liquid handler. The power of complete assay automation and downstream analysis in a multi-capillary electrophoresis platform addresses the need for higher throughput in the characterization of biologics using cIEF and its analytical performance in terms of reproducibility of isoelectric point (pI) and peak area percentage composition (%PA).The automated method for the SCIEX cIEF Kit on the Biomek i5 MC liquid handler can prepare from 8 to 96 samples in increments of 8 samples. The user can select the preparation of samples and sample inlet tray, reagent inlet and outlet trays and the sample outlet tray. Each section can be run by itself or from start to finish with a single user interface to keep labware and reagents on deck. The SCIEX cIEF Kit on Biomek i5 MC automated method provides:
- Reduced time on manual sample preparation
- Increased pipetting accuracy with automated sample preparation
- Efficient implementation with a ready-to-use method
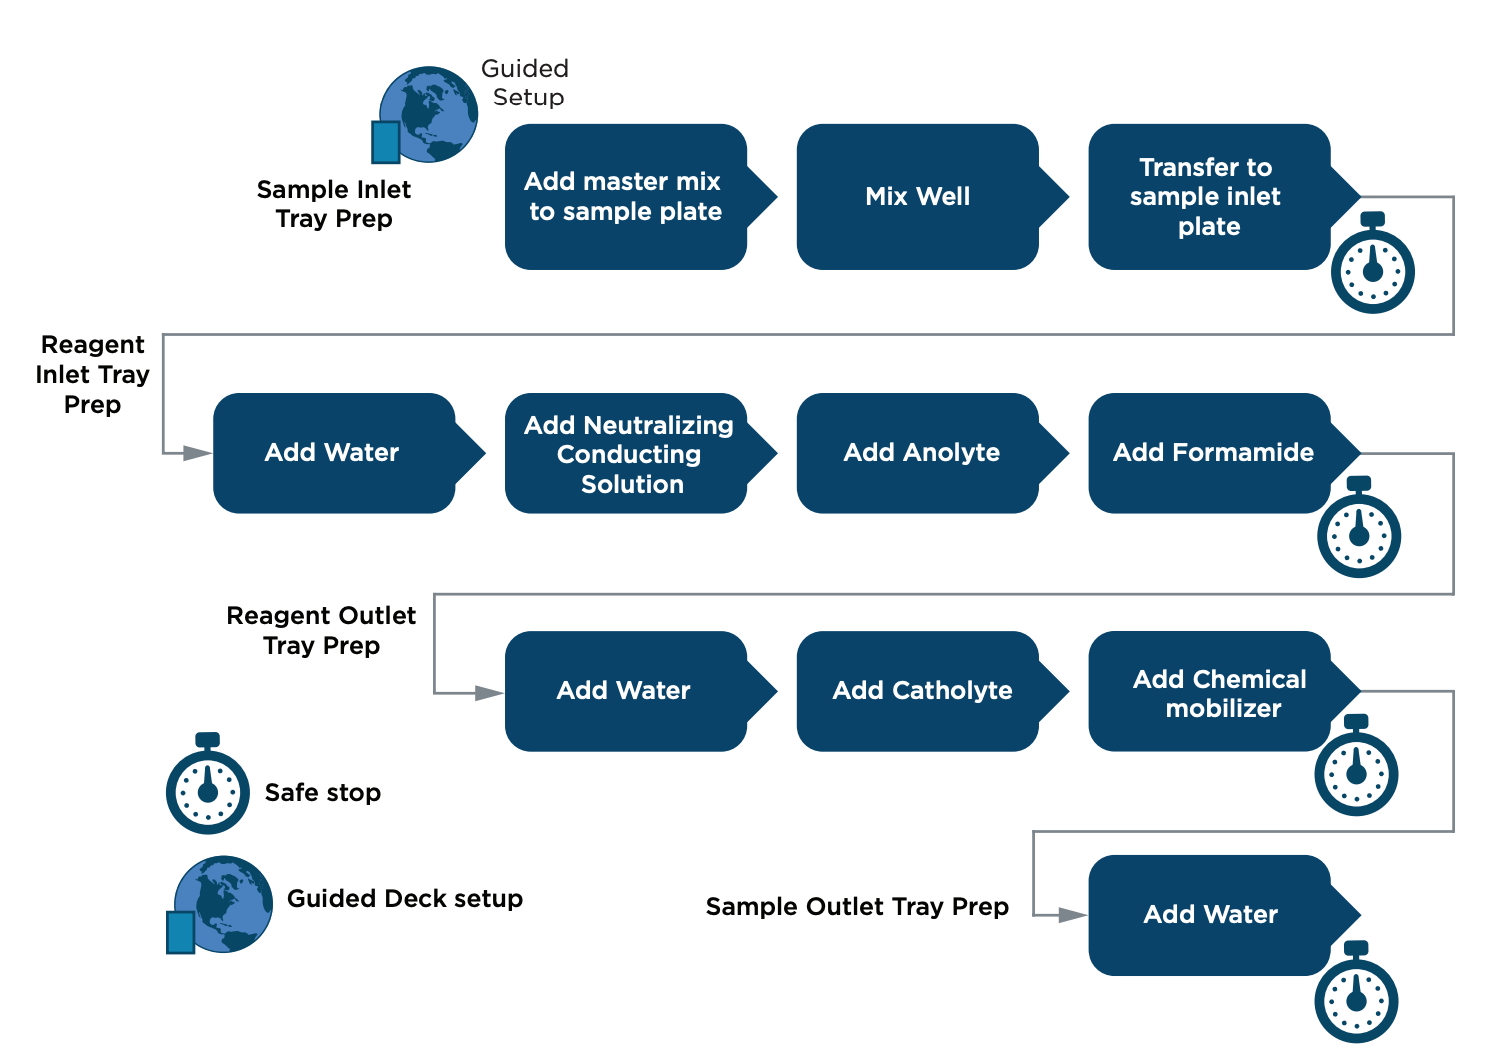
Figure 1: Workflow of an automated method for the Capillary Isoelectric Focusing (cIEF) Kit for BioPhase 8800 system on the Biomek i5 MC Workstation.
Spotlight
The Biomek i5 MC Automated Workstation features a multichannel pipetting head and flexible configurations to increase walk-away time.
The workstation features include:
- 96 head (300-1200 µL pipetting capability)
- 360˚ rotating gripper with offset fingers
- Guided Labware Setup (GLS)
- DeckOptix Final Check to ensure accurate system setup
- Reagent volume calculations
- 96 channel tips washing for sample processing and bead-based cleanups
- High deck capacity with 25 positions
The Biophase 8800 features include:
- 8 neutral capillary cartridges for simultaneous analysis
- Equipped with UV and laser-induced fluorescence (LIF) detection modes; both detectors can be used in the same sequence
- Easy and intuitive front panel control software
- User-friendly method and sequence editor and data analysis software
Figure 2: The Biomek i5 MC automated workstation (left), the BioPhase cIEF Analysis kit (center) and BioPhase 8800 system (right)
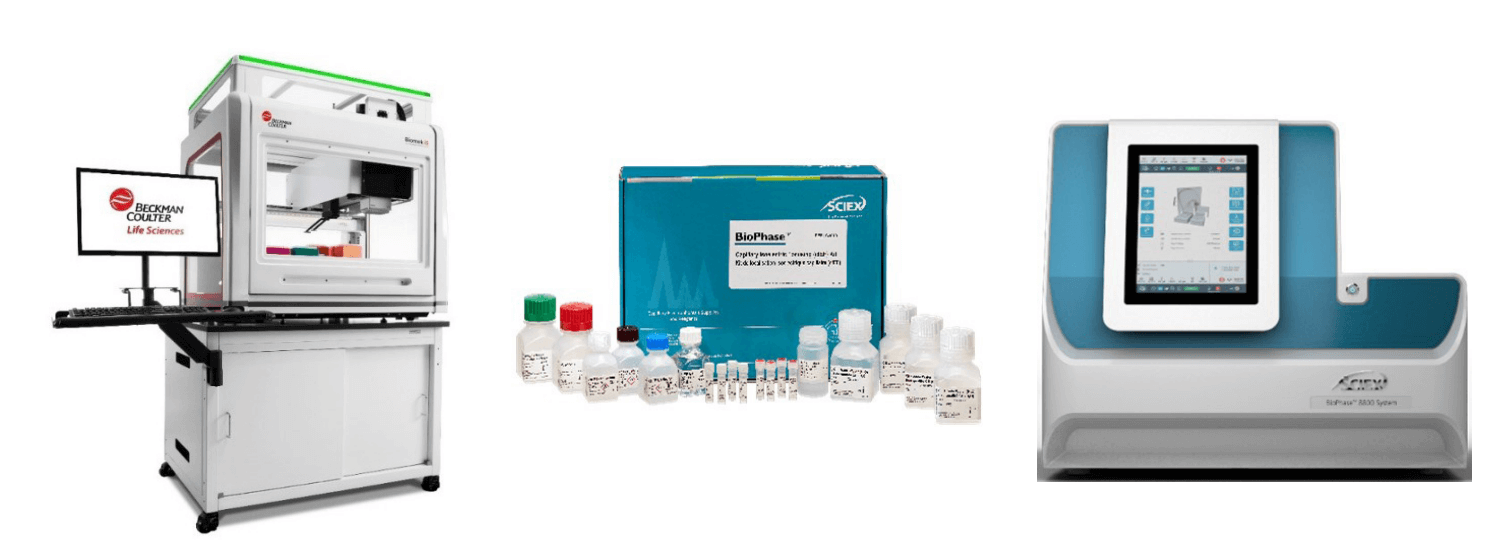
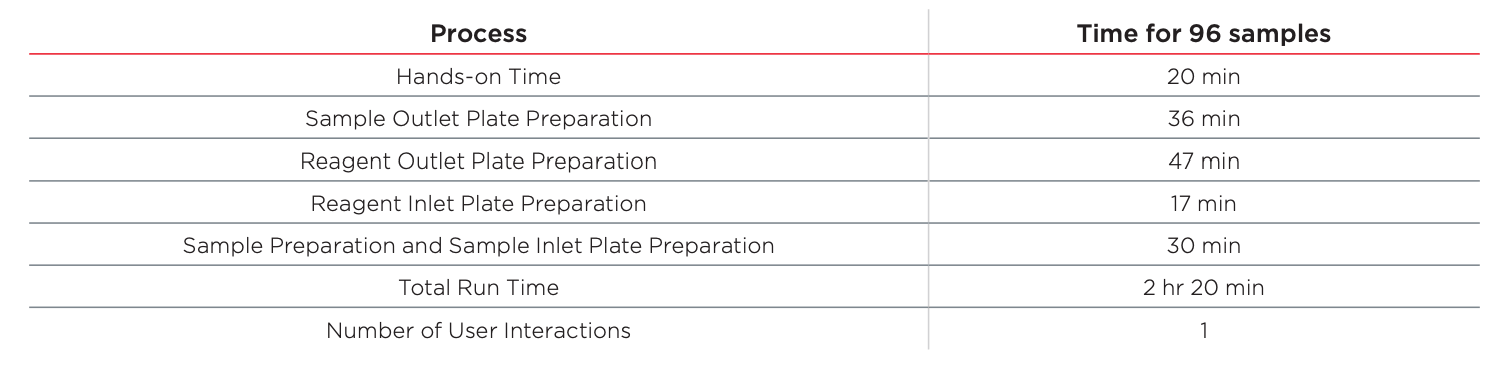
Table 1: Estimated run time for automating SCIEX CE-cIEF Analysis Kit on the Biomek i5 MC Workstation.
The method can be run using Method Option Selector (Figure 3), and Guided Labware Setup to aid with deck setup and reagent calculations (Figure 4), and DeckOptix Final Check software to minimize costly setup errors. Automated methods provide flexibility to users in scheduling their workflow and allow method customization, sample processing and throughput.
Figure 3: SCIEX cIEF automated Method Option Selector (MOS) enables users to select sample number, sample type, and method options for sample preparation, inlet and outlet trays.
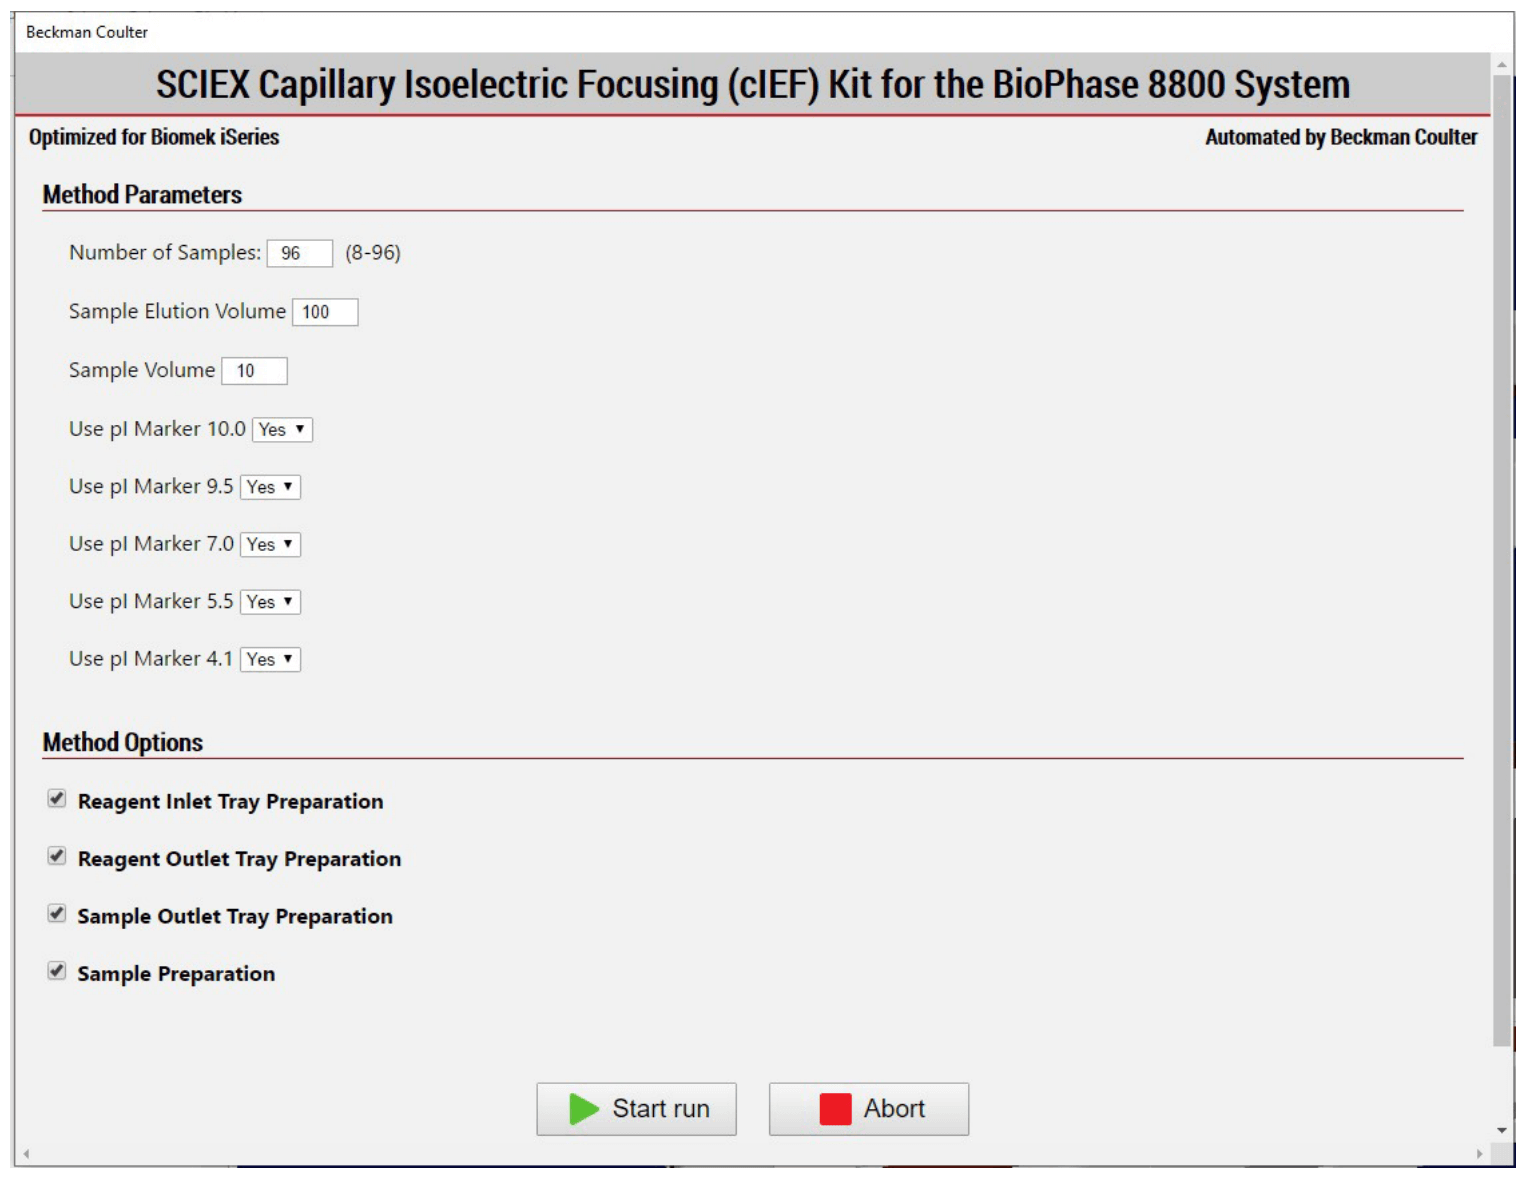
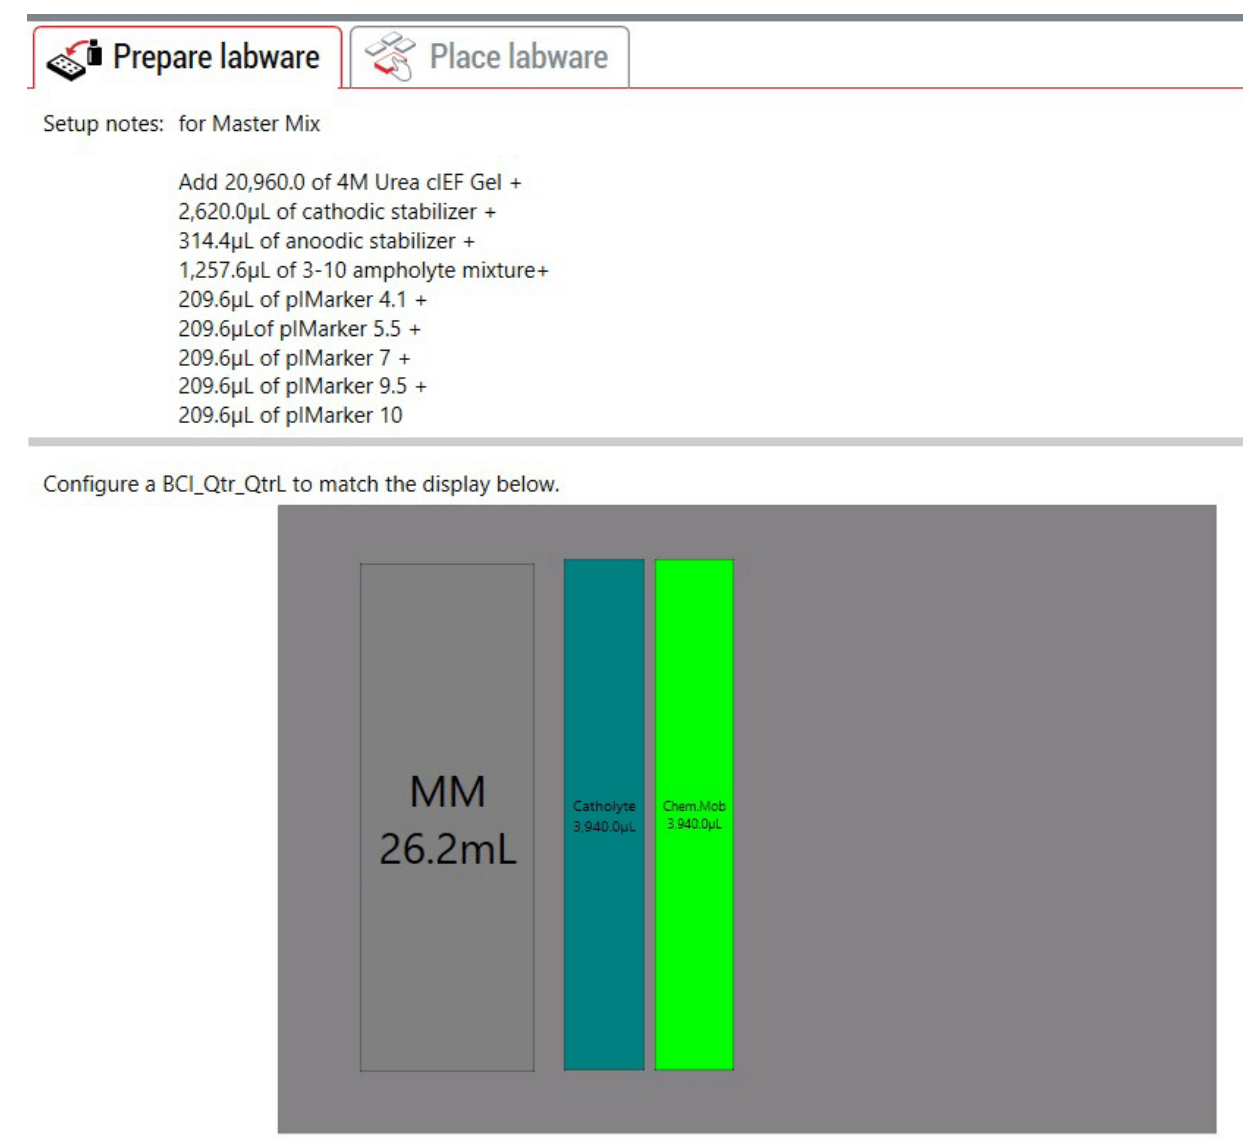
Figure 4: Guided Labware Setup (GLS) provides reagent volumes calculated by sample number, preparation notes, and pictorial guide for user deck setup. The user prepares the master mix according to the labware setup. Note: the fractionated volumes were rounded-up.
Materials
The BioPhase capillary isoelectric focusing (cIEF) kit (PN C30101), containing cIEF cathodic stabilizer, cIEF anodic stabilizer, cIEF gel, cIEF urea, cIEF anolyte, cIEF neutral capillary conditioning solution, cIEF catholyte, cIEF chemical mobilizer, cIEF formamide and CE-grade water was from SCIEX (Framingham, MA). BioPhase sample and reagent plates (PN 5080311), BioPhase sample plates (PN 5080313), BioPhase reagent plates (PN 5080314), BioPhase outlet plates (PN 5080315), BioPhase neutral capillary cartridge, 8 x 30 cm, 50 μm inner diameter (PN 5080119) and cIEF peptide marker kit (PN A58481) were from SCIEX (Framingham, MA). The USP mAb IgG SS RS (PN 1445550) was from USP (Rockville, MD). Pharmalyte IEF carrier ampholytes, broad range 3-10 (PN 17-0456-01) was from Cytiva (Marlborough, MA).
Automated sample preparation procedure highlights
To demonstrate method capabilities for a 96-sample preparation on a Biomek i5 MC workstation, we started with 8 µL per well of a 5 mg/mL USP IgG SS standard in a Axygen® P-96-450V-C 96 Well Clear V-Bottom 550µL Polypropylene Deep Well Plate. 248 µL of the cIEF master mix containing 4M urea cIEF gel, cathodic stabilizer, anodic stabilizer, pharmalyte 3-10, pI markers 4.1, 5.5 and 10 was added individually to each well and tip-mixed for 5 times. The master mix (MM) was manually prepared ahead of time and placed in the trough as shown in Figure 4. The master mix composition follows the instructions in the cIEF for BioPhase 8800 application guide.4 100 µL of the prepared samples were transferred to the BioPhase sample inlet tray. The sample inlet plate was then placed into the BioPhase 8800 system for electrophoretic separation. All solutions for the inlet reagent plate were pipetted column-wise, as provided in the user guide. For the reagent outlet plate a single tip was used for each reagent. After the Biomek i5 MC workstation completed the method, all 4 trays were placed directly into the BioPhase 8800 system.
Capillary electrophoretic separation highlights
A new neutral coated capillary cartridge was conditioned with water and capillary conditioning solution rinsed at 70 psi for 20 minutes for each solution 24 hours prior to experimentation. After the preparation of the samples as described in the previous section, a sequence comprised of capillary conditioning, a separation method repeated 12 times (full 96 well plate) and a final shutdown method were performed in under 12 hours. The cIEF electropherograms were analyzed using the BioPhase Analysis software (Version 1.2).4
Results
Accuracy and intermediate precision for cIEF analysis of USP mAb IgG SS RS.
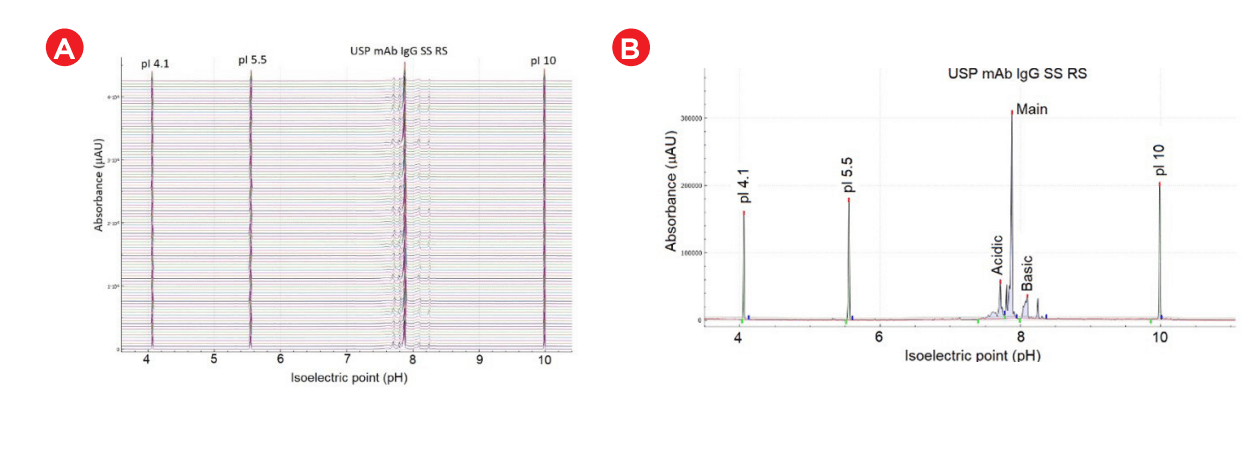
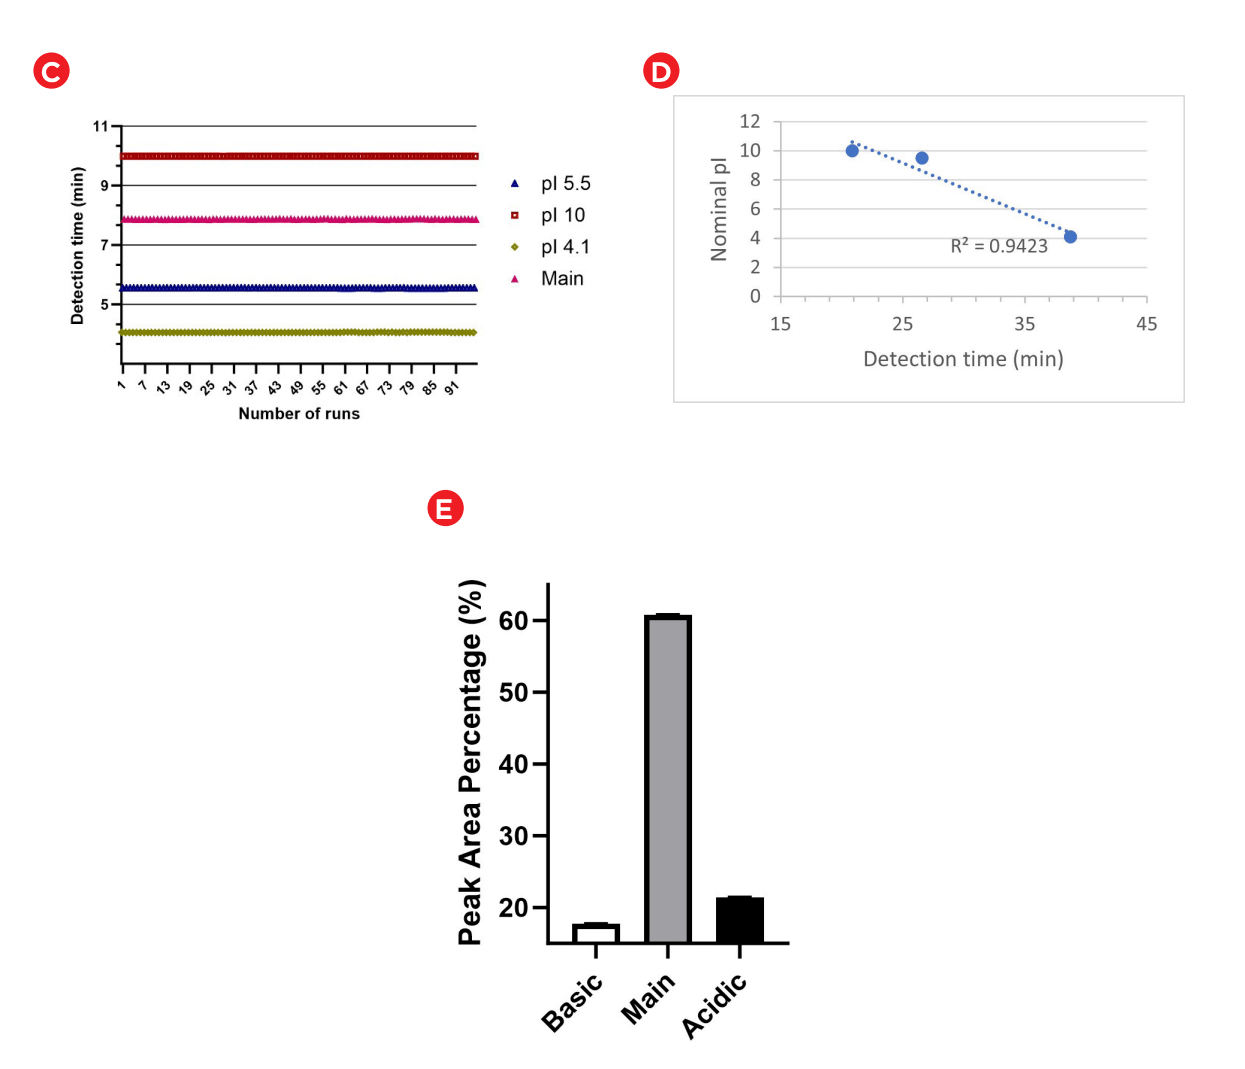
The accuracy of pI determination of the USP mAb IgG SS RS was assessed and representative results are presented in Figure 5. Panel A is the electrogram overlay from 96 samples. Panel B shows the electropherogram from a single run with peak identification and peak name displayed in annotation. Panel D illustrates excellent curve fitting with an R-square value of 0.94, indicating high accuracy of pI determination5 . The 96 data points collected across the sample plate for the detection time and calculated pI of the known 3 (4.1, 5.5 and 10) and the main isoform are plotted in Panel C of Figure 5. Excellent intermediate precision was demonstrated for the calculated pI value.
Robustness across sample preparation with cIEF analysis for the USP mAb IgG SS RS.
In Figure 5E each bar represents the average peak area percentage for basic, main or acidic isoforms, calculated from 96 data points collected on the BioPhase 8800 system. Error bars indicate the standard deviation. The Relative standard deviation (RSD) values for peak area percentage across all data points were 1.5%, 0.67% and 1.5% for basic, main and acidic isoforms, respectively indicating robustness across sample preparation.
 Click to enlarge
Figure 5: (A) Electrogram of 96 samples (USP IgG SS RF). Peak 1 is the pI 4.1, peak 2 is the pI 5.5, peak 3 is the acidic group, peak 5 is the main group, peak 6 is the basic group and peak 7 is the pI 10. The different colors (A-H) denote the 8- capillary numbers with first run starting at the top. (B) Electropherogram with absorbance and pI value indicated by the y- and x-axes, respectively. Each peak is annotated with peak number and peak name. (C) Plot of detection time for the 96 runs for pI 4.1 (olive), pI 5.5 (blue), main group (pink) and pI 10 (maroon). (D) The standard curve used to calculate the pI value with R-square value of 0.94. (E) Graph shows assay robustness with a plot of peak area percentage values for different isoforms of USP mAb IgG SS RS).
High intra- and inter-capillary reproducibility of cIEF analysis of USP mAb IgG SS RS.
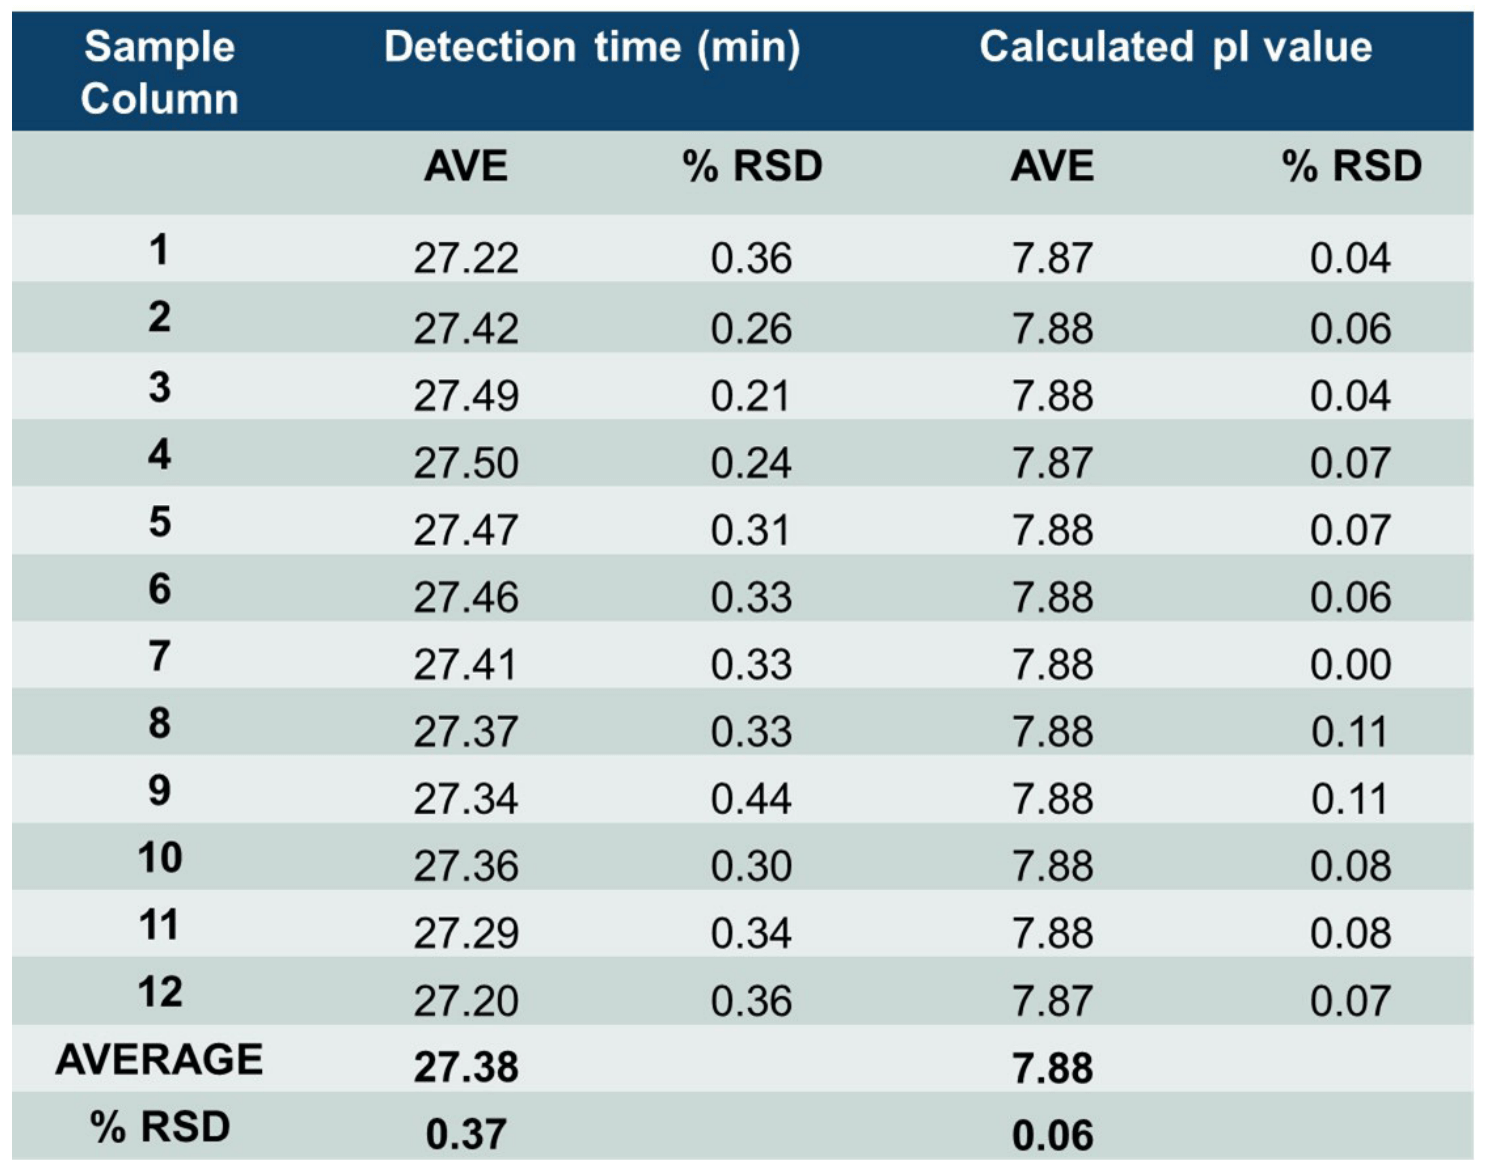
The neutral cartridge for cIEF analysis contains 8 different capillaries, thus consistency between results obtained from different injections from the same capillary (intra-capillary reproducibility) and consistency between results obtained from different capillaries (inter-capillary reproducibility) were assessed. Table 2 summarizes high intra-capillary reproducibility in analysis of the peak area percentages (%PA) of the basic, main and acidic isoforms of the UPS IgG SS RS. Each value in the “AVE” column represents the average value from 12 data points collected for each capillary. The corresponding RSD values are listed in the column labeled with “%RSD.” RSD values for %PA of basic, main, and acidic isoforms for each capillary were less than 1.63%, 0.96% and 2.01% respectively. The average values for %PA for all 8 capillaries were similar, with RSD values of 0.68%, 0.24% and 0.53% for the basic, main, and acidic isoforms, respectively. Therefore, these results demonstrate excellent inter-capillary reproducibility as well. Similarly, outstanding intra-capillary reproducibility and consistency were demonstrated for detection time and calculated pI values. These values for the main isoform of UPS IgG SS RS are presented in Table 3. RSD values for detection time and calculated pI values for each capillary were less than 0.52% and 0.11%, respectively, for the main isoform. In addition, the average values for detection time and calculated pI value for all 8 capillaries were close, with RSD values of 0.29% and 0.04% for detection time and calculated pI value respectively. These results indicate remarkable consistency between the 8 capillaries. Similar results were obtained for the basic and acidic isoforms (data not shown). Detection time and calculated pI values were also compared between capillaries to test inter-capillary reproducibility. Table 4 reports the average values from 8 capillaries per sample column for the main isoform of UPS IgG SS RS. RSD values for detection time and calculated pI values per sample column were less than 0.44% and 0.11%, respectively, indicating high inter-capillary reproducibility.
Furthermore, average values for detection time and calculated pI value for all 12 columns were comparable, with RSD values of 0.37% and 0.06% for detection time and calculated pI value respectively. These results demonstrate excellent reproducibility between different sample columns. Similar results were obtained for the basic and acidic isoforms (data not shown). Together, the results presented in Tables 2, 3 and 4 demonstrate excellent intra- and inter-capillary and overall reproducibility of cIEF analysis on the BioPhase 8800 system and remarkable consistency in the sample preparation using the Biomek i5 MC workstation.
Table 2: Reproducibility of cIEF analysis for USP mAb IgG SS RS isoforms on a BioPhase 8800 system. Numbers in “AVE” and “%RSD” columns are average peak area percentage and %RSD from 12 data points per capillary for the Basic or Main or Acidic isoforms. Numbers in rows named “AVE” and %RSD” were calculated using the average values across eight capillaries. AVE: average
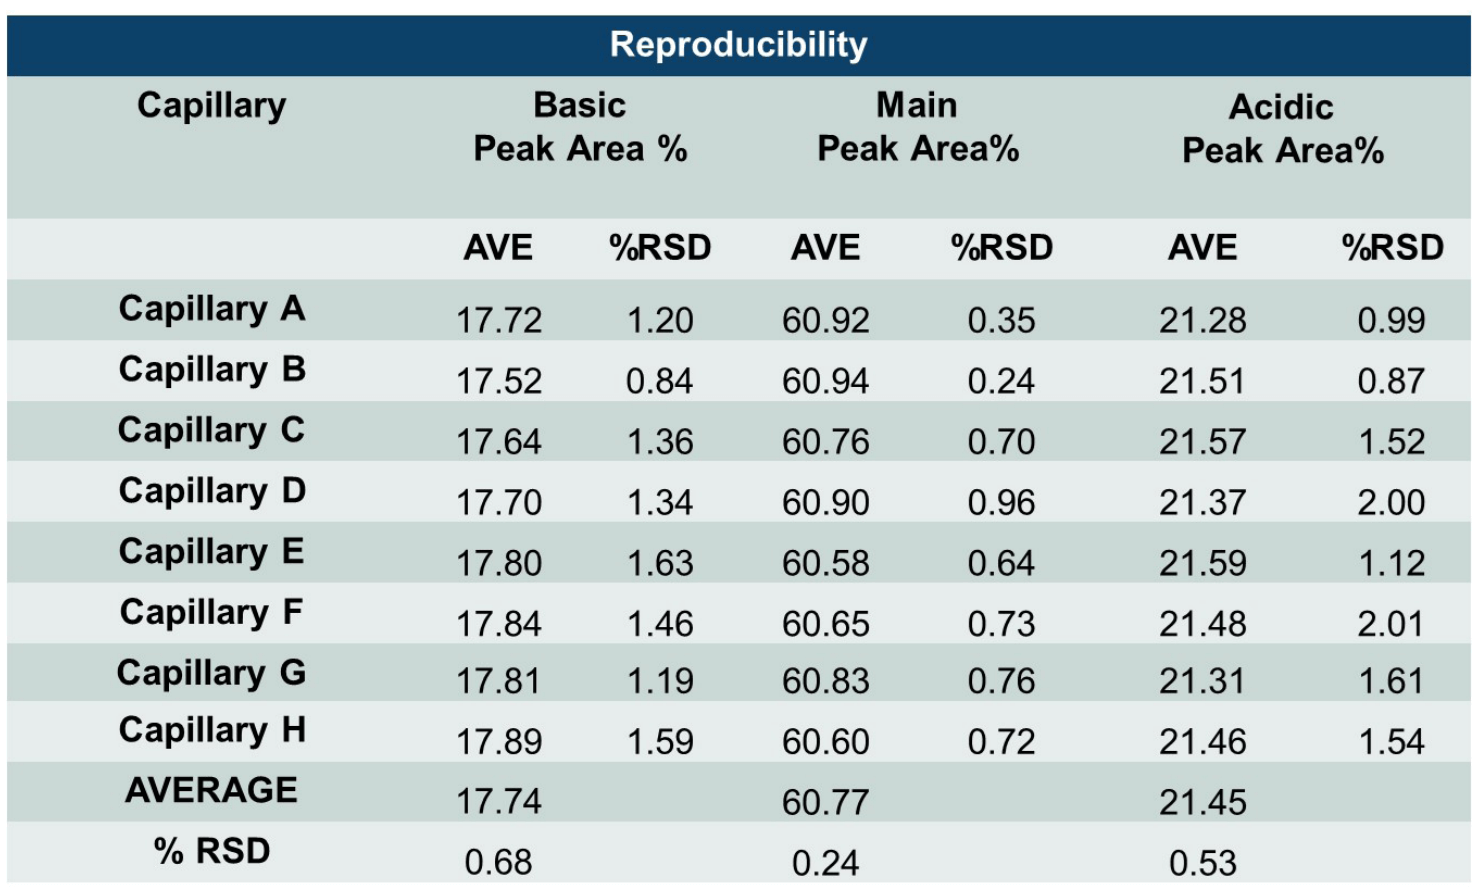
Table 3: High reproducibility of raw detection time and calculated pI values for the main isoform of UPS IgG SS RS. Values in “Average” and “%RSD” columns were calculated from 12 data points per capillary. Values in “AVE” and “%RSD” rows were calculated using the average values across eight capillaries.
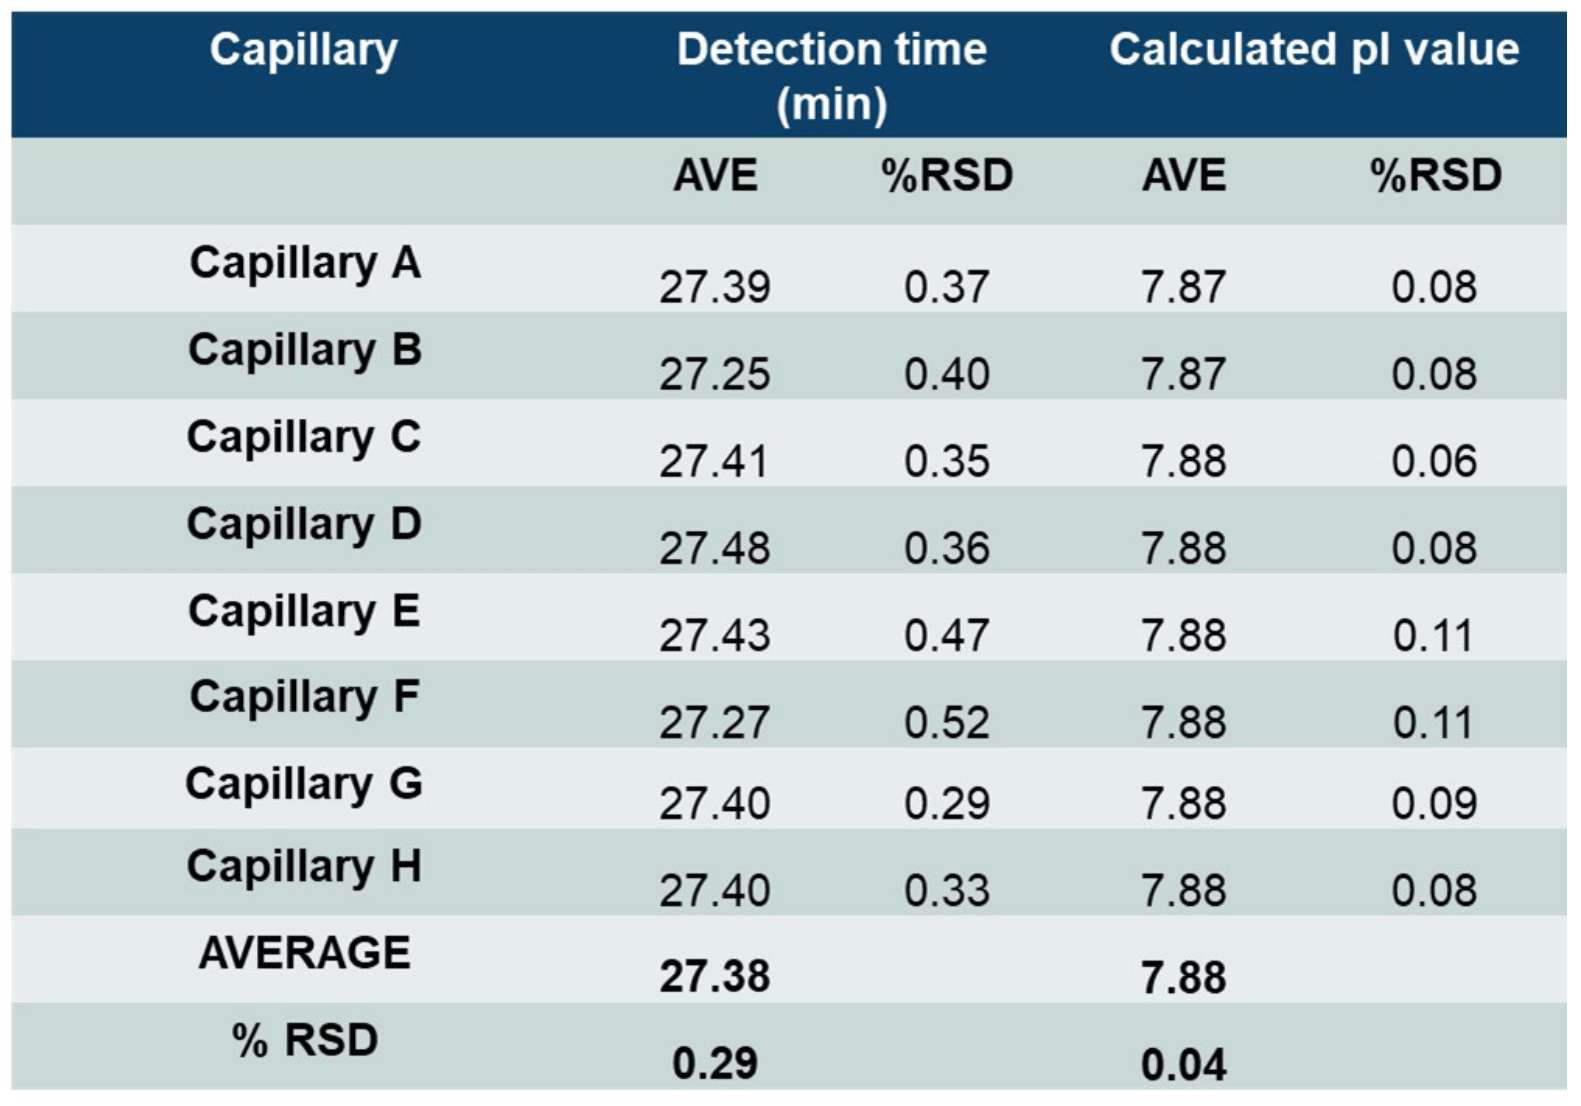
Table 4: High inter-capillary reproducibility of raw detection time and calculated pI values for the main isoform of UPS IgG SS RS. Values in “Average” and “%RSD” columns were calculated from 8 capillaries per sample column. Values in “AVE” and “%RSD” rows were calculated using the average values across 12 sample columns.
Conclusion
- Automated sample and reagent inlet and outlet plate preparation on the Biomek i5 MC workstation eliminates labor-intensive bench work and provides higher throughput for cIEF analysis with highly consistent results when combined with the BioPhase 8800 system.
- Robust automated sample preparation yielded excellent intra-capillary and inter-capillary reproducibility data for Peak area %, Detection time and calculated pI.
- Inter-capillary reproducibility values for % RSD for PA% were less than 0.64, 0.24 and 0.53 for basic, main, and acidic groups, respectively.
- Inter-capillary reproducibility values for % RSD for Detection Time were less than 0.51, 0.46 and 0.44 for basic, main, and acidic groups, respectively.
References
- Singh, S., et al., Monoclonal Antibodies: A Review. Curr Clin Pharmacol, 2018. 13(2): p. 85-99.
- Runcie, K., et al., Bi-specific and tri-specific antibodies—the next big thing in solid tumor therapeutics. Mol Med, 2018, 24(1): p. 50
- F. Wang , A. Guttman, M. Lies, S. Mollah. Rapid and reproducible parallel processing of charge heterogeneity analysis of protein therapeutics by multi-capillary isoelectric focusing, RUO-MKT-2-13492-A.
- Capillary Isoelectric Focusing (cIEF) Kit for BioPhase 8800 system application guide, RUO-IDV-05-8651-A
- Shimura, K., Zhi, W., Matsumoto, H., Kasai, K.-i., Anal. Chem. 2000, 72, 4747–4757. Righetti, P. G., J. Chromatogr. A 2004, 1037, 491–499.