Comprehensive differentiation of deamidation isomers from forced degradation by electron activation dissociation (EAD)
Featuring the ZenoTOF 7600 system from SCIEX
Haichuan Liu and Zoe Zhang
Biologics
SCIEX, USA
Introduction
This technical note highlights the power of electron activation dissociation (EAD) for comprehensive characterization of complex deamidation profiles often encountered during stability studies of biotherapeutic proteins. The co-existence of multiple aspartic (Asp) and isoaspartic acid (isoAsp) isomers poses an analytical challenge to chromatographic and collision-based MS/MS approaches. This challenge can be addressed by using EAD.
Deamidation changes the charge profile and stability of protein therapeutics, which can affect lot release.1 Therefore, it is critical to fully characterize deamidation in different phases of drug development, such as, stability testing. However, detailed characterization of deamidation remains a daunting task for traditional collision-based MS/MS approaches due to the challenge in differentiation of Asp vs. isoAsp isomers, particularly in forced degradation samples with high heterogeneity and complexity. By comparison, EAD was successfully employed to differentiate deamidation isomers in different modalities due to its unique ability to generate signature fragments for Asp/isoAsp.2–4
In this technical note, EAD was utilized to elucidate a complex deamidation profile of a thermally stressed synthetic peptide, commonly found in the conserved region of antibody sequences. Multiple deamidation isomers co-exist in this peptide, which cannot be fully separated chromatographically.
Key features of EAD for comprehensive characterization of deamidation
- Unambiguous differentiation of isomers: EAD generates signature fragments that allow for differentiation of Asp and isoAsp isomers
- High quality EAD data: The Zeno trap of the ZenoTOF 7600 system provides 5–10-fold increase in detection of MS/MS fragments, leading to excellent quality of EAD data for confident identification of low abundance deamidation species
- Intuitive: An EAD platform method provides most descriptive results for the characterization of a wide range of peptides with 1 electron kinetic energy (KE) setting
- Fast and flexible: EAD can be operated in data-dependent acquisition (DDA) or MRMHR mode with fast scanning (~20 Hz in DDA mode) and the ability to tune the electron KE
Figure 1. Elucidation of a complex deamidation profile using the SCIEX ZenoTOF 7600 system (left). EAD is powerful for unambiguous differentiation of isomeric deamidation species (Asp vs. isoAsp) even in the challenging cases where multiple isomers co-exist and cannot be fully separated chromatographically (right). The differentiation of Asp/isoAsp was based on the detection of signature fragments of these isomers (an example of signature z‒57 for isoAsp and z‒44 for Asp was shown in the middle spectrum). In the chromatogram displayed on the right, the major isomers of the singly (green), doubly (blue) and triply (orange) deamidated species of a thermally stressed peptide were highlighted. See the main text for complete peak assignments.

Methods
Sample preparation: The synthetic peptide GFYPSDIAVEWESNGQPENNYK (abbreviated as PENNYK), which corresponds to amino acid residues of 374–395 in NISTmAb, was obtained from AnaSpec Inc. A control sample of the PENNYK peptide was prepared in water at 10µM. In the forced degradation experiment, a 100mM solution of PENNYK in 10mM ammonium bicarbonate was incubated at 60°C for 3 days. The stressed sample was then diluted to a final concentration of 10µM. Twenty µL of the control and stressed sample were injected for LC-MS analysis.
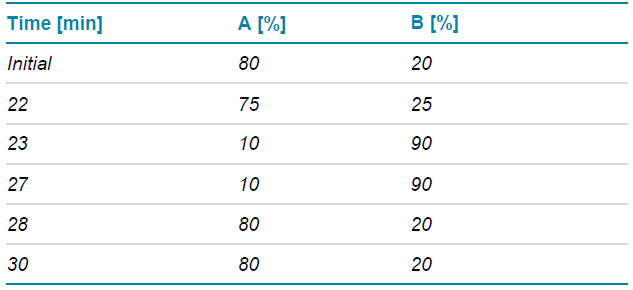
Chromatography: The unmodified and deamidated species of PENNYK peptide were separated with a shallow gradient displayed in Table 1 using an ACQUITY CSH C18 column (2.1 × 150 mm, 1.7 µm, 130 Å, Waters). A flow rate of 0.25 mL/min was used for the separation. The column was kept at 60ºC in the column oven of an ExionLC system (SCIEX). The mobile phases A and B consisted of 0.1% formic acid (FA) in water and 0.1% FA in acetonitrile, respectively.
Table 1. LC gradient for separation of deamidated species.
Mass spectrometry: EAD MRMHR data of the triply charged PENNYK were acquired in SCIEX OS software using the ZenoTOF 7600 system. The key TOF MS and MRMHR settings are listed in Tables 2 and 3, respectively.
Table 2. TOF MS parameters.
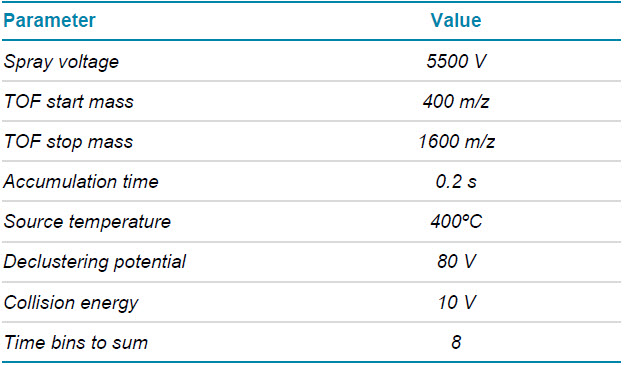
Table 3. EAD MRMHR parameters.

Data processing: The EAD MRMHR data were analyzed using the Explorer module and the Bio Tool Kit software add-on within SCIEX OS software.
Deamidation isomers in the control sample
The PENNYK peptide is located in the conserved Fc region of mAbs. It contains 4 potential deamidation sites, including 3 Asn and 1 glutamine (Gln). Two of these residues, for example, Asn387 and Asn392 in NISTmAb or Asn384 and Asn389 commonly found in other mAbs, are well-known deamidation hot spots, particularly under forced degradation conditions.5 The characterization of deamidation in the PENNYK peptide is hampered by the challenges with chromatographic separation and differentiation of Asp and isoAsp isomers. In this study, EAD was employed to elucidate the complex deamidation profile of this peptide under stressed conditions. The approach described here can also be applied to comprehensive characterization of other deamidation hot spots, including those in the complementary-determining regions (CDRs).1
The synthetic PENNYK sample, which did not undergo heat or pH stress (control), contained predominantly the native form and ~8% of singly deamidated species (Figure 2A). The singly deamidated peptides eluting at RT = 6.0–6.5 min (Figure 2A) were not fully separated under the chromatographic condition employed in this study. However, the deamidation sites in these species could be confidently identified by EAD MS/MS. While the peaks at RT = 6.11 min and 6.36 min corresponded to deamidation at Q389 and N387, respectively, the species at RT = 6.22 min was linked to a mixture of N392- and N393- deamidated peptides based on the m/z and isotopic distributions of z3 and z4 in the EAD MS/MS spectra (Figure 2B and 2C). All asparagine (Asn)-deamidated species detected at RT = 6.22 min and 6.36 min were further assigned as the Asp isomers due to the detection of a z–44 fragment and the absence of a z–57 ion (Figure 2B–2D). These results demonstrate the ability of EAD for accurate localization of deamidation sites and confident differentiation of deamidation isomers without chromatographic baseline separation.
Figure 2. Differentiation of singly deamidated species in the PENNYK peptide without forced degradation. Three singly deamidation isomers (~8%) observed in the extracted ion chromatogram (XIC, A), albeit not fully separated under the chromatographic condition, can be confidently annotated based on deltas of c/z-ions and signature fragments of Asp/isoAsp in the EAD spectra (B–D). The chromatographic peaks at RT=6.11 min and 6.36 min correspond to deamidation at Q389 and N387 (D), respectively. The species detected at RT=6.22 min was a mixture of deamidation at N392 and N393 based on the m/z values and isotopic distributions of z₃ (B) and z₄(C). Specifically, the isotopic distribution of z₃ (B) indicated the co- existence of N392- and N393-deamidation. While m/z=408.20 corresponds to the monoisotopic peak of z₃ from N392 deamidation, where N393 is not deamidated, the abundant peak at m/z=409.19 is primarily based on the monoisotopic peak of z₃ from N393-deamidation. All Asn-deamidated species were assigned as Asp isomers due the presence of a z–44 fragment and the absence of a z–57.

Singly deamidated species from force degradation
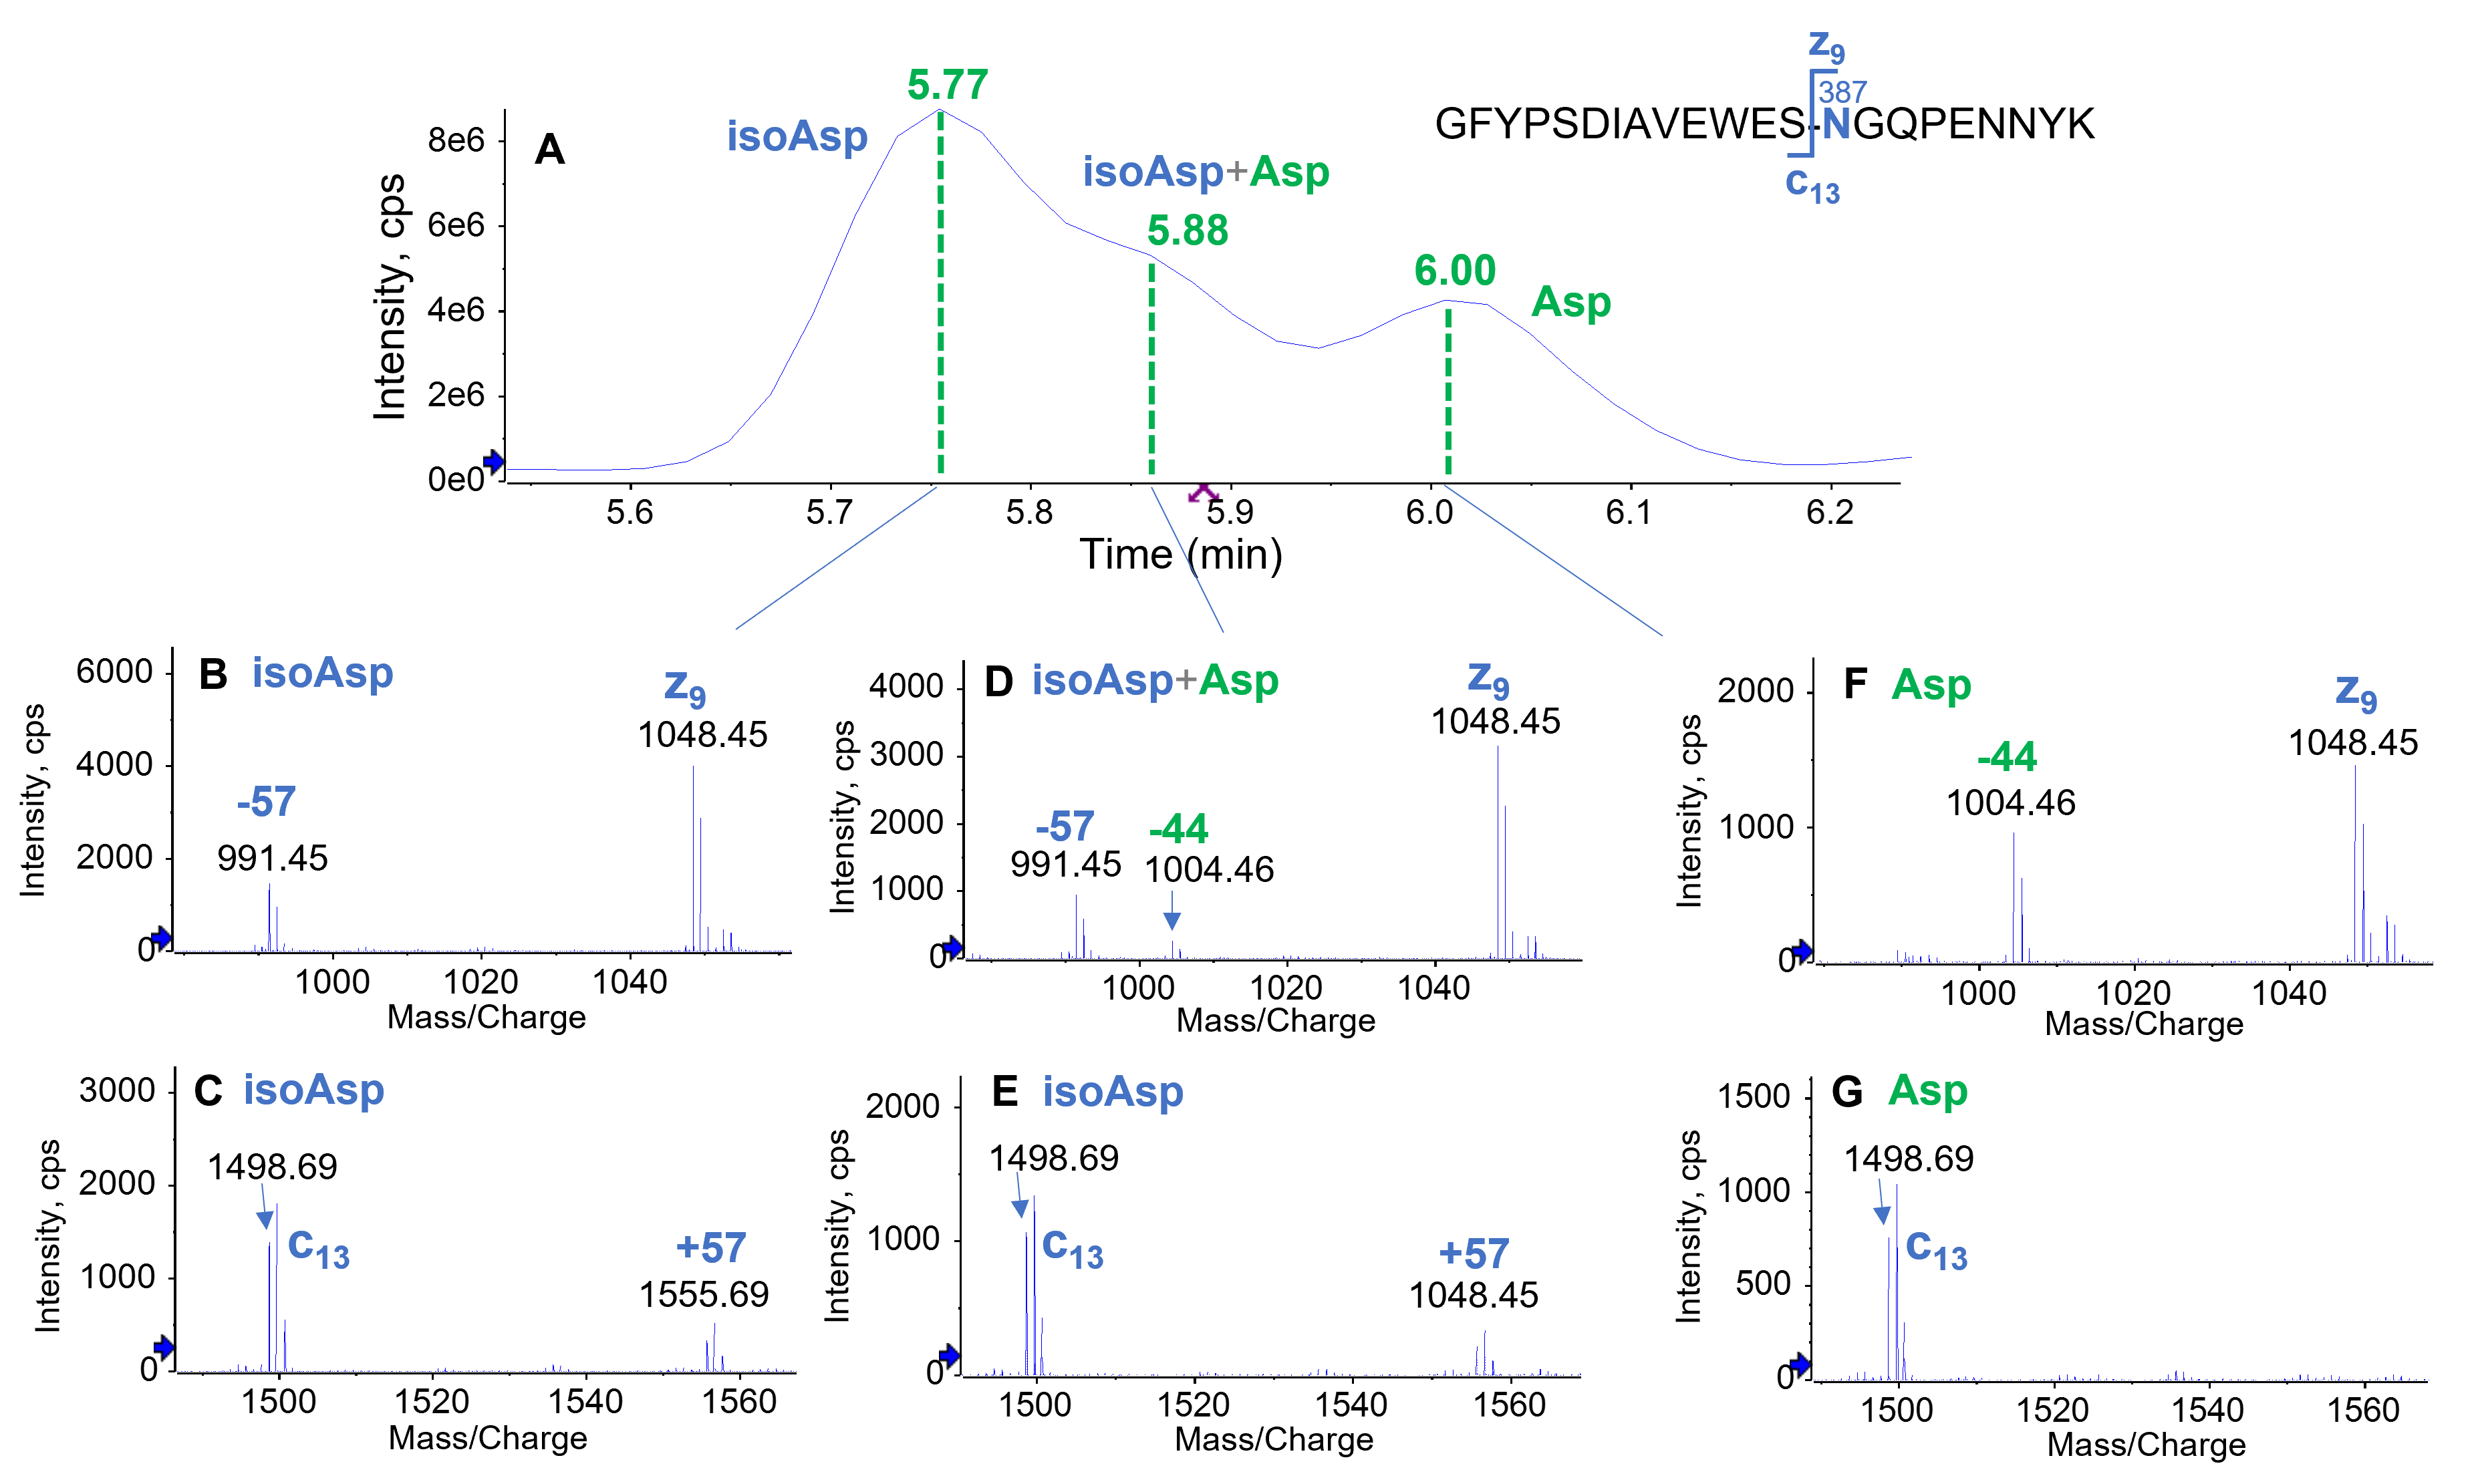
Thermal and pH stress of the PENNYK peptide resulted in extensive deamidation, as displayed in Figure 3. The presence of singly (50.2%), doubly (46%) and triply (0.7%) deamidated species was confirmed by their m/z in the TOF MS data (Figure 3B–3D), which were increased by ~1–3 Da, respectively, compared to the mass of the native form (m/z = 848.72). While the native and 3 groups of deamidated peptides (singly, doubly and triply) were chromatographically baseline separated from one another, the isomers within each group of deamidated peptides were not fully separated. The presence of 4 deamidation sites (3 Asn and 1 Gln) in the PENNYK peptide and 2 isomers (Asp and isoAsp) contributed to the difficulty in separation of these deamidated species. Additionally, the naturally occurring L-isoAsp may undergo racemization to form D-isoAsp, thereby further increasing the complexity of the sample.6,7 Three chromatographic peaks eluting at RT = 5.7–6.2 min were identified to be deamidation of N387 (Figure 4). The major singly deamidated species (RT = 5.77 min) was confidently assigned as the isoAsp isomer (Figure 4A) due to the detection of a z9–57 and c13+57 fragment (Figure 4B and 4C). By comparison, these diagnostic ions for isoAsp were absent in the EAD spectrum of the deamidated peak eluting at RT = 6.00 min (Figure 4F and 4G). Instead, an abundant z9–44 fragment was observed (Figure 4F), indicating that this deamidated species was an Asp isomer. The peak eluting between the Asp and isoAsp isomer (RT = 5.88 min) was a mixture of these 2 species confirmed by the presence of z9–44 and z9–57 in the EAD spectrum (Figure 4D). The presence of isoAsp at RT = 5.88 min was further confirmed by the observation of a c13+57 ion (Figure 4E). Taken together, these results demonstrate that EAD can provide insights into complex deamidation profiles where multiple isomers co-exist.
Figure 3. Forced degradation of PENNYK peptide. The heat and pH stress of the peptide led to significant degradation, resulting in the formation of singly (50.2%), doubly (46.0%) and triply (0.7%) deamidated species, as displayed in the total ion chromatogram (TIC) (A). The presence of these species was confirmed by their m/z and isotopic distributions from the TOF MS data. Shown in B–D are the isotope profiles of the 3+ charge state of the most intense singly (B), doubly (C) and triply (D) deamidated species, with the m/z of the monoisotopic peaks labeled.
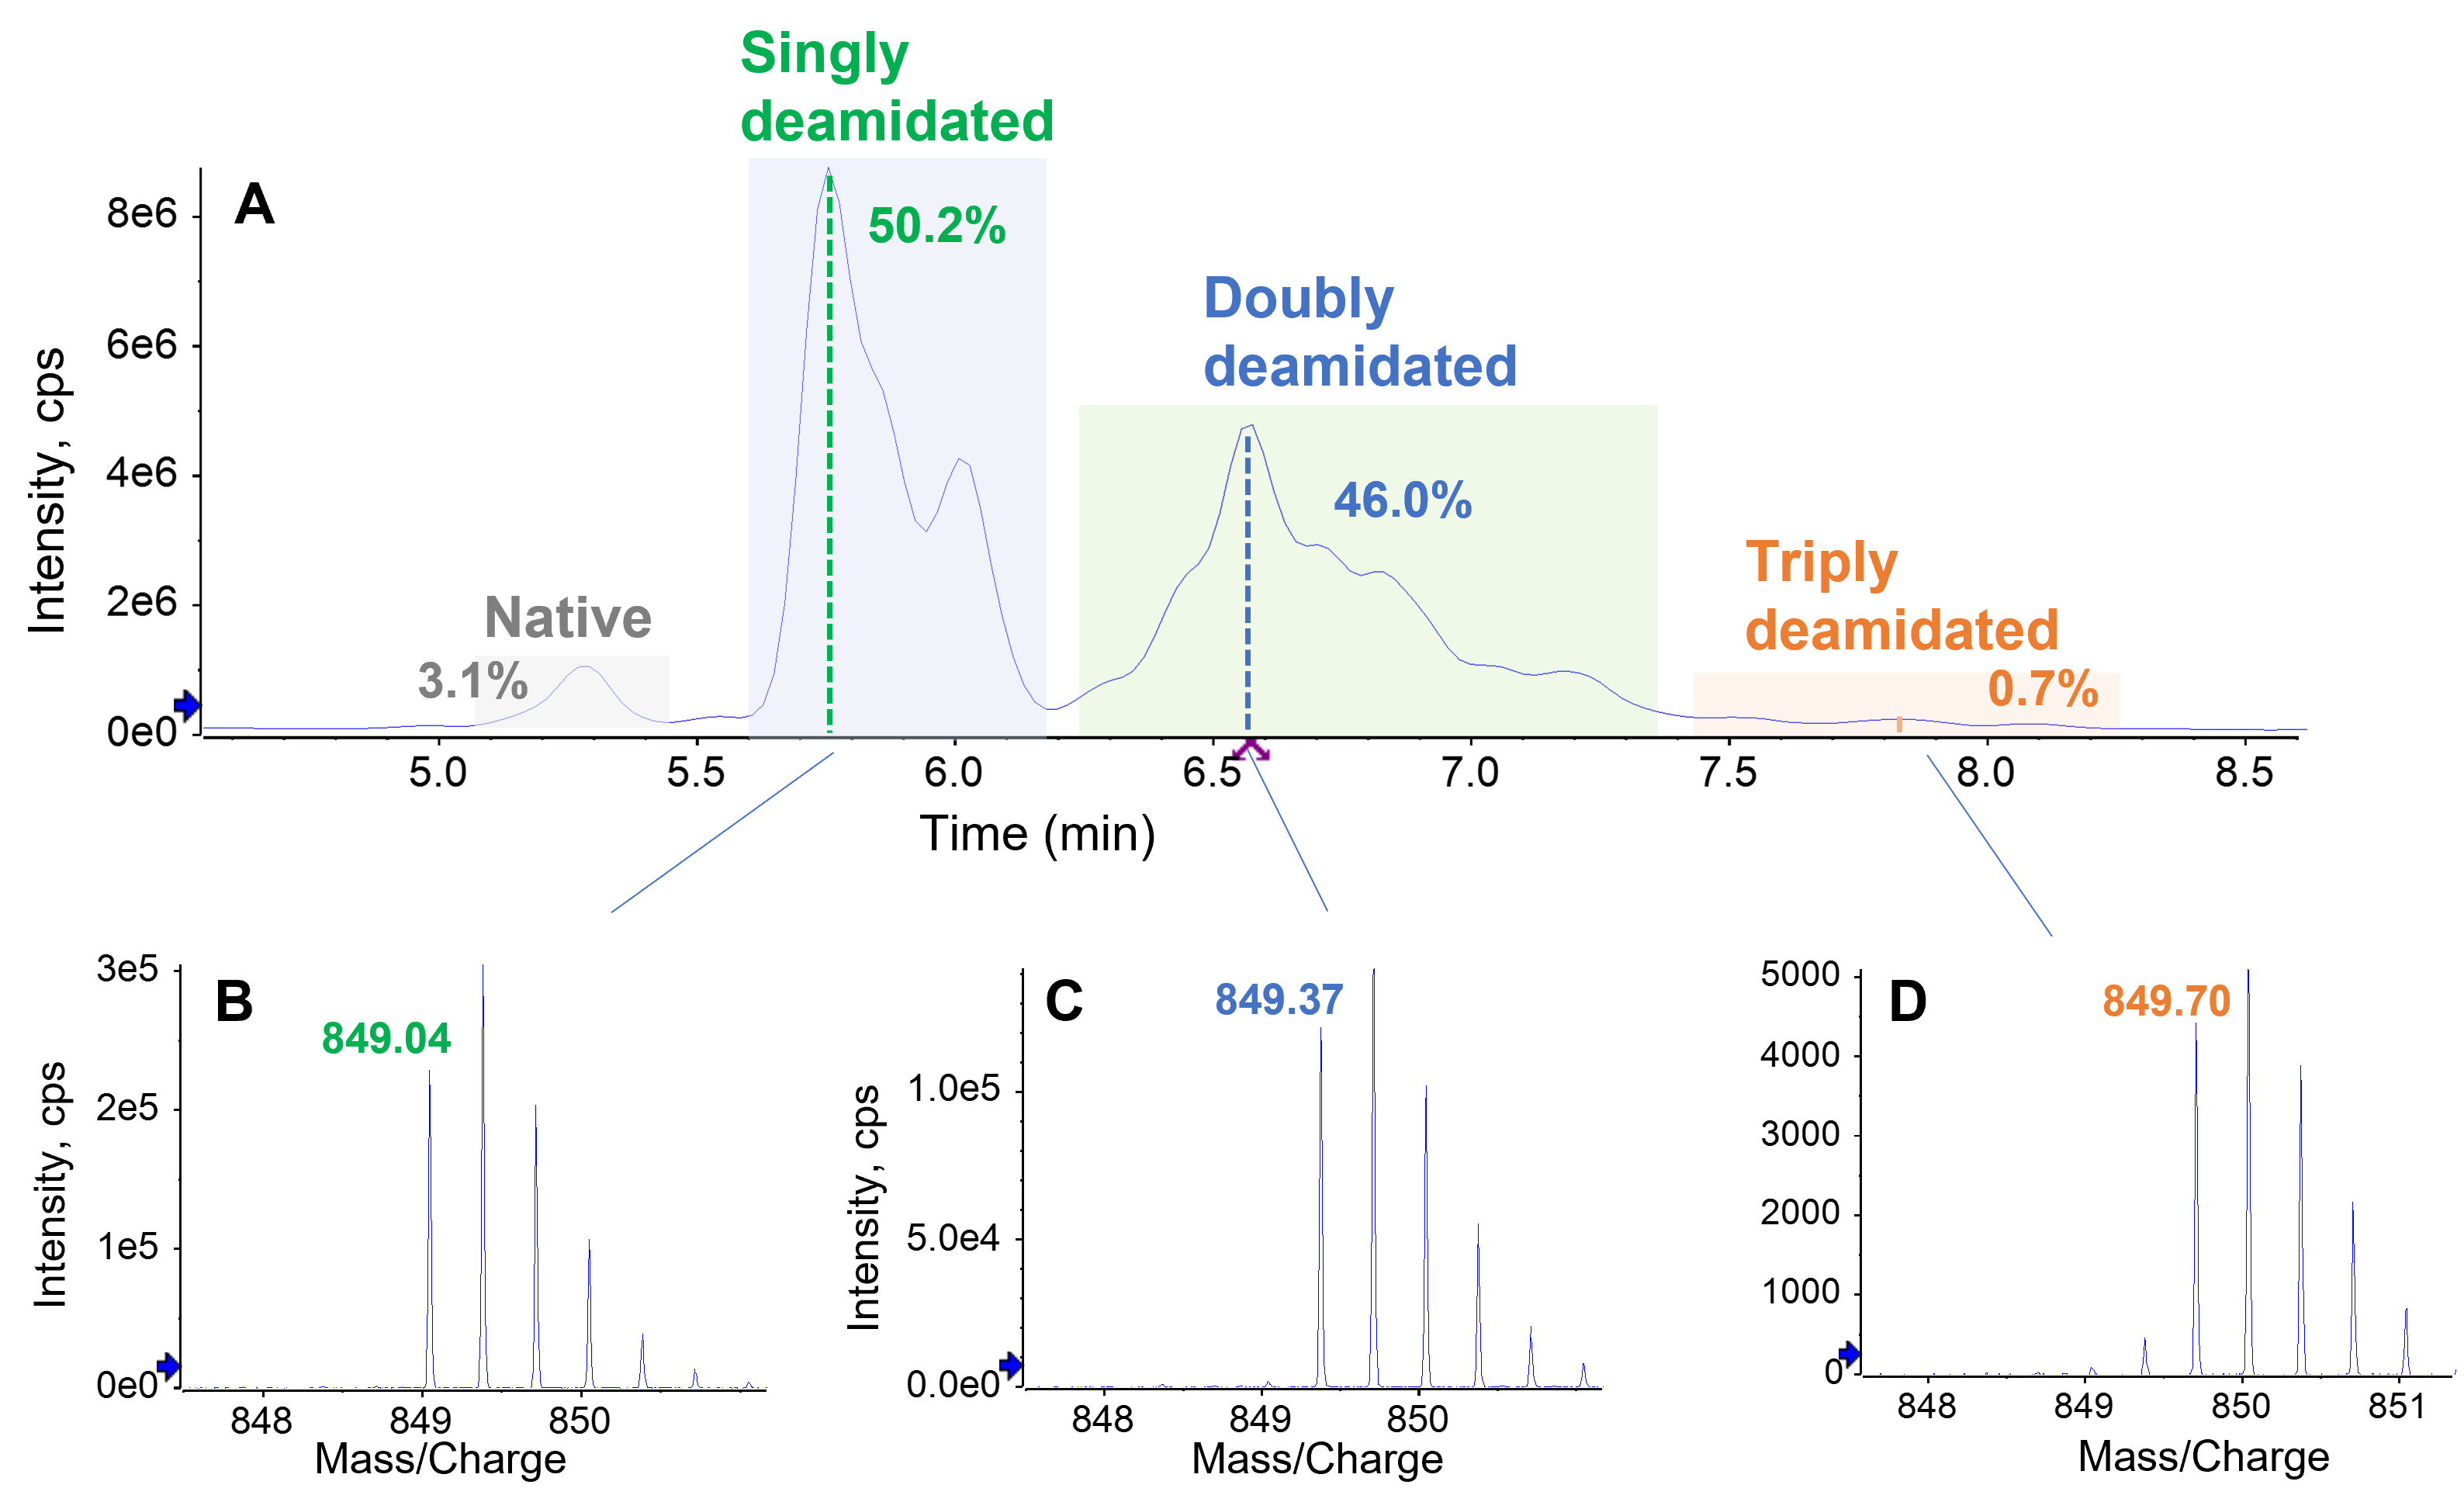
Figure 4. Isomer differentiation of the singly deamidated species detected in the stressed PENNYK sample using EAD. The deamidated species at RT=5.77 min and 6.0 min in the TIC (A) were identified to be the isoAsp and Asp isomers, respectively, based on the detection of signature z₉– 57/c₁₃+57 fragments for isoAsp (B and C) and the presence of z₉–44 for Asp (F). The absence of z₉–57/c₁₃+57 ions for the peak at RT=6.00 min further confirmed the assignment of Asp for this peak (F and G). EAD of the shoulder peak at RT=5.88 min generated both z₉–57 and z₉–44, indicating that this peak contained a mixture of isoAsp and Asp that were not fully separated chromatographically. The presence of isoAsp at RT=5.88 min was verified by the detection of a c₁₃+57 fragment (E).
Multiply deamidated species from force degradation
The profile of the doubly deamidated peptide was very complex, consisting of multiple, chromatographically unresolved peaks (Figure 3A). It is extremely challenging to characterize these deamidation isomers based on their elution pattern or using traditional collision-based MS/MS approaches.
The EAD spectra of 2 selected doubly deamidated versions, eluting at RT = 6.59 min and 7.19 min, are displayed in Figures 5 and 6. The main form (RT = 6.59 min) carried deamidation at N387 and N392 (Figure 5A). Both deamidated Asn were present as the isoAsp form as evident by the detection of the corresponding signature fragments, such as, z9–57/c13+57 for N387 (Figure 5B and 5C) and z4–57/c18+57 for N392 (Figure 5D and 5E).
Figure 5. Isomer differentiation of the most abundant doubly deamidated species in the forced degradation sample using EAD. The doubly deamidated species at RT = 6.59 min in the TIC(A) corresponds to deamidations at N387 and N392, both of which were present as isoAsp as evident by the detection of signature z₄ - 57/c₁₈ + 57 (B and C) and z₉ - 57/c₁₃ + 57 (D and E) fragments.
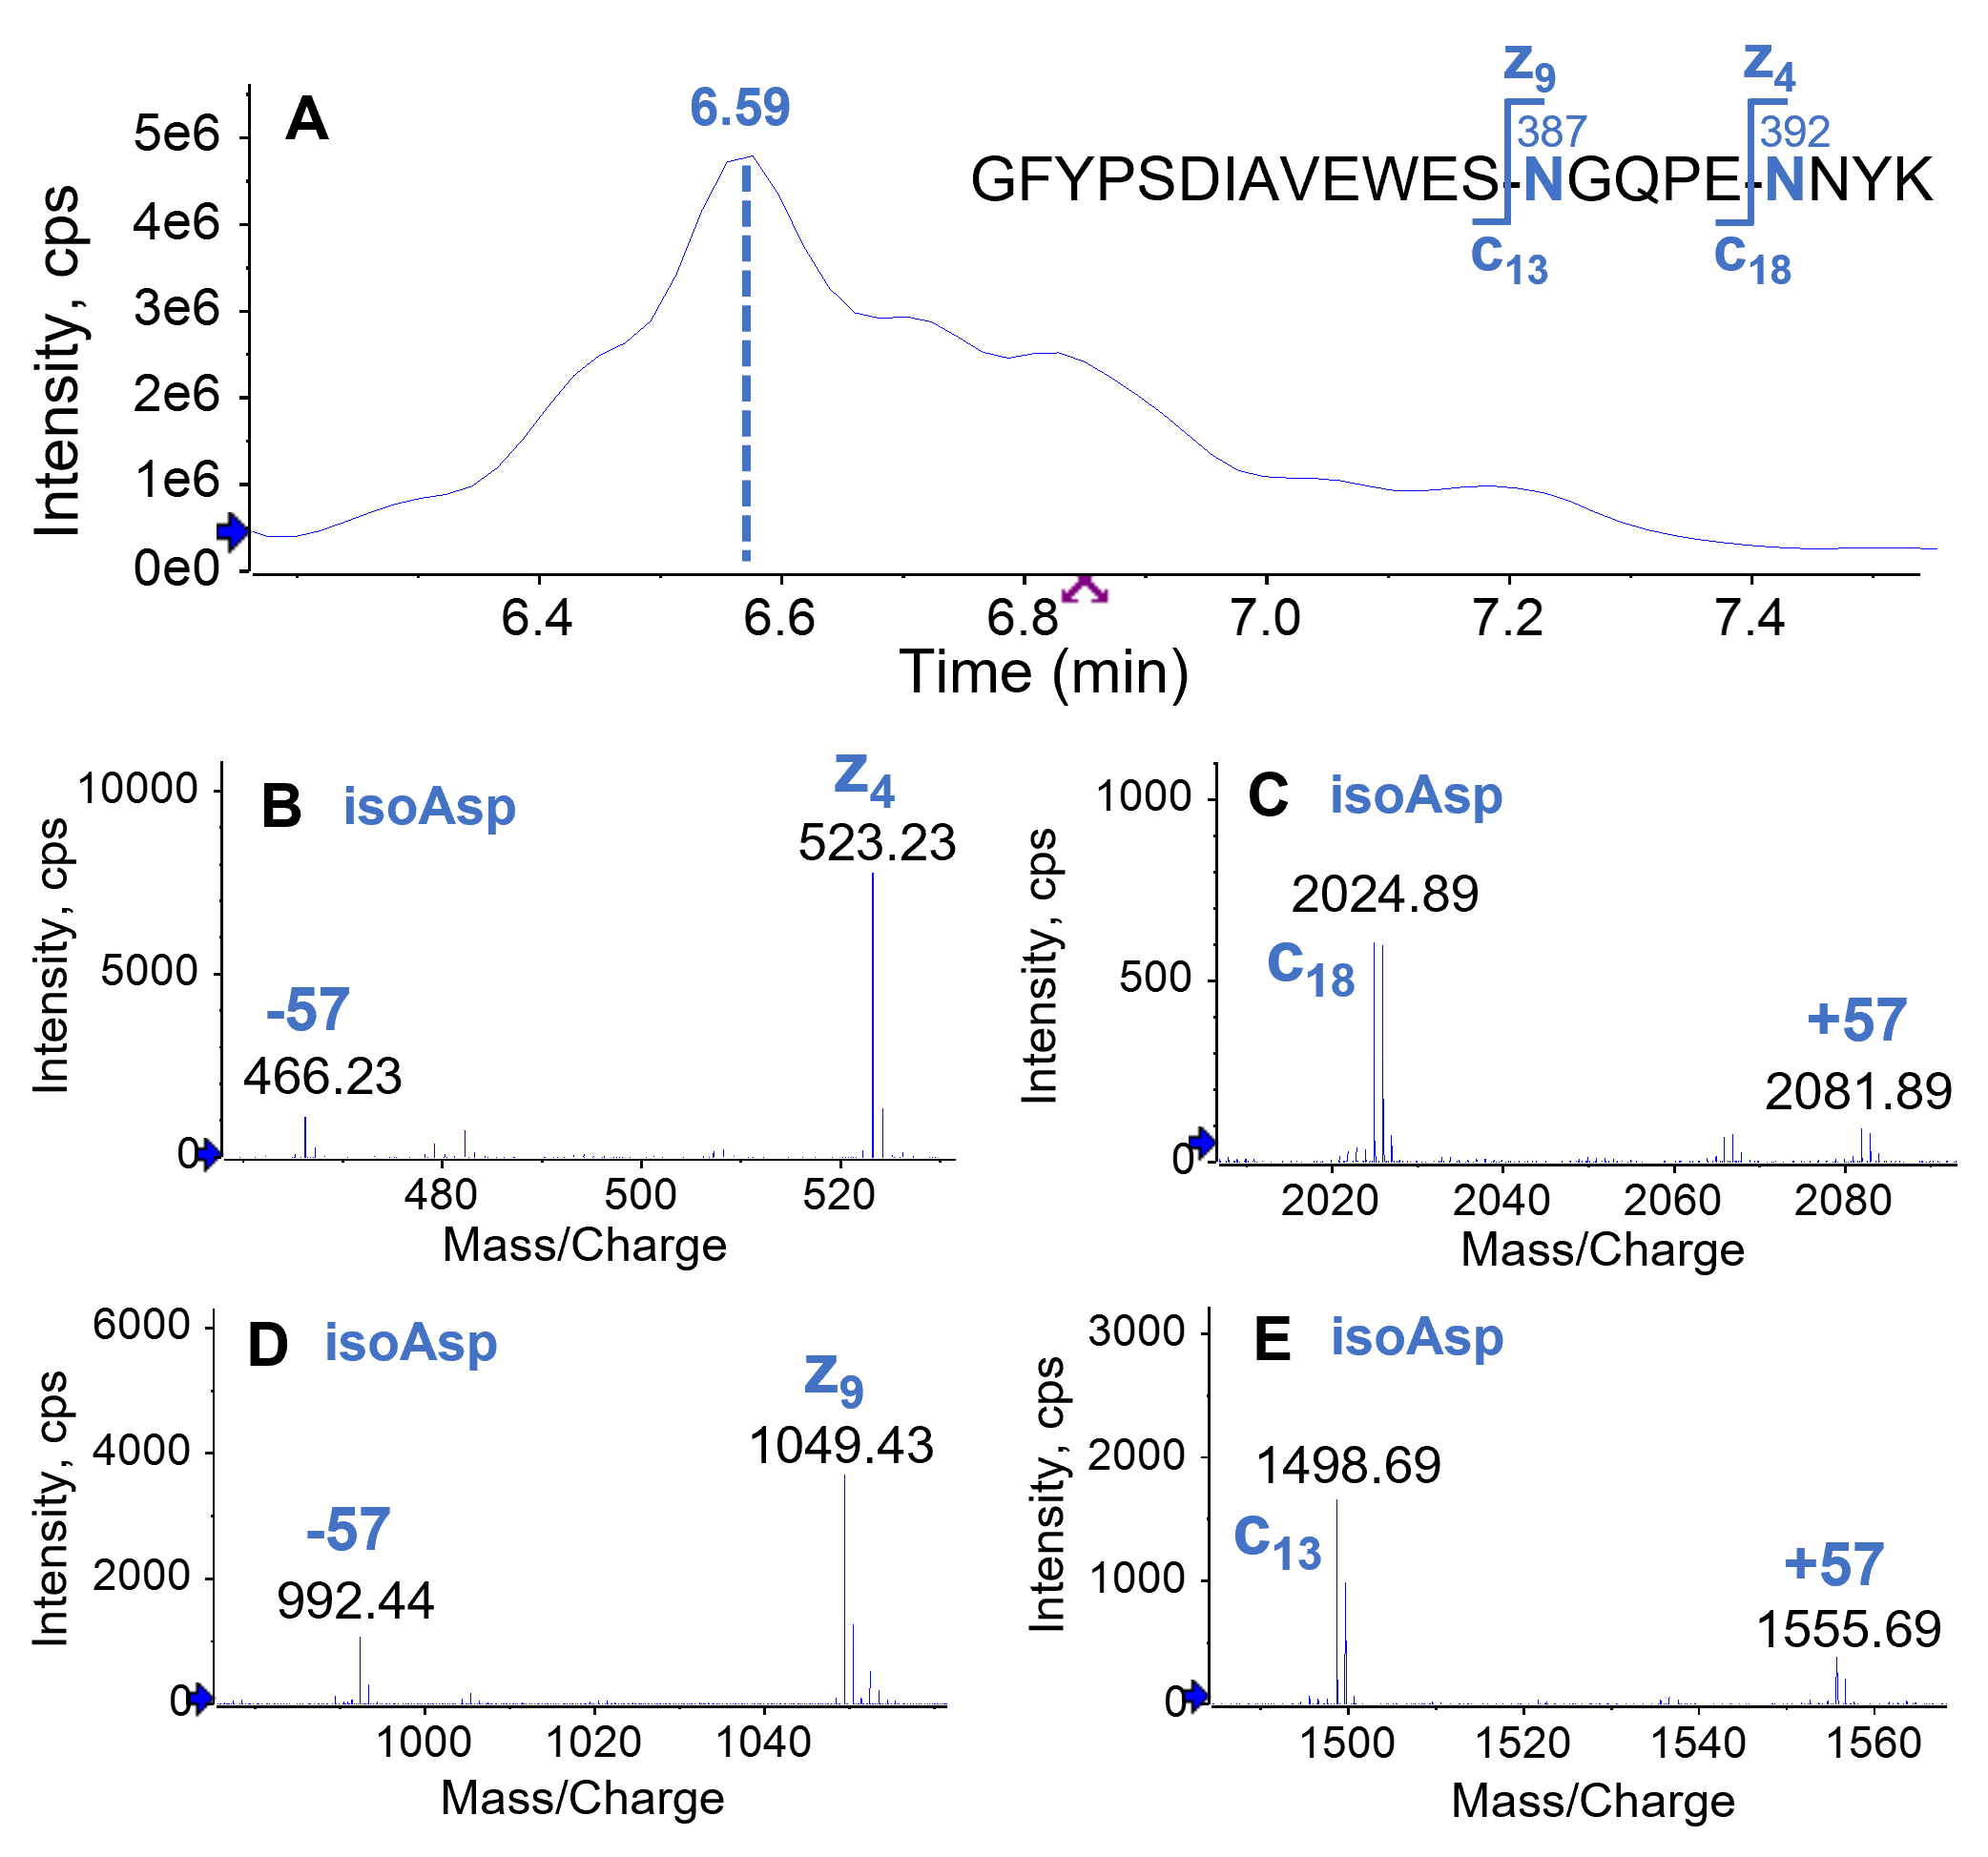
Figure 6. Isomer differentiation of a minor doubly deamidated species detected in the forced degradation sample using EAD. The doubly deamidated species observed at RT = 7.19 min in the TIC (A) consists of 2 main forms (B), where 1 deamidation occurred at N387 while the other at N392 or N393 (B). The N393 deamidation was present as isoAsp as evident by the detection of an intense z₃–57 ion (C). By comparison, both Asp and isoAsp were observed for deamidation at N392 (D) and N387 (E). The N387 deamidation was predominantly present as Asp as evident by the formation of an abundant z₉–44 fragment.
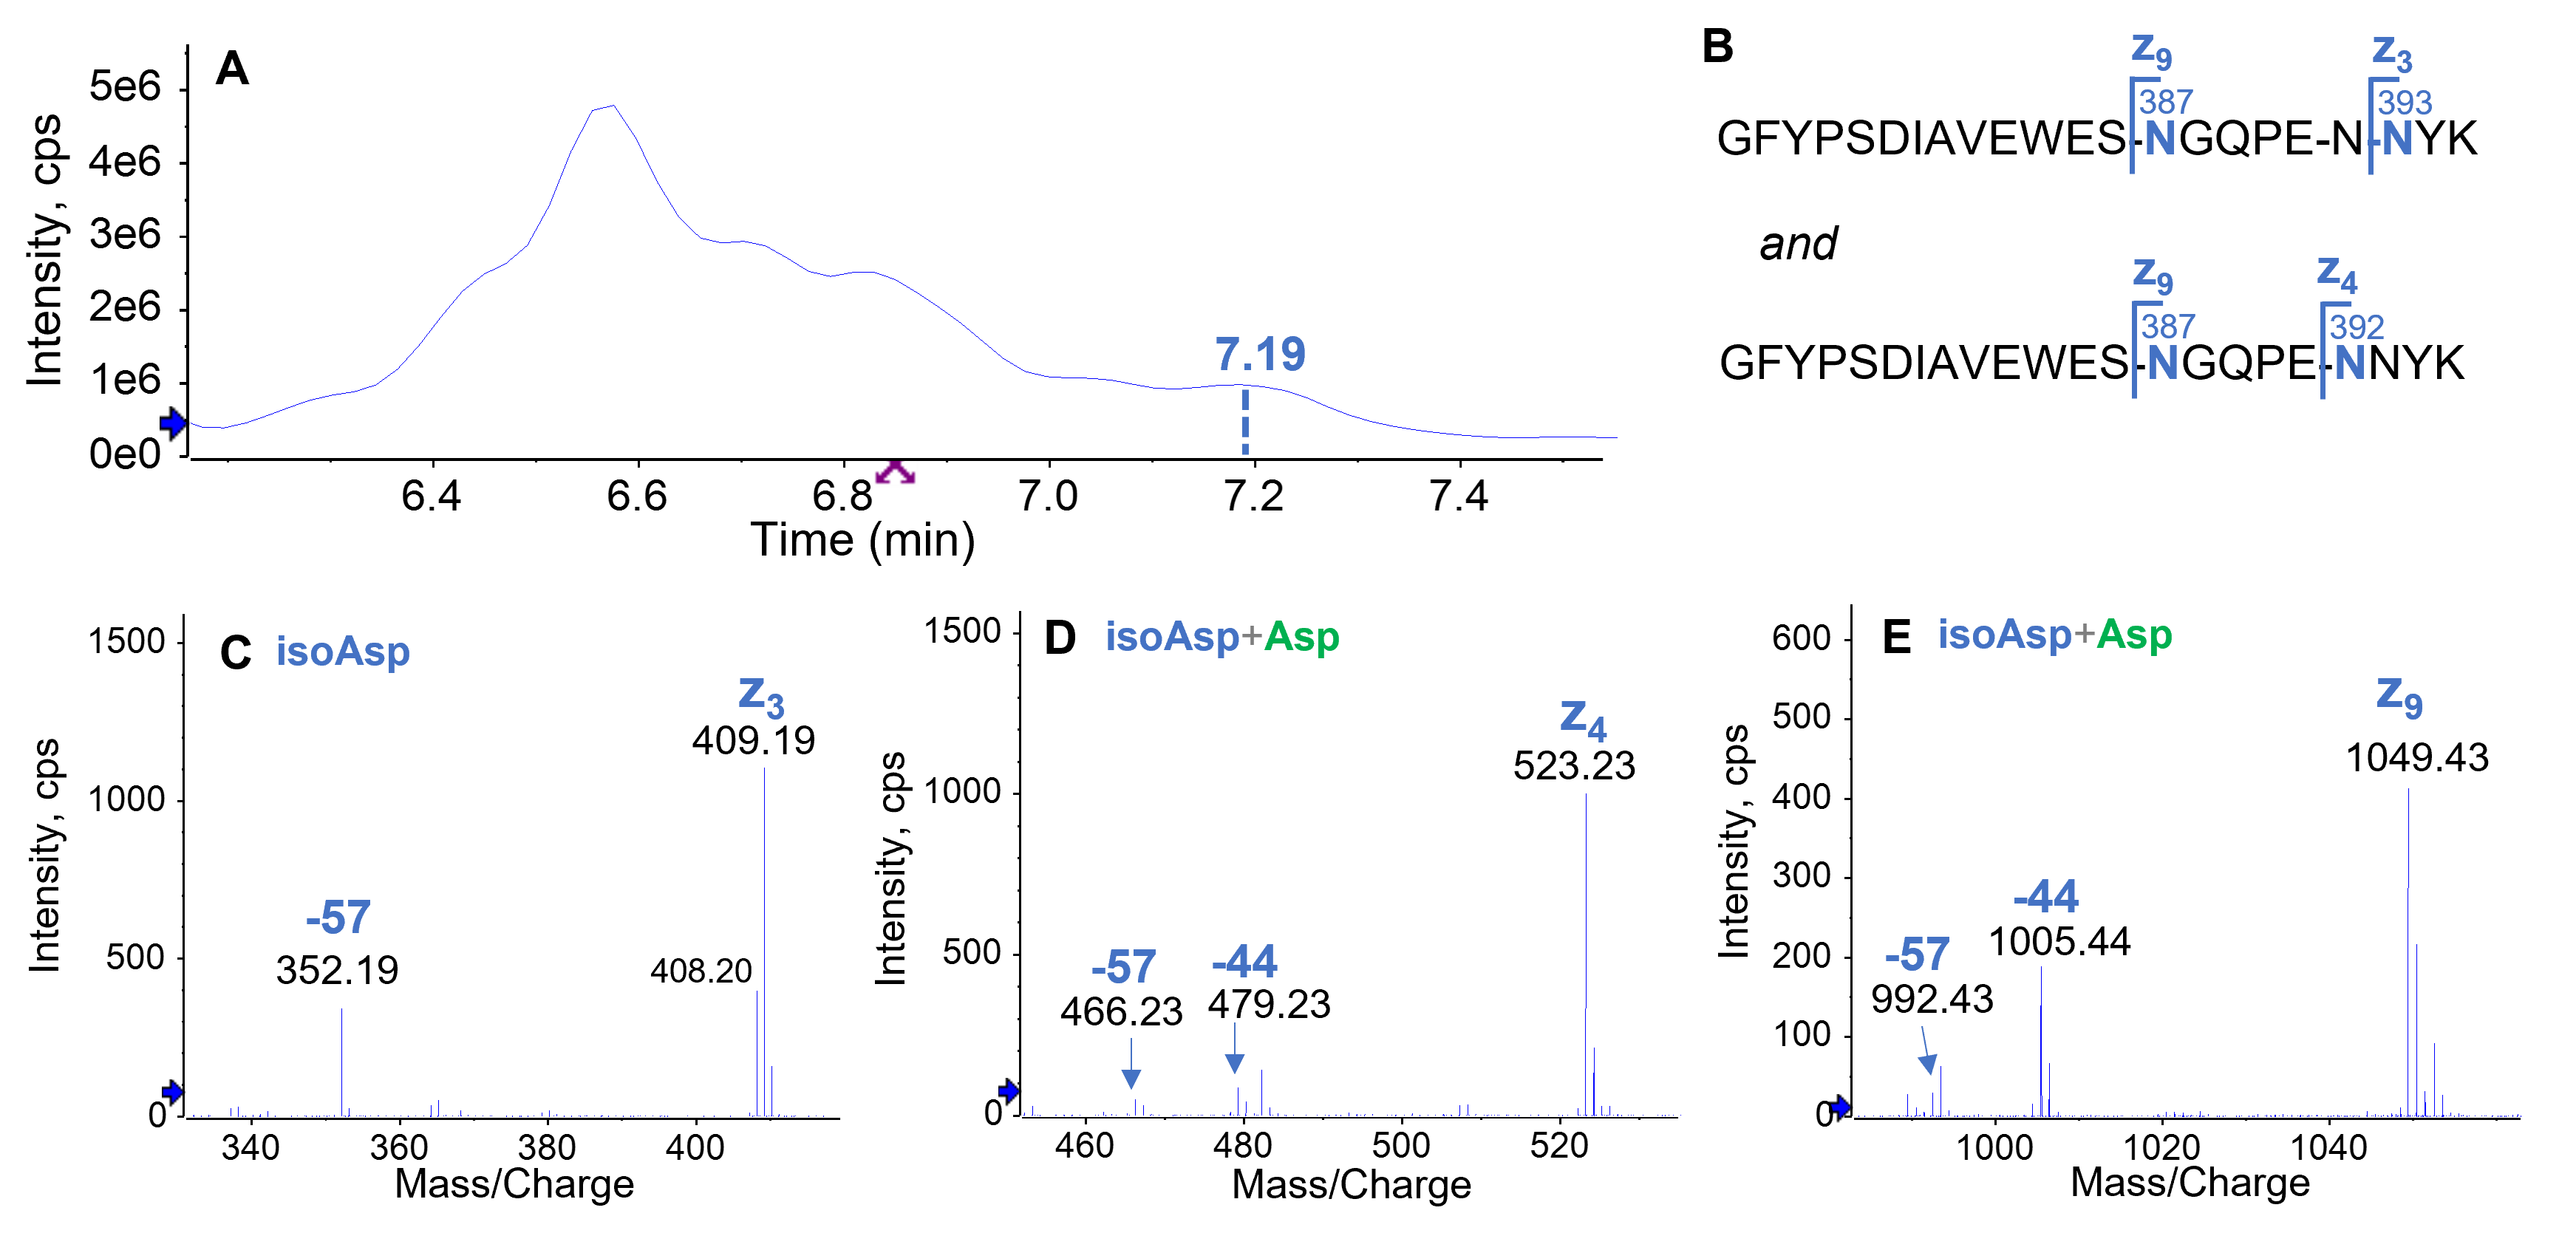
A minor doubly deamidated version was identified by EAD at RT = 7.19 min as a mixture of 2 major deamidated peptides where 1 deamidation occurred at N387 and the other at N392 or N393 (Figure 6A and 6B). While the N393 deamidation was present as the isoAsp form as evident by the detection of an abundant z3–57 ion (Figure 6C), the deamidations at N387 and N392 consisted of both Asp and isoAsp isomers as evident by the detection of both z‒57 and z‒44 fragments (Figure 6D and 6E).
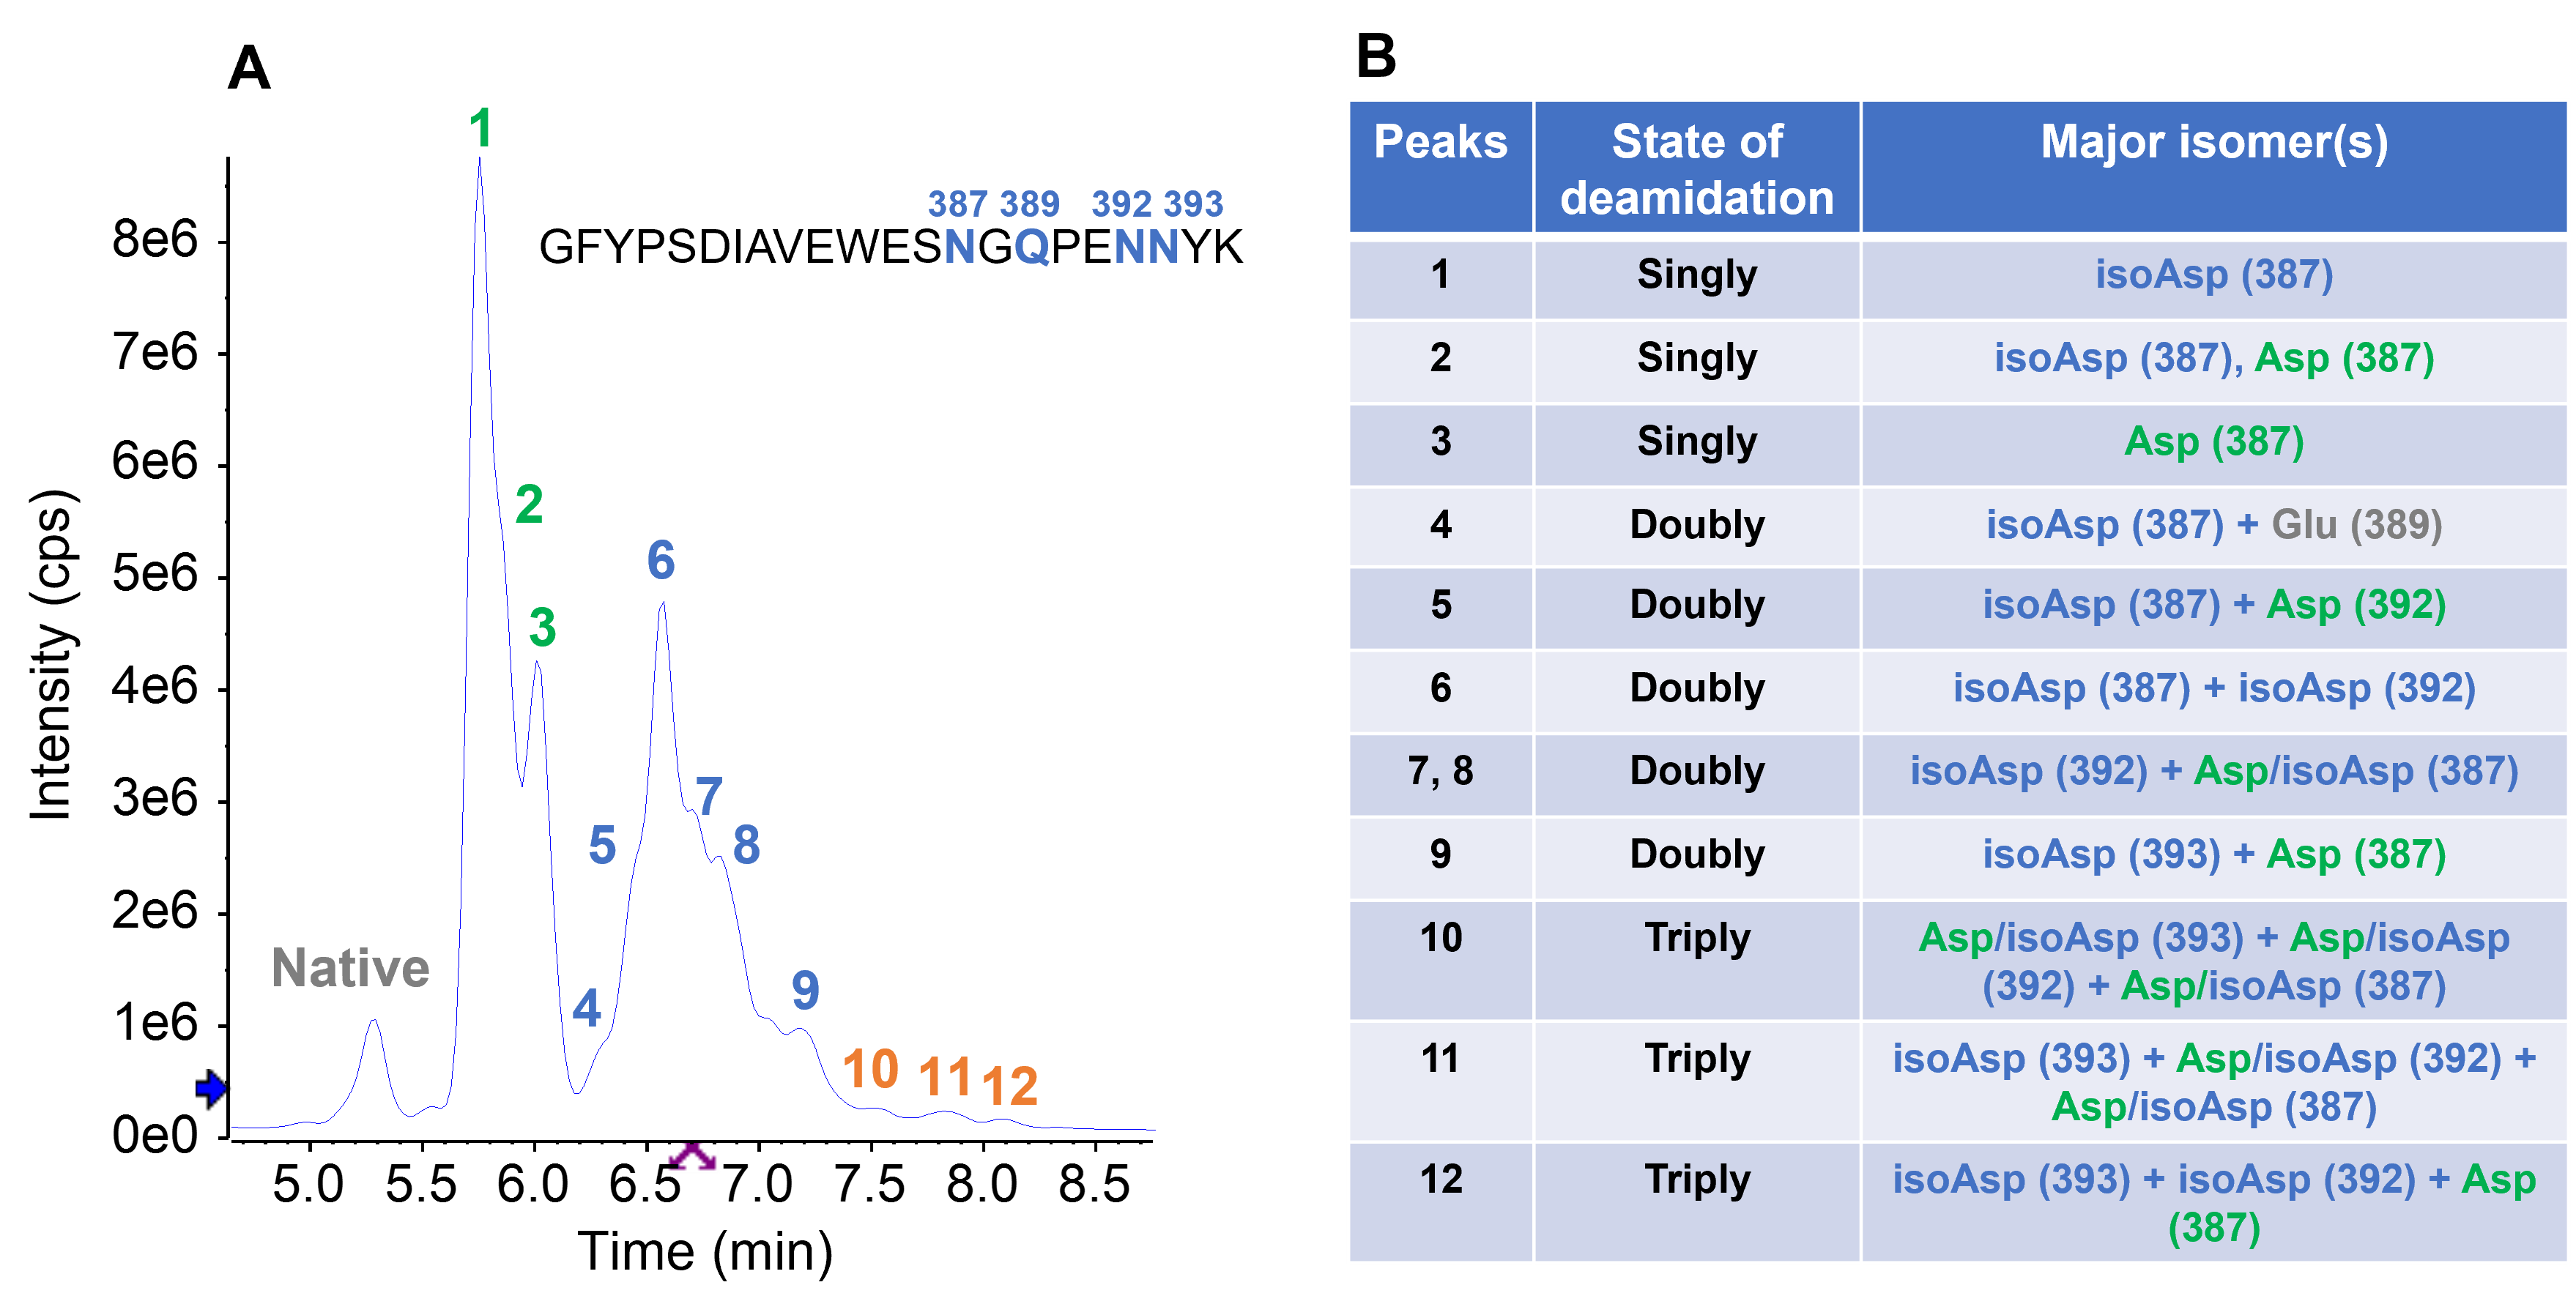
Despite the low abundance (0.7%) of the triply deamidated peptide in the forced degradation sample (Figure 3A), EAD generated high-quality data (Figure 7) for confident localization of deamidation sites and isomer differentiation. The main triply deamidated species at RT = 7.84 min corresponded to deamidations on all three Asn residues (N387, N392, and N393) (Figure 7A). The deamidated N393 in this species was an isoAsp isomer (Figure 7B) based on the observation of a signature z3– 57 ion while N387 (Figure 7C) and N392 (Figure 7D) were present as mixtures of Asp and isoAsp isomers. The major isomer(s) identified for all deamidated species in the forced degradation were summarized in Figure 8. The results reveal that isoAsp was the dominant deamidation isomer in the forced degradation sample of PENNYK, being consistent with the previous observations.3,4 Despite sample heterogeneity and incomplete chromatographic separation of multiple deamidation isomers, EAD enabled accurate localization of deamidation sites and confident differentiation of Asp/isoAsp in the singly and multiply deamidated species.
Figure 7. Isomer differentiation of a triply deamidated species detected in the forced degradation sample using EAD. The triply deamidated species observed at RT=7.84 min in the TIC (A) corresponds to deamidation at all 3 Asn residues, for example, N387, N392 and N393. The N387 deamidation was present as isoAsp as evident by the detection of a z₃–57 ion (C), while both z–57 and z–44 fragments were observed for N392 and N387 deamidations (C and D), indicating the co-existence of the Asp and isoAsp isomers.
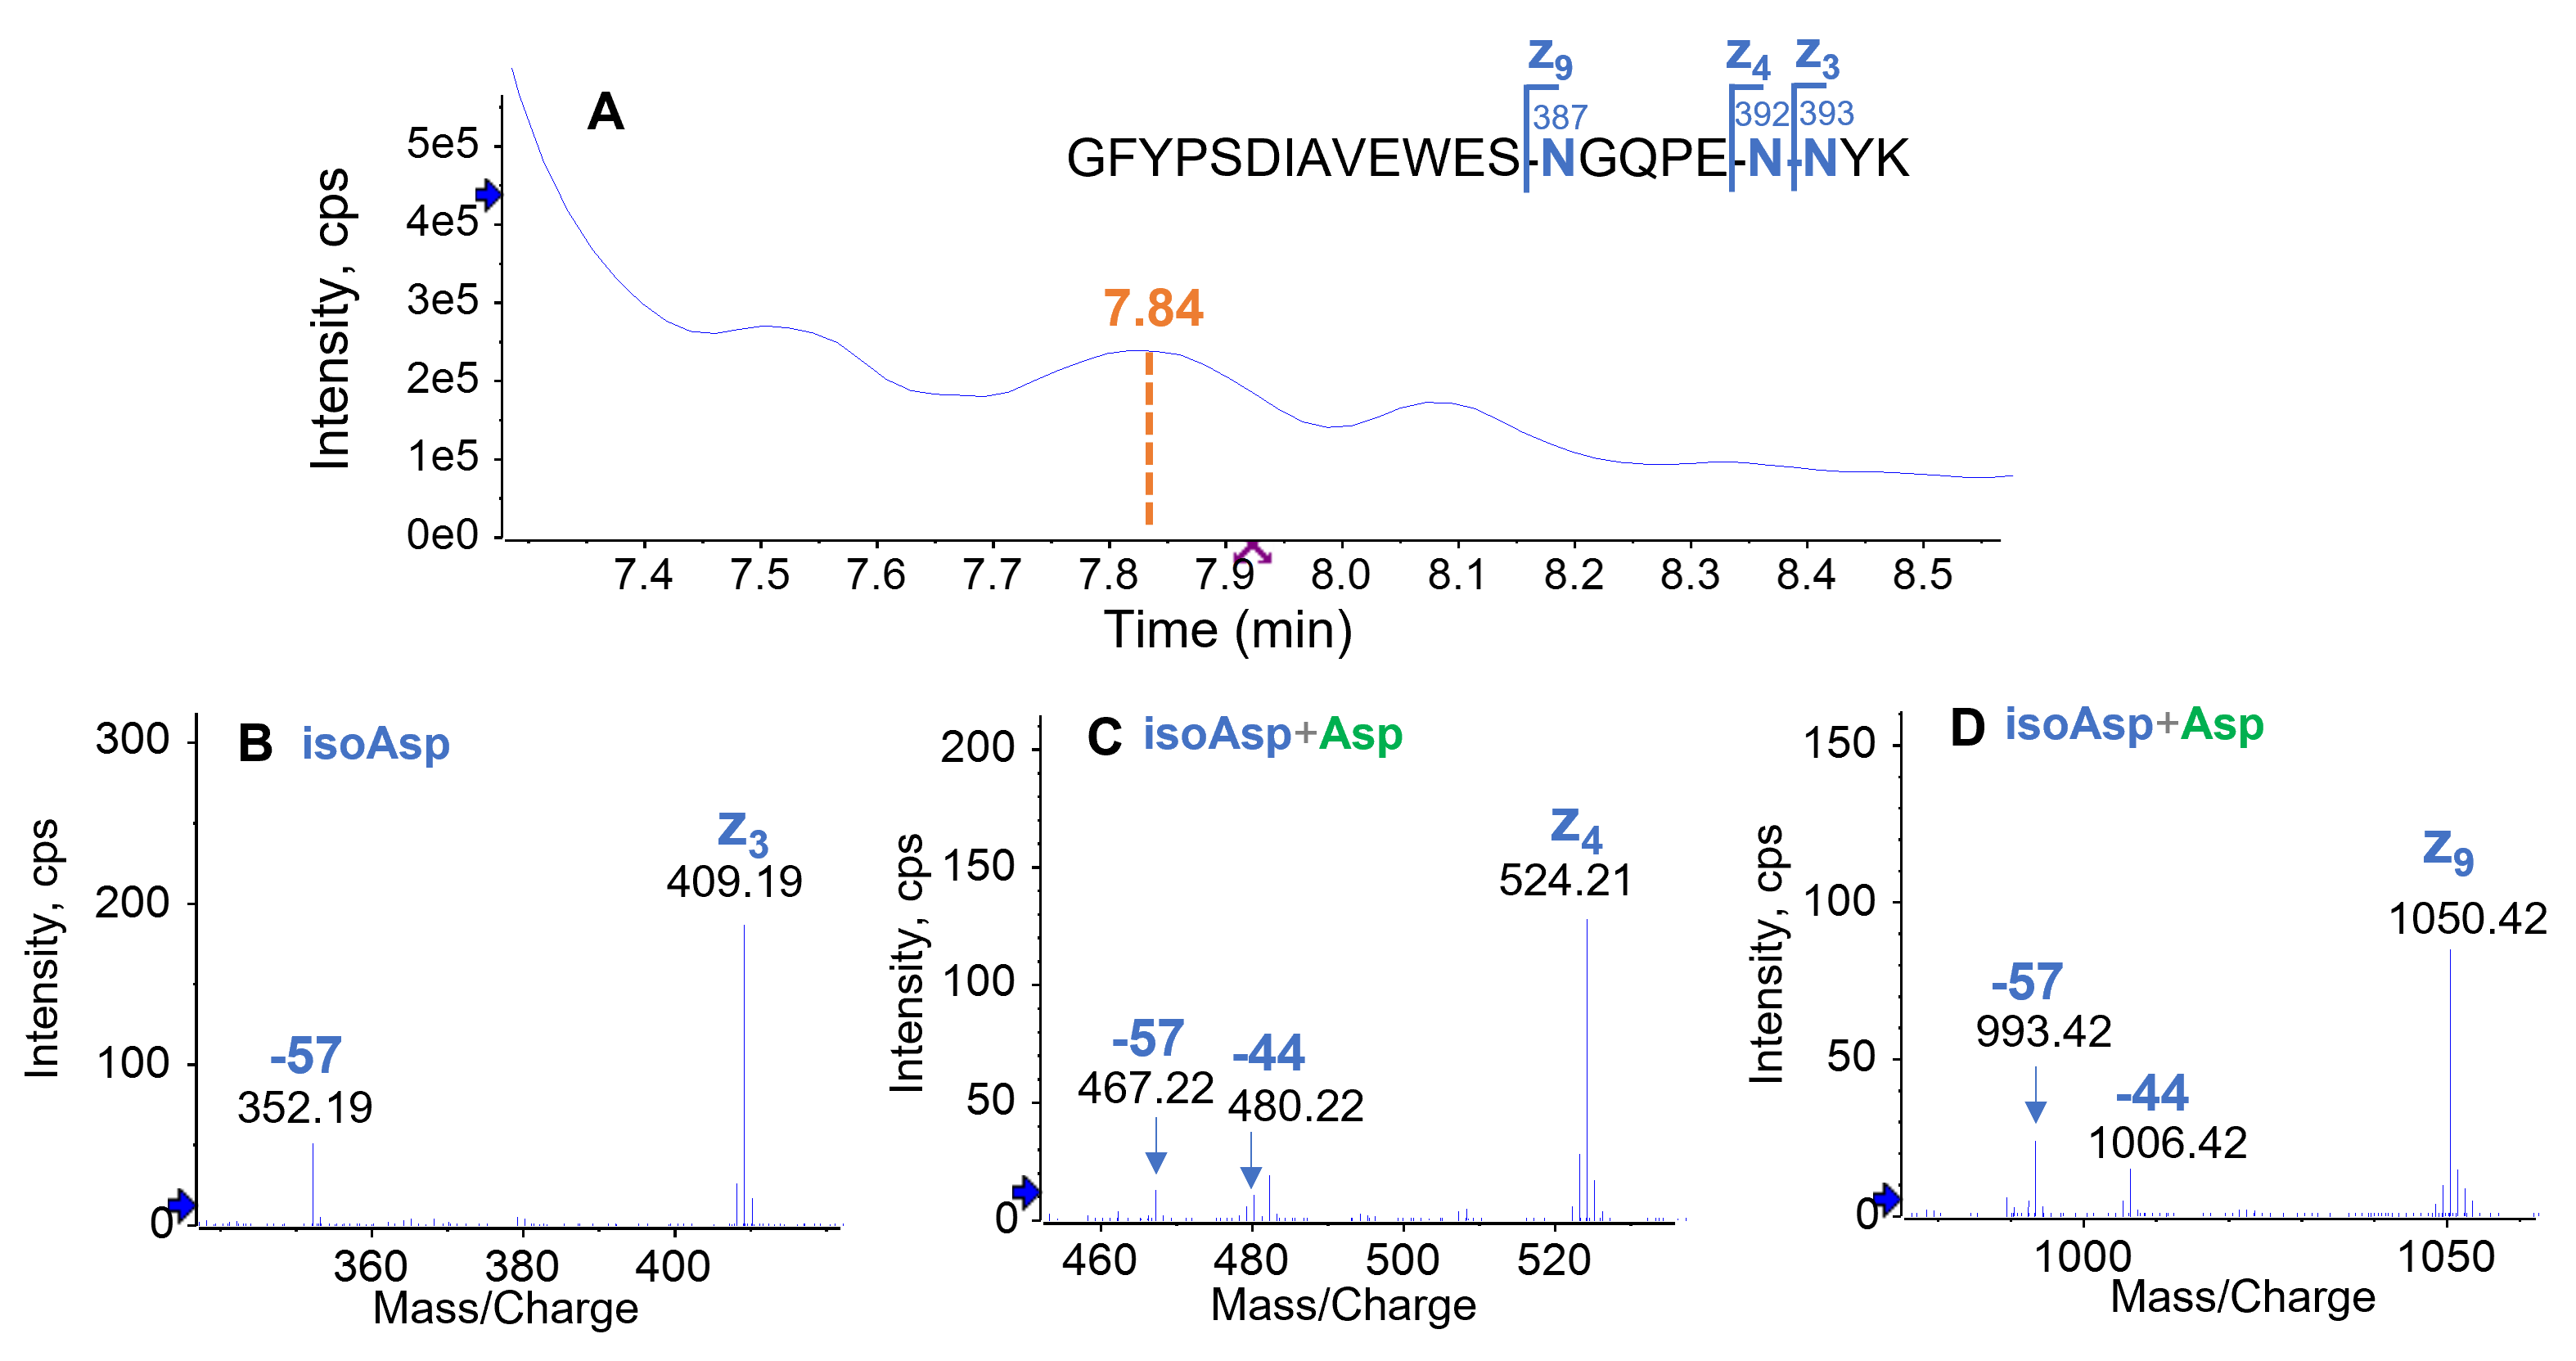
Figure 8. Summary of major deamidated species detected in the PENNYK sample with forced degradation. While the singly, doubly and triply deamidated species observed in the XIC (A) can be well separated, their isomers were not fully resolved chromatographically due to the heterogeneity of the sample. Despite this challenge, EAD provided high quality MS/MS data that allowed for not only identification of the deamidation sites but also differentiation of Asp/isoAsp isomers. The table (B) summarizes peak assignment for the major deamidated peak labeled in A. The annotation of Asp/isoAsp in B indicates the co-existence of these 2 species.
In summary, the EAD data presented in this technical note demonstrates the power of this technology for increasing confidence in comprehensive characterization of deamidation, a potential critical quality attribute that should be well characterized and closely monitored due to its significance to the efficacy and safety of biopharmaceutical drugs.1
Conclusion
- Confident identification and differentiation of deamidation isomers despite sample complexity and incomplete chromatographic separation was achieved with signature fragments from EAD
- All 3 Asn-deamidated species in the singly deamidated PENNYK peptide control were shown to be present as the Asp form
- IsoAsp was identified as the major deamidation isomer generated under the stressed condition
- The approach described in this technical note can be leveraged to facilitate in-depth characterization of deamidation hot spots in stability testing and forced degradation of protein therapeutics
References
- Surbhi Gupta et al. (2022) Oxidation and deamidation of monoclonal antibody products: potential impact on stability, biological activity, and efficacy. J. Pharma. Sci. 111: 903-918.
- Differentiation of aspartic and isoaspartic acid using electron activated dissociation (EAD). SCIEX technical note, RUO-MKT-02-12550-B.
- Superior characterization and monitoring of product quality attributes using an electron activated dissociation (EAD)-based multi-attribute method (MAM). SCIEX technical note, RUO-MKT-02-14240-A.
- Intact LC-MS analysis and peptide mapping of recombinant adeno associated virus (rAAV) capsid proteins. SCIEX technical note, RUO-MKT-02-14244-A.
- Qingrong Yan et al. (2018) Structure based prediction of asparagine deamidation propensity in monoclonal antibodies. MABS 10(6): 901-912.
- Nadezda Sargaeva et al. (2009) Identification of aspartic and isoaspartic acid residues in amyloid β peptides, including Aβ 1-42, using electron-ion-reactions. Anal. Chem. 81(23): 9778-9786.
- Marine Morvan and Ivan Miksik. (2021) Recent Advances in Chiral Analysis of Proteins and Peptides. Separations 8(8): 112.