Powerful workflows for highly sensitive identification and quantification of host cell proteins (HCPs)
Featuring the SCIEX OS software and the ZenoTOF 7600 system
Zhengwei Chen1, Lei Xiong1, Greg Adams2, Hunter Walker2, Margo Wilson2, Leon Pybus3, Charles Heise3, Michelle Lyons3 and Benjamin Hastings3
1SCIEX, USA; 2FUJIFILM Diosynth Biotechnologies, Morrisville, NC, USA; 3FUJIFILM Diosynth Biotechnologies, Teeside, UK
Abstract
HCPs were confidently identified in final drug substance (DS) utilizing a data-dependent acquisition (DDA) approach on the ZenoTOF 7600 system. MS1-based quantification revealed decreasing levels of the HCPs for different purification stages. In addition, a targeted approach was used to further improve the specificity and sensitivity of very low-level HCPs.
Introduction
HCPs can lead to degradation of biotherapeutic products or cause immune response in patients. Careful identification and monitoring of these proteins are vital in ensuring safe and effective drugs. Unique challenges exist in developing analytical methods for their confident identification and quantification. On the one hand, the concentration of HCPs can span over 5 orders of magnitude at different purification stages, requiring the analytical method covers a wide dynamic range. Meanwhile, low levels of HCPs (<1 ppm) can still exist in the final DS, imposing challenges on a method’s sensitivity. Although off-the-shelf ELISA-based assays provide an easy and fast way to detect HCPs, they offer total HCP levels without information on individual HCPs. Anti-HCP polyclonal antibody sera raised in chicken, rabbits or other sources may not comprehensively recognize all HCPs in a sample or can lead to over- or under- estimation of the HCP content depending on the immunogenicity of HCPs. Furthermore, lack of specific HCP information undermines efforts of improving purifications steps efficiently.
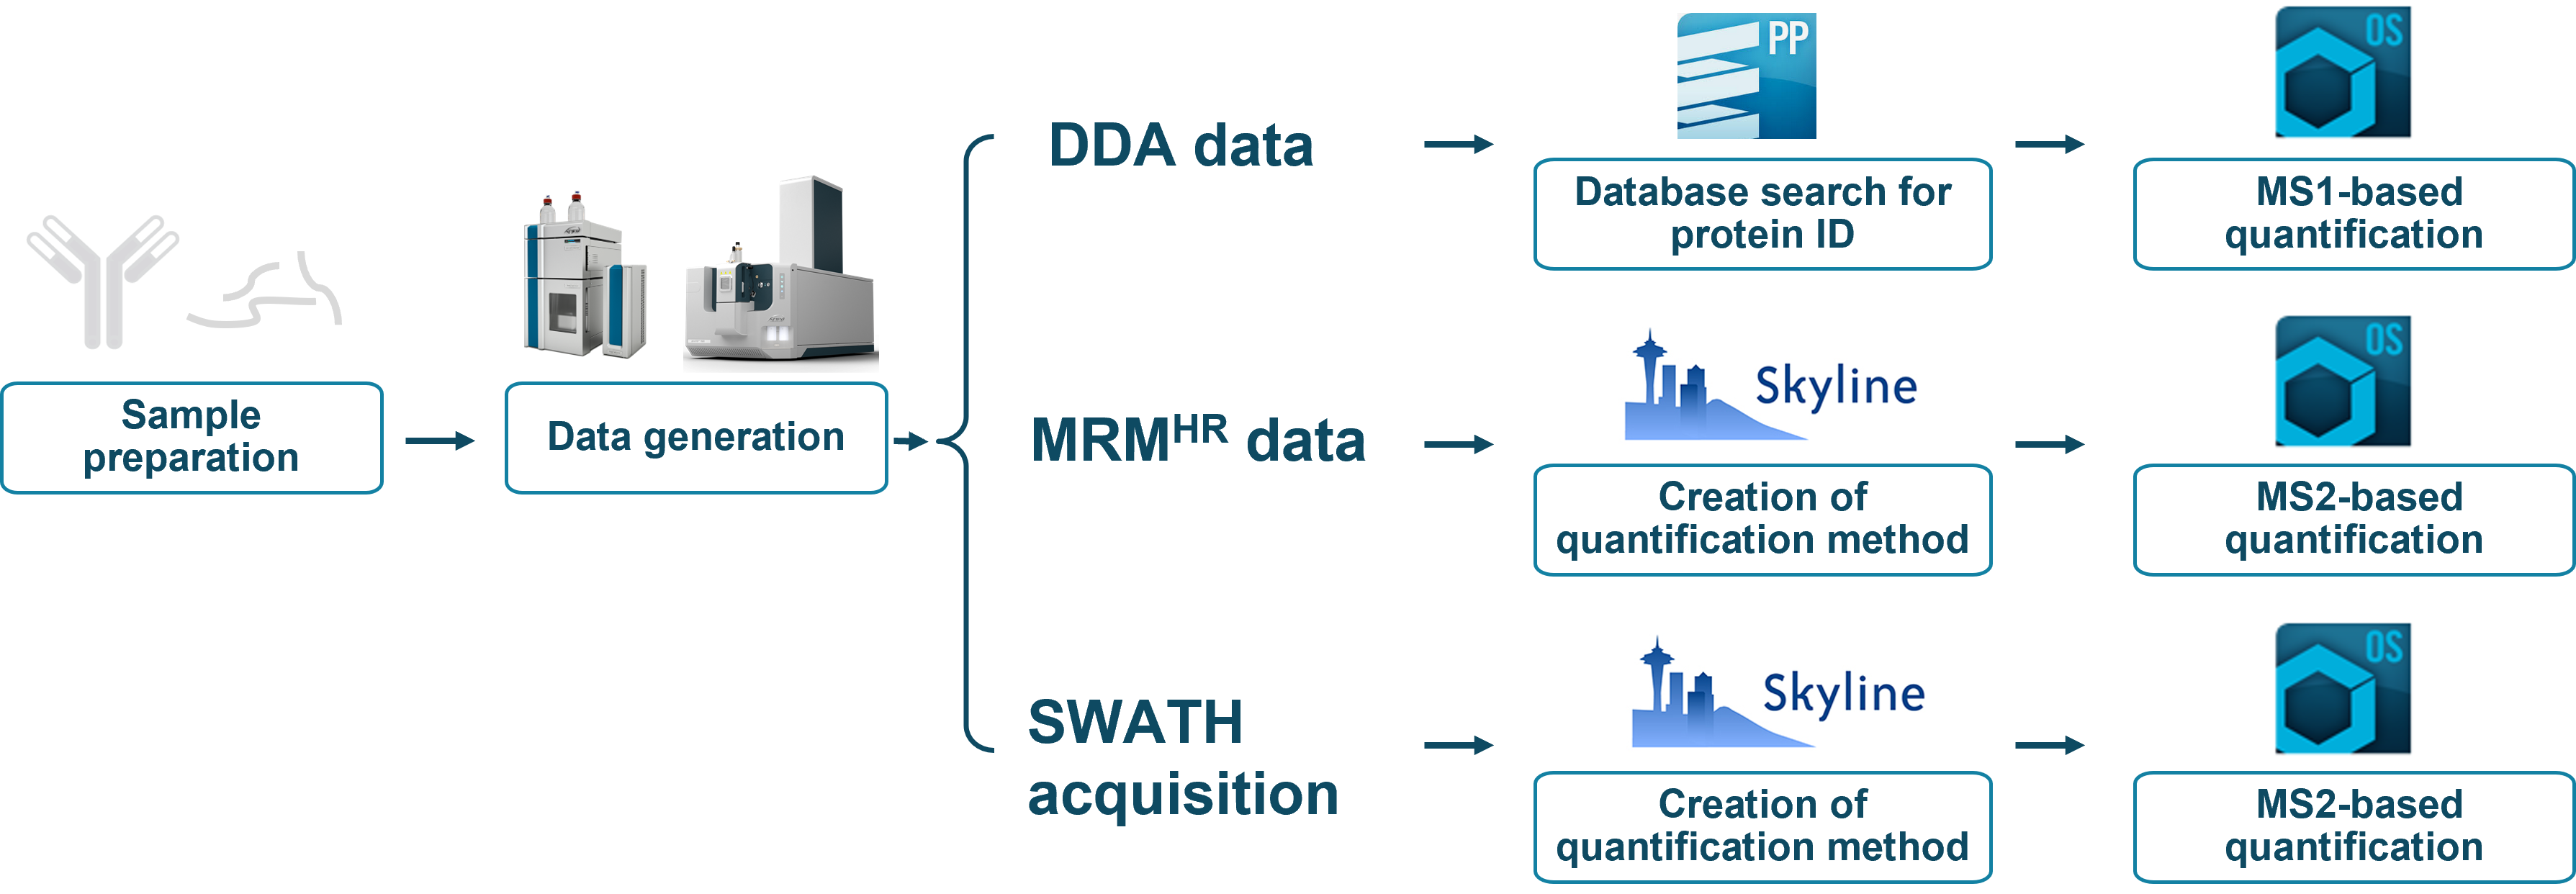
To overcome these challenges, an LC-MS/MS DDA approach for highly confident identification of each individual HCP across samples with a wide dynamic range was used. The ultra-sensitive MRMHR method enabled quantification of HCPs down to sub-ppm level with the ZenoTOF 7600 system (Figure 1).
Key features of the HCP identification and quantification workflow
- Highest flexibility for reliable identification and ultra-sensitive quantification of HCPs down to sub-ppm level utilizing the capabilities of the ZenoTOF 7600 system
- Confident HCP identification based on high spectral MS/MS quality of DDA enhanced by the Zeno trap and simultaneous MS1-based quantification
- High-throughput workflow to monitor multiple HCPs levels across different purification stages from early material to final drug product with SCIEX OS software on MS1 or MS/MS level
Figure 1. A comprehensive HCP workflow for identification and quantification. Identification of HCPs was achieved by DDA including a database search using ProteinPilot software. For quantification, 2 options exist, which are MS1-based and MS/MS-based quantification. MS1-based quantification is a convenient way of leveraging the same data for identification. Higher specificity can be achieved with MS/MS-based quantification either using the non-targeted SWATH acquisition approach for generic quantification or a targeted approach using MRMHR for HCPs of interest.
Methods
Sample preparation: HCP samples from a Chinese hamster ovary (CHO) cell culture harvest were first loaded onto a protein an affinity column (ProA), then to cation exchange chromatography (CEX), flowthrough anion exchange chromatography (AEX), followed by a virus filtration (VF) step to obtain the final bulk drug substance (BDS). Samples were collected for LC-MS analyses after each purification stage to monitor the HCPs levels in the intermediate samples and to evaluate the efficiency of HCP removal for each purification stage. Native digestion was performed for the samples as described previously.1 In brief, 1M Tris-HCl (pH 8.4) was added to 600 μg of protein sample to obtain a final concentration of 25mM Tris-HCl. 20 ppm bovine serum albumin (BSA) were added as internal standard. Protein digestion was performed by adding trypsin at an enzyme-to-protein ratio of 1:400 and incubated at 37°C overnight. Dithiothreitol was added at a final concentration of 0.5 μg/μL and the solution was heated to 90°C for 10 min. Insoluble residues were spun down by centrifugation at 13,000×g for 2 min. Supernatants were carefully transferred into a fresh vial and acidified with trifluoroacidic acid to a final concentration of 0.05%. Protein digests at an equivalent of 160 μg of total protein were injected into the LC-MS system for analysis.
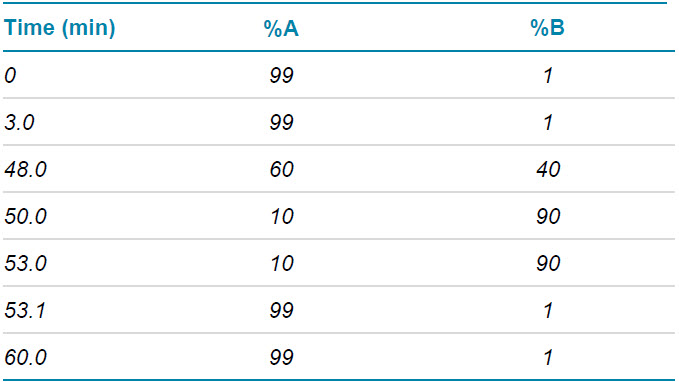
Chromatography: Protein digest was injected onto an ACQUITY CSH C18 column (2.1 x 150 mm, 1.7 μm, 130 Å, Waters) with column temperature set at 50°C. The LC profile was 60 min with 0.1% formic acid in water and 0.1% FA in acetonitrile as mobiles phases at flow rate of 0.25 mL/min. Detailed LC information is shown in Table 1.
Table 1. Gradient used for LC separation.
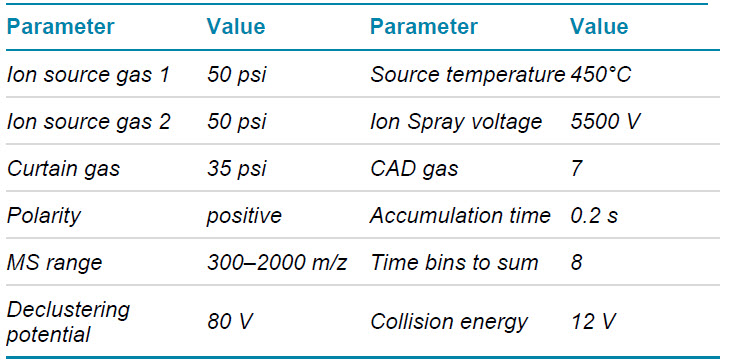
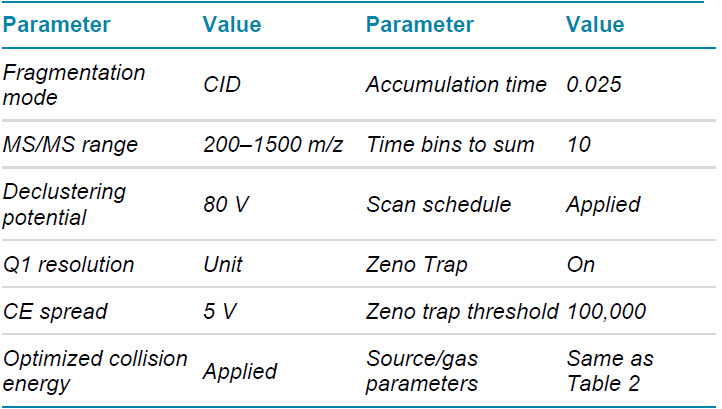
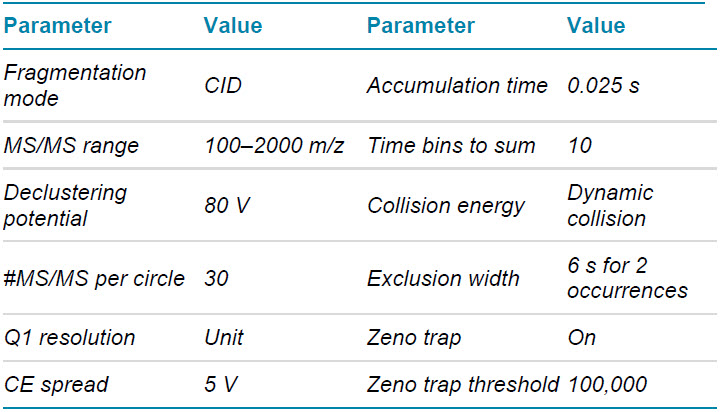
Mass spectrometry: LC-MS/MS data in DDA and a targeted approach allowing for parallel reaction monitoring (MRMHR) were acquired with the ZenoTOF 7600 system operated with SCIEX OS software 2.1. Key TOF MS and TOF MS/MS parameters are listed in tables 2–4.
Table 2. TOF MS parameters.
Table 4. TOF MS/MS MRMHR parameters.
Table 3. TOF MS/MS DDA parameters.
Data processing: DDA data were searched against a CHO protein database based on Uniprot entries, modified with the antibody, BSA and common human-derived impurity sequences, using ProteinPilot software 5.0. Using Skyline software, the best 3 transitions were determined for subsequent quantification. DDA and MRMHR data were processed in SCIEX OS software for HCPs quantification on MS1 and MS/MS level, respectively. The spiked-in BSA standard was used to create ratios between detected HCP and standard to calculate ppm values.
Comprehensive workflows for HCPs analyses addressing different user needs
To answer the question of which HCPs are present in the samples and at what levels, effective workflows, capable of both identification and quantification, are needed. The ZenoTOF 7600 system provides versatile solutions to answer these questions while meeting different user needs (Figure 1):
- DDA for enhanced identification of HCPs through the Zeno trap, enabling MS1-based quantification, simultaneously
- MRMHR for targeted quantification at the MS/MS level of dozens of user-defined HCPs
- SWATH acquisition for quantification of hundreds to thousands of proteins at MS/MS level in a single injection without prior knowledge of the HCPs in the sample
The risk of missing low abundance HCP is mitigated by ultra-fast and sensitive DDA, which generates a wealth of high-resolution MS/MS spectra benefiting from the superior scan speed of >100 Hz of the ZenoTOF 7600 system.2,3 Empowered by the newly introduced Zeno trap, high-quality MS/MS data can be achieved even for low-level HCPs by a 5–20x sensitivity (signal-to-noise) increase at MS/MS level.3 The speed combined with sensitivity improvements provide highly confident identifications of HCPs using database search engines. Besides the identification of HCPs, MS1 information can be extracted from the DDA dataset for relative quantification of HCPs without the need for any additional injection or method optimization. With the intuitive SCIEX OS software, the DDA acquisition method set-up is convenient and quantitative data processing in SCIEX OS software based on results of database searches is straightforward.
To further improve the detection and quantification of HCPs at very low levels by increasing specificity and minimizing the influence of interferences, the ZenoTOF 7600 system provides the capability for MS/MS-based quantification via 2 different strategies, MRMHR or SWATH acquisition. As a data-independent acquisition (DIA) method, SWATH acquisition enables fragmentation of all species in each given m/z-window avoiding the pitfall of missing some low abundance species.
Thus, hundreds to thousands of HCPs can be quantified in a single run without the need for prior knowledge of the sample’s HCP profile, nor any extensive method development. The MS/MS quantification based on SWATH acquisition is a generic, untargeted quantification approach. Alternatively, targeted quantification can be performed based on an MRMHR method, if the interest lies in a limited number of known HCPs. This approach provides the benefit of further sensitivity gains, since the most intense peptides are selected and fragmented with optimized collision energies. While being more sensitive, this approach is limited to monitoring a limited number of HCPs and requires more knowledge of the HCPs for method optimization.
To summarize, having DDA, SWATH acquisition and MRMHR approaches available on a single instrument platform dramatically improves the capabilities and flexibility for solid HCP identification and highly sensitive quantification.
HCP identification
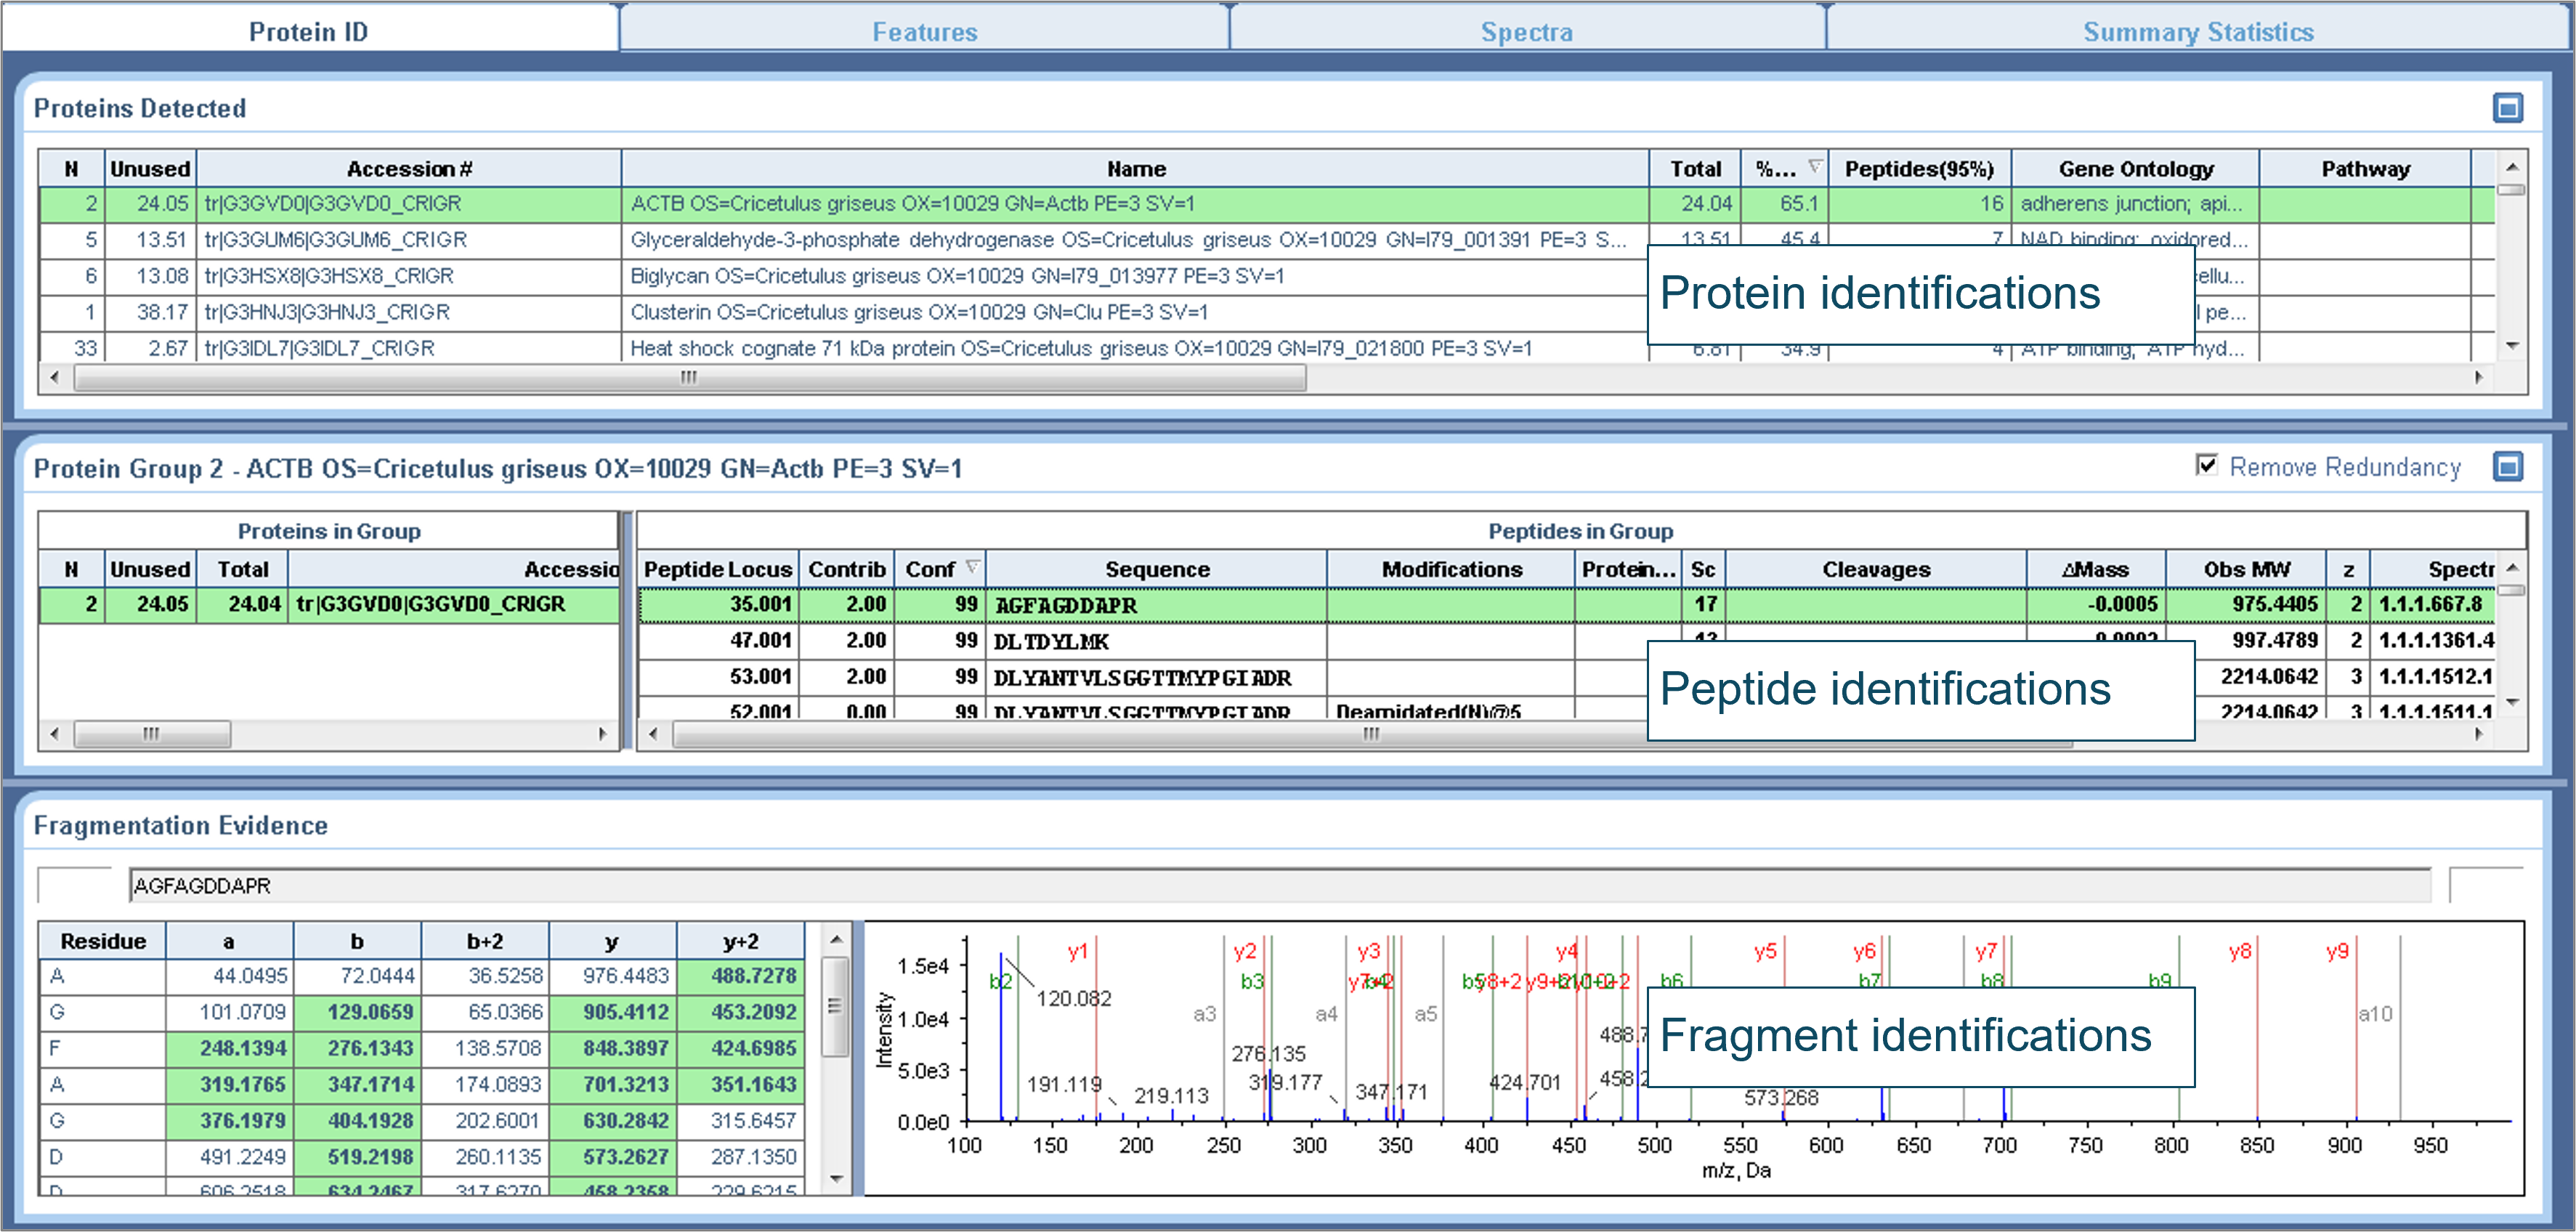
The common strategy to identify HCPs is based on processing data from DDA through a database search engine, matching the empirical data with theoretical sequences from the host cell, such as, Chinese Hamster Ovary (CHO) cells or similar. Different database search engines can be used dependent on user access and user preferences. Here, the DDA data were processed with ProteinPilot software and searched against a CHO protein database including the sequences of the antibody therapeutic, BSA and common human-derived protein impurities. The search results (Figure 2) provided important information, such as, protein sequence coverage, peptide identification and identified peptide fragments. This information was subsequently used for selecting signature peptides and best transitions for quantification. MS/MS scoring as well as false-discovery rate analyses can provide statistical measures to judge data quality and limit false positive results. ProteinPilot software provides visualization of annotated MS/MS spectra, detailed fragments tables for intuitive confirmation and confidence scoring for peptides as well as proteins (Figure 2). Aside from the result files from ProteinPilot software which can easily be imported into Skyline software, serving as peptide library for processing of SWATH acquisition data files (not shown).
Figure 2. Example of database search results of HCPs using data from DDA and ProteinPilot software. The search results show information of identified HCPs (from top to bottom panel), identified proteins including the sequence coverage of the proteins, identified peptides associated with the selected protein and the MS/MS fragment assignments for each peptide.
HCP quantification
After identification of the HCPs of interest, the first step for reliable HCP quantification is to select the appropriate peptide(s) for each identified HCP. There are a few selection criteria: the selected peptides should be unique to the protein, provide good ionization, not suffer from high background interferences and not have any missed cleavages or carry any variable post-translation modifications (PTMs). In case of MS/MS-based quantification an additional criterium to look out for is good fragmentation efficiency. A user can decide on the number of peptides or transitions to be considered ensuring reliable quantification. Here, 1 peptide was used for MS1 and 3 transitions were used for MS/MS-based quantification as an example (Figures 3–5).
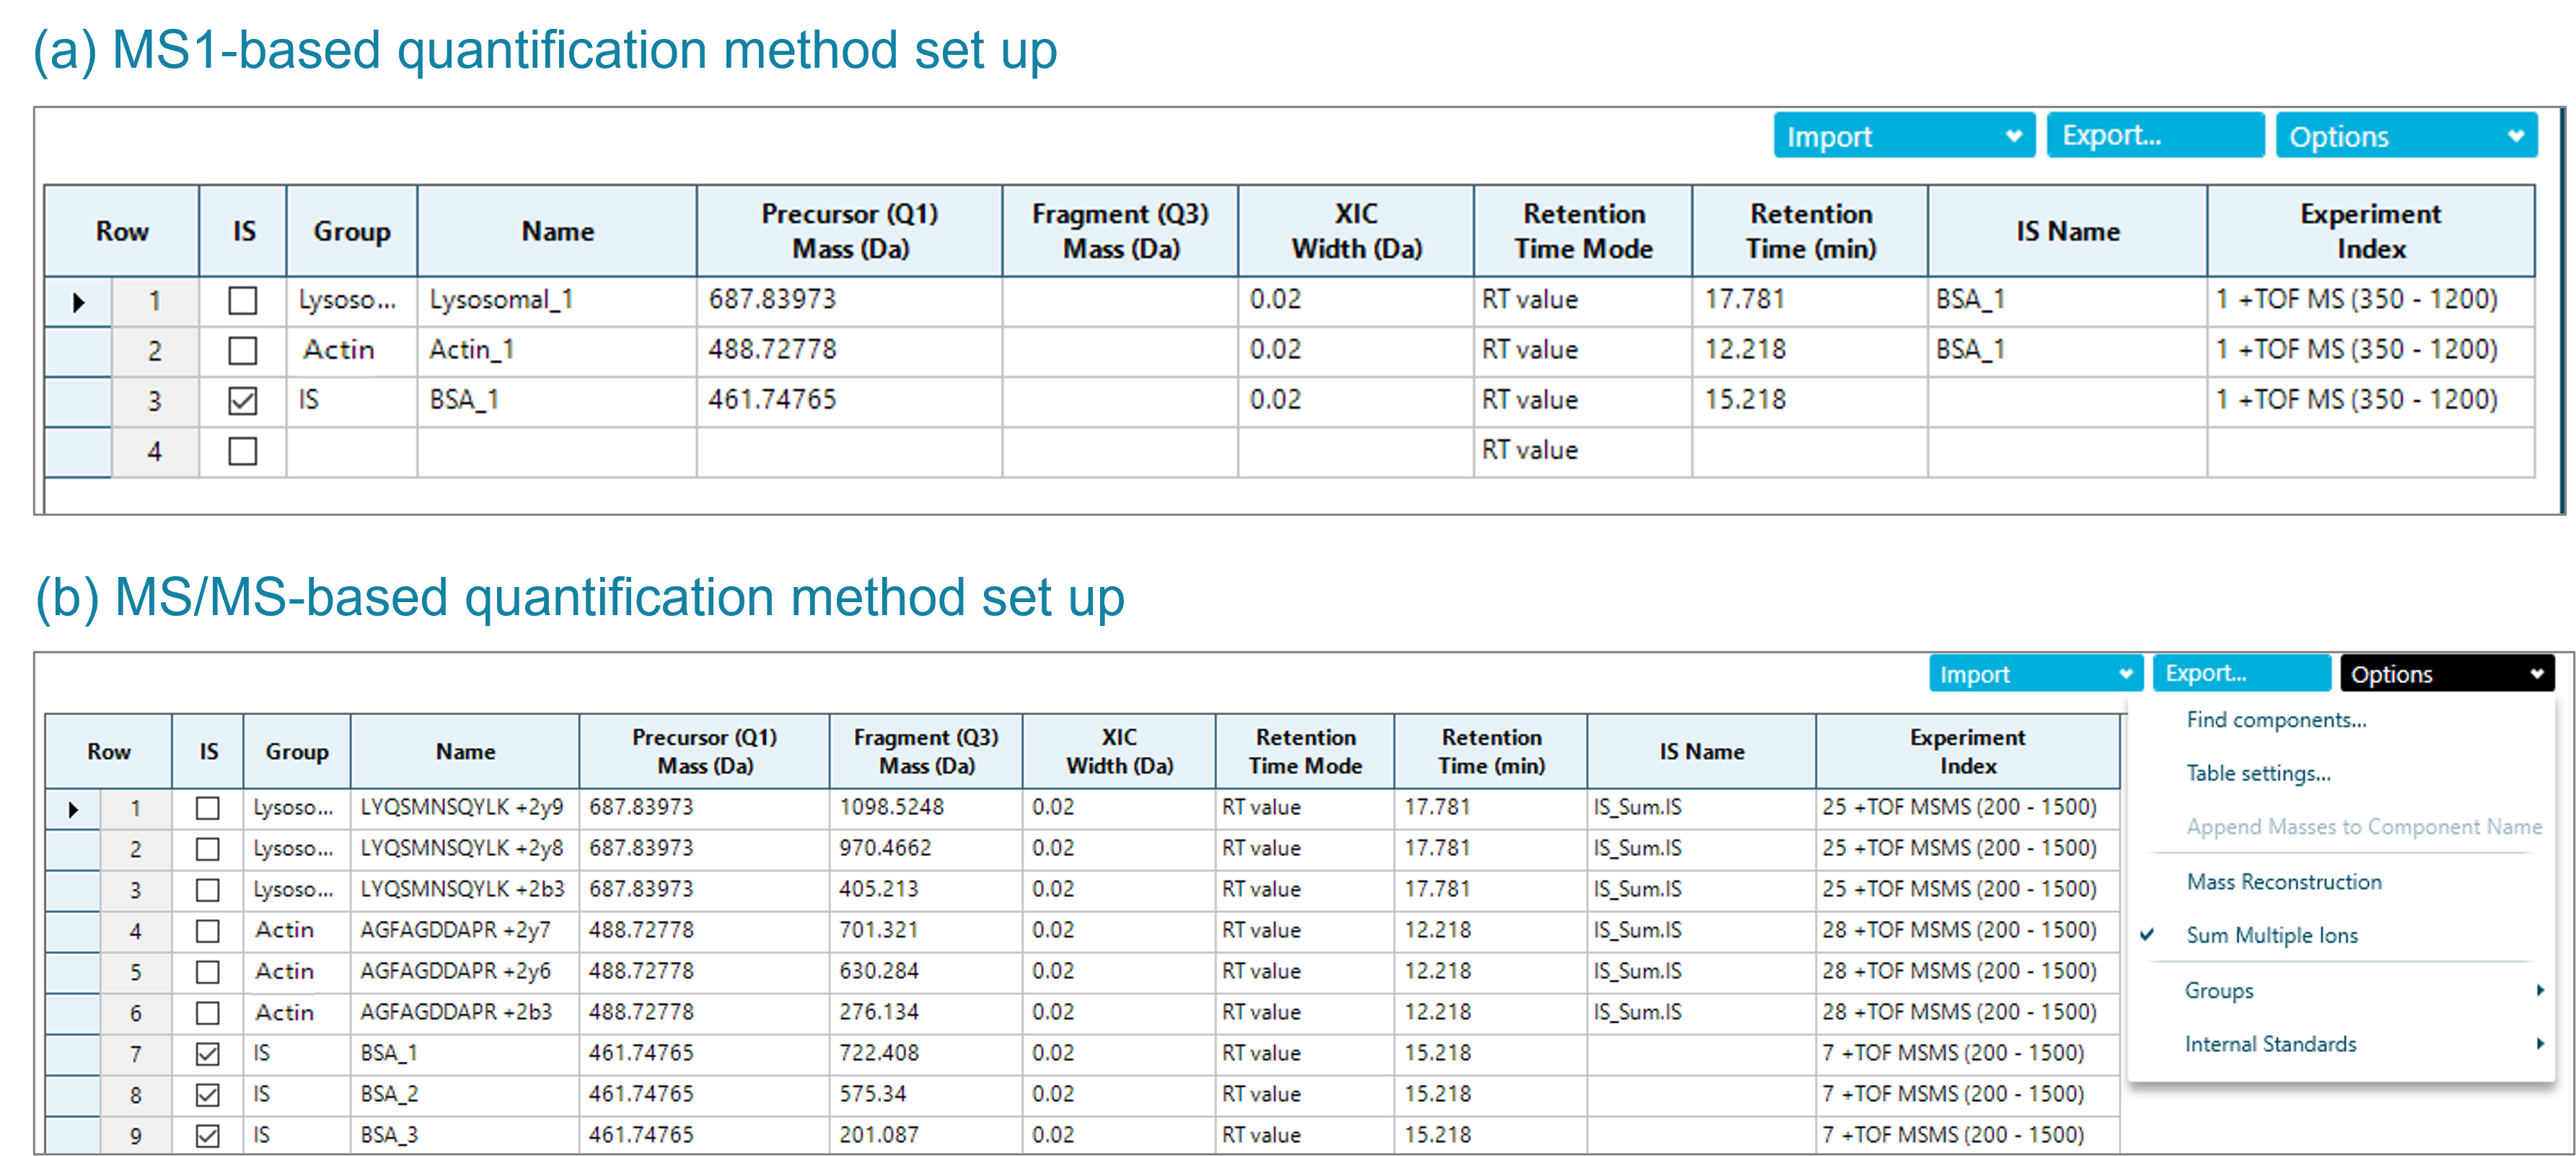
After database searching of the data derived from DDA, 2 HCPs from the CHO database were confidently identified in all purification steps, lysosomal protective protein and actin cytoplasmic 1 protein. These 2 proteins were used to showcase both quantification approaches. As a first step, a quantification method was set up in SCIEX OS software leveraging the MS1 information from DDA data (Figure 3a). As mentioned above, this approach did not require any additional optimization, 1 injection was used for identification and quantification, simultaneously.
Figure 3. Processing method set up for HCP quantification in SCIEX OS software. The MS1-based quantification method only requires the m/z of the precursor ion of the selected signature peptides and the retention time information (a). The MS/MS-based quantification method can be based on 1 fragment or sum of user-specified fragments. Here, the most intense 3 fragments of the signature peptides were used for peak integration and automatically summed for quantification (b).
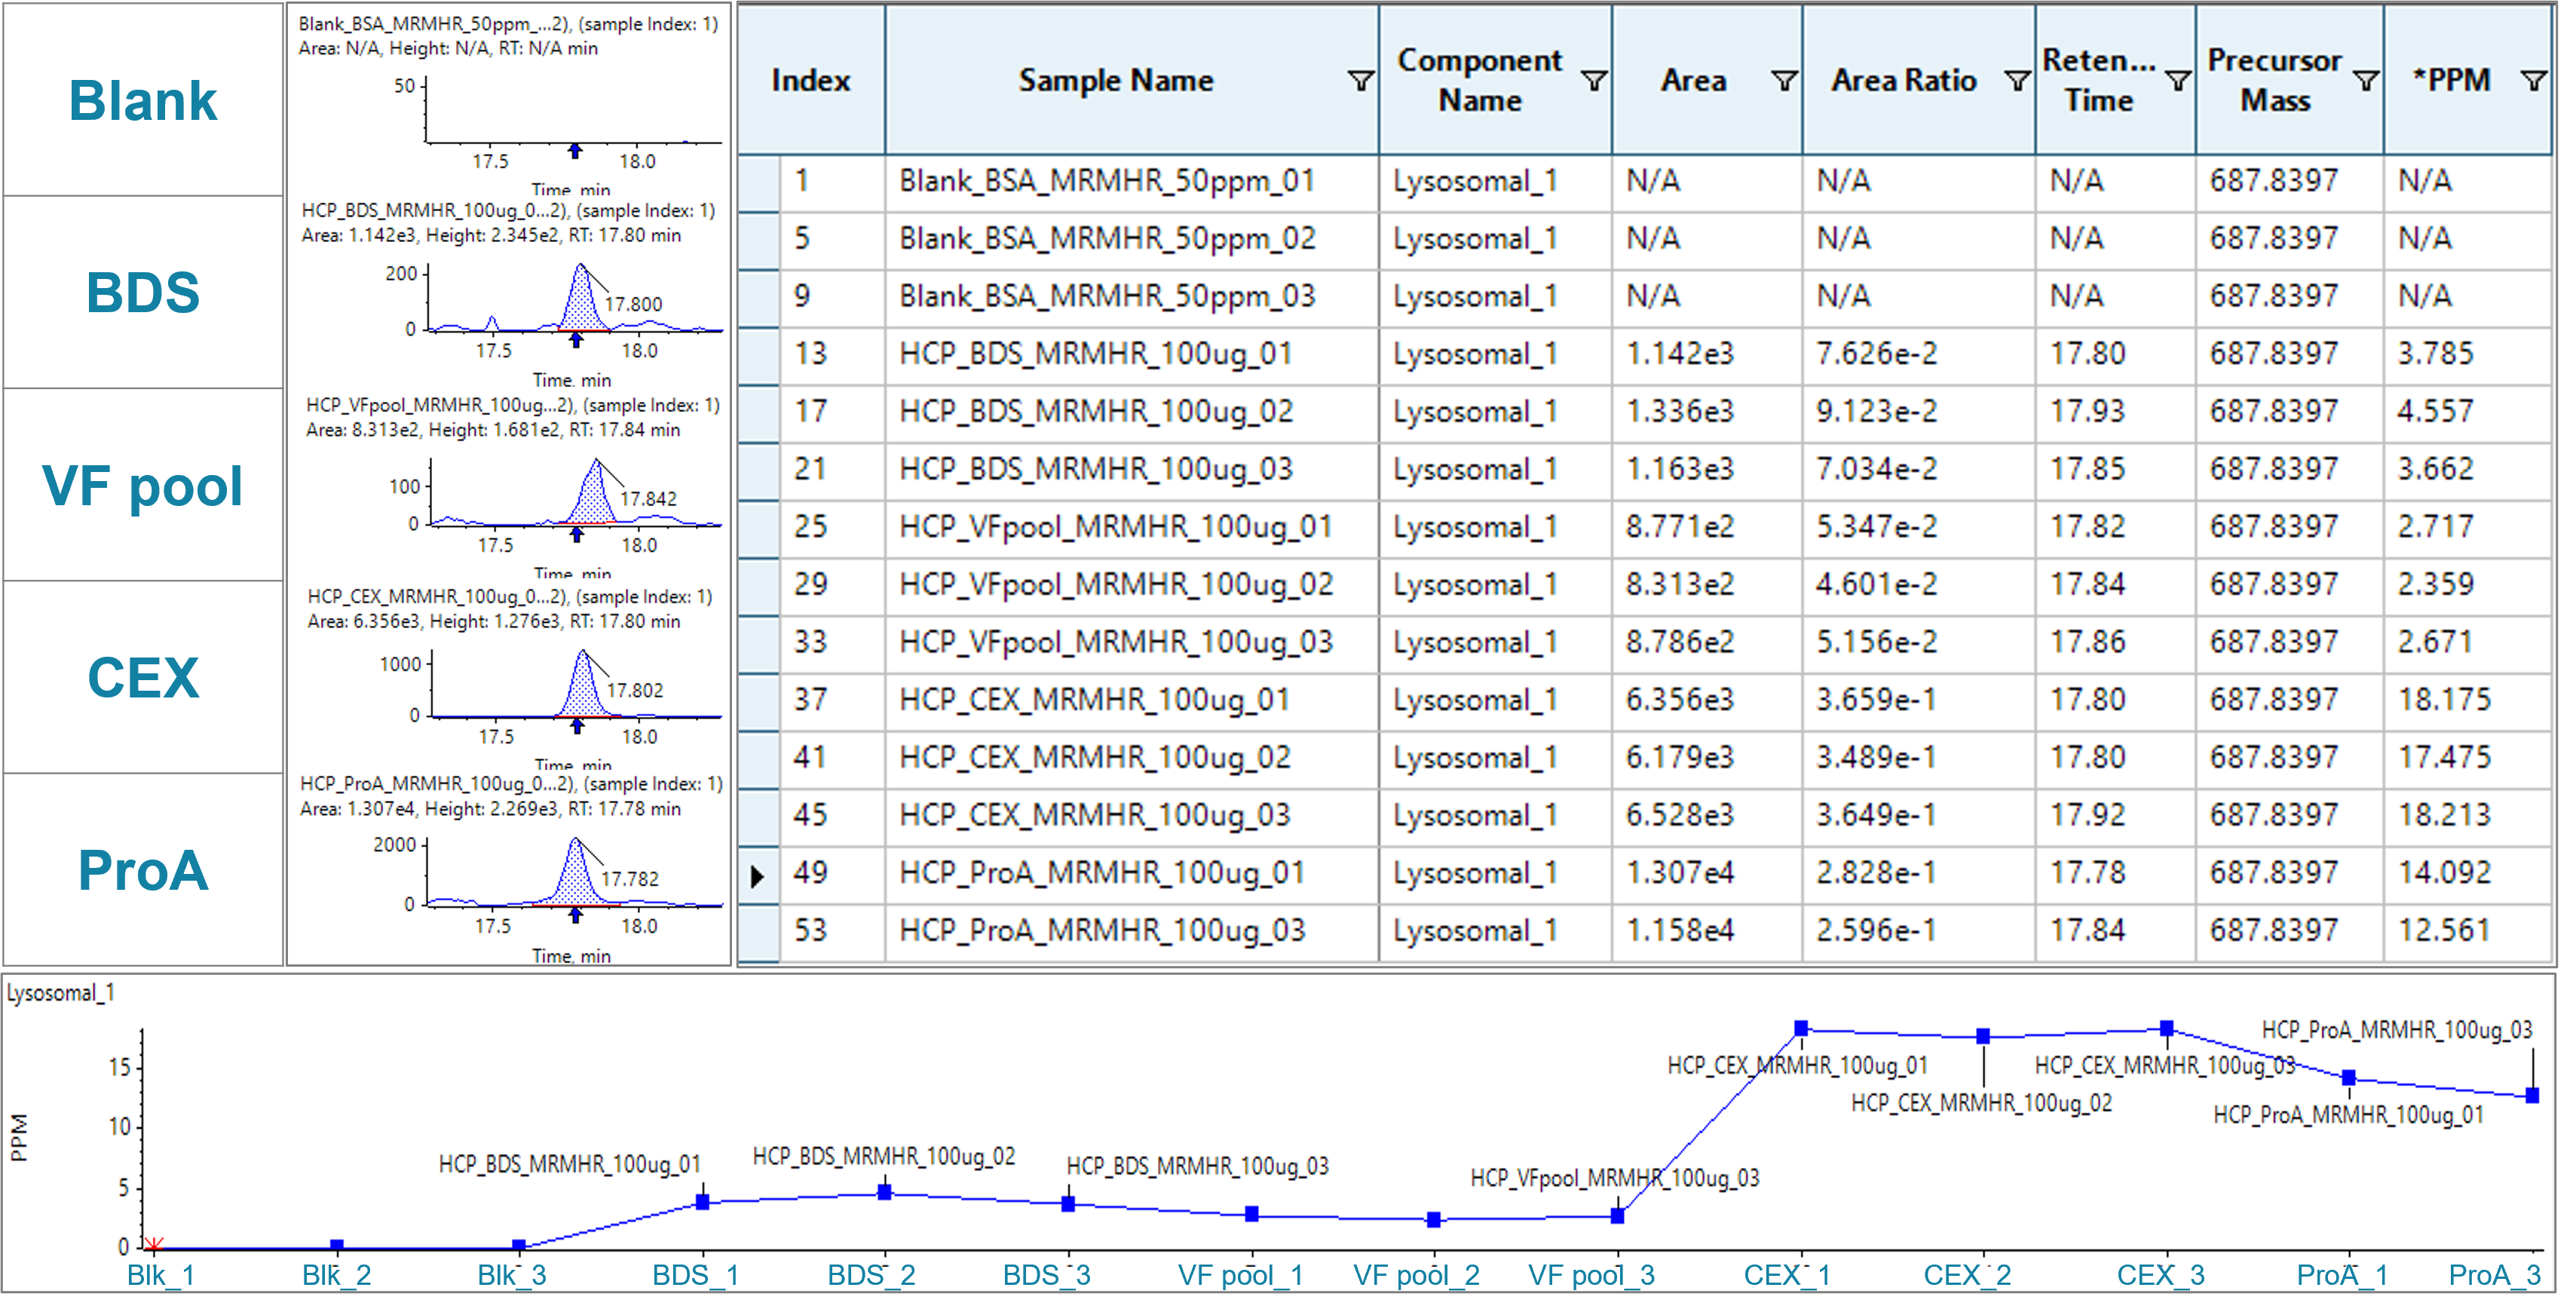
Across the different purification stages, a clear decrease of the identified HCP lysosomal protective protein from early-stage material to the final BDS was found (Figure 4). As expected, the solvent blank did not show any peak for the lysosomal protective protein. While trends can be observed based on changes of the peak area of the extracted ion chromatograms (XIC), SCIEX OS software allows for flexibility in quantification. Here, ppm values were calculated based on area ratios of the HCP peptide and a selected peptide of the spiked-in BSA at known amount.
Figure 4. MS1-based quantification for lysosomal protective protein using the DDA data. Left: samples from different purification stages from final drug to early purification stage material, including blank, BDS, VF pool, CEX and ProA. Middle: peak integration of m/z of the signature peptide. Right: quantification results table with areas, area ratios related to BSA standard, retention times, precursor m/z information and ppm calculation related to BSA standard. Bottom: Plot of ppm values of lysosomal protective protein across the purification stages analyzed in duplicates or triplicates as indicated.
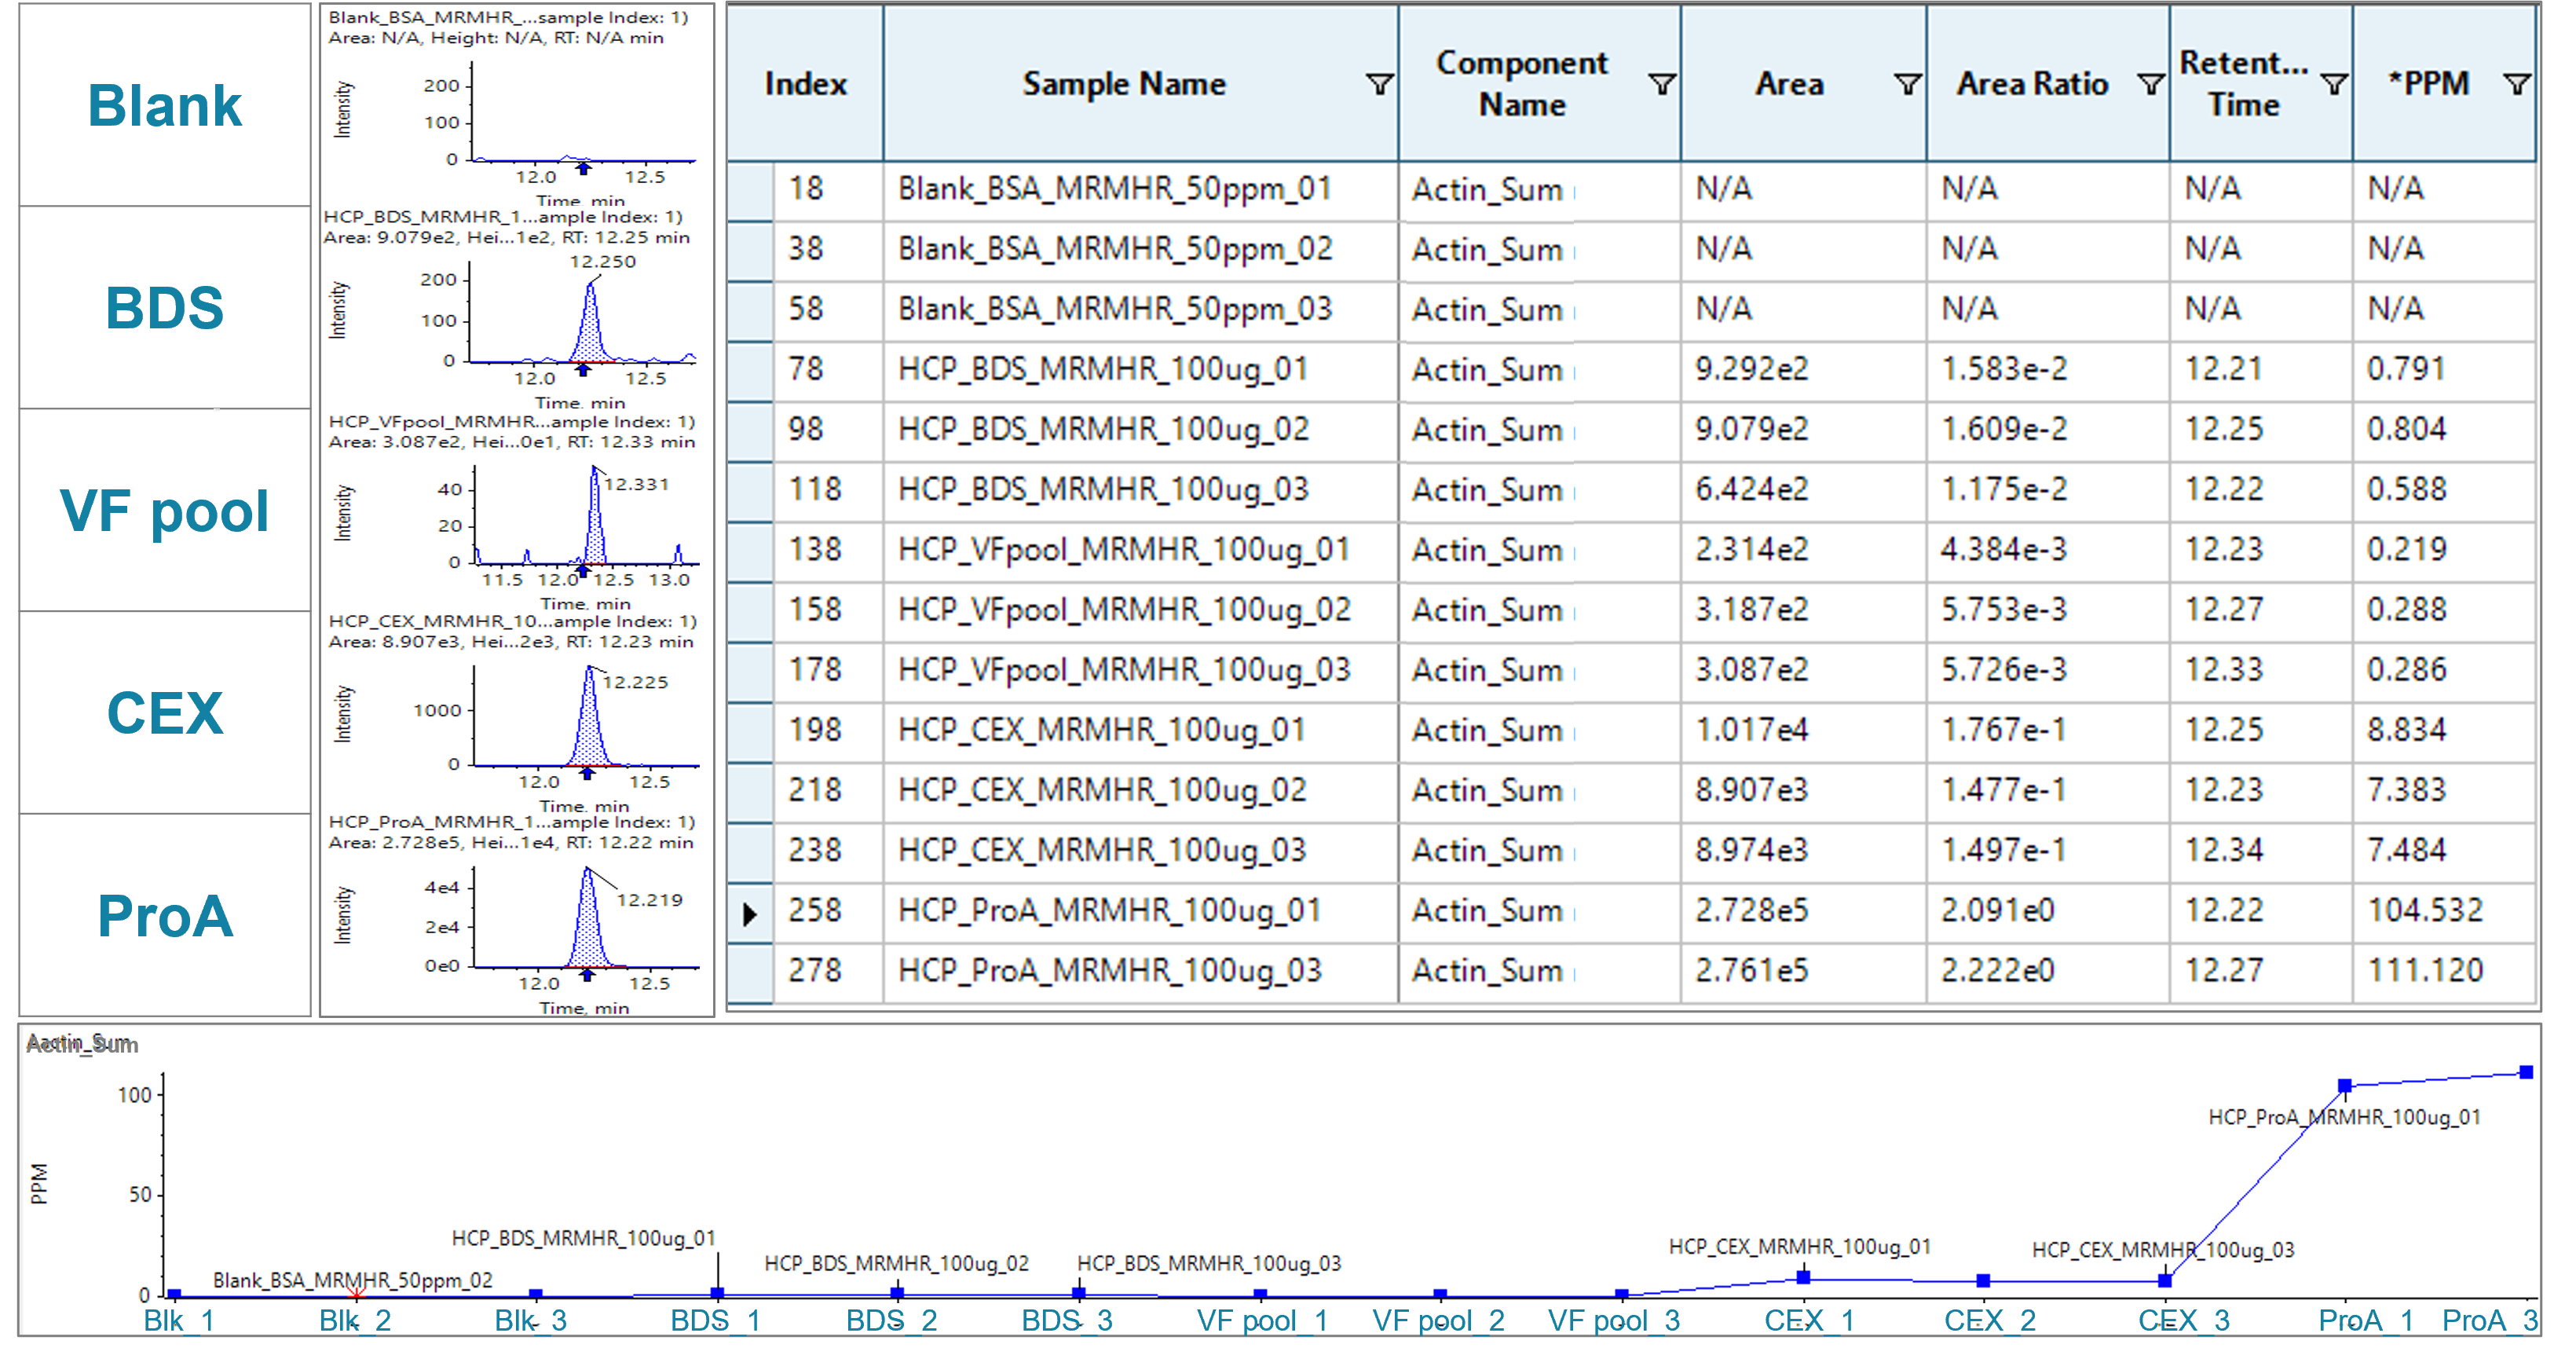
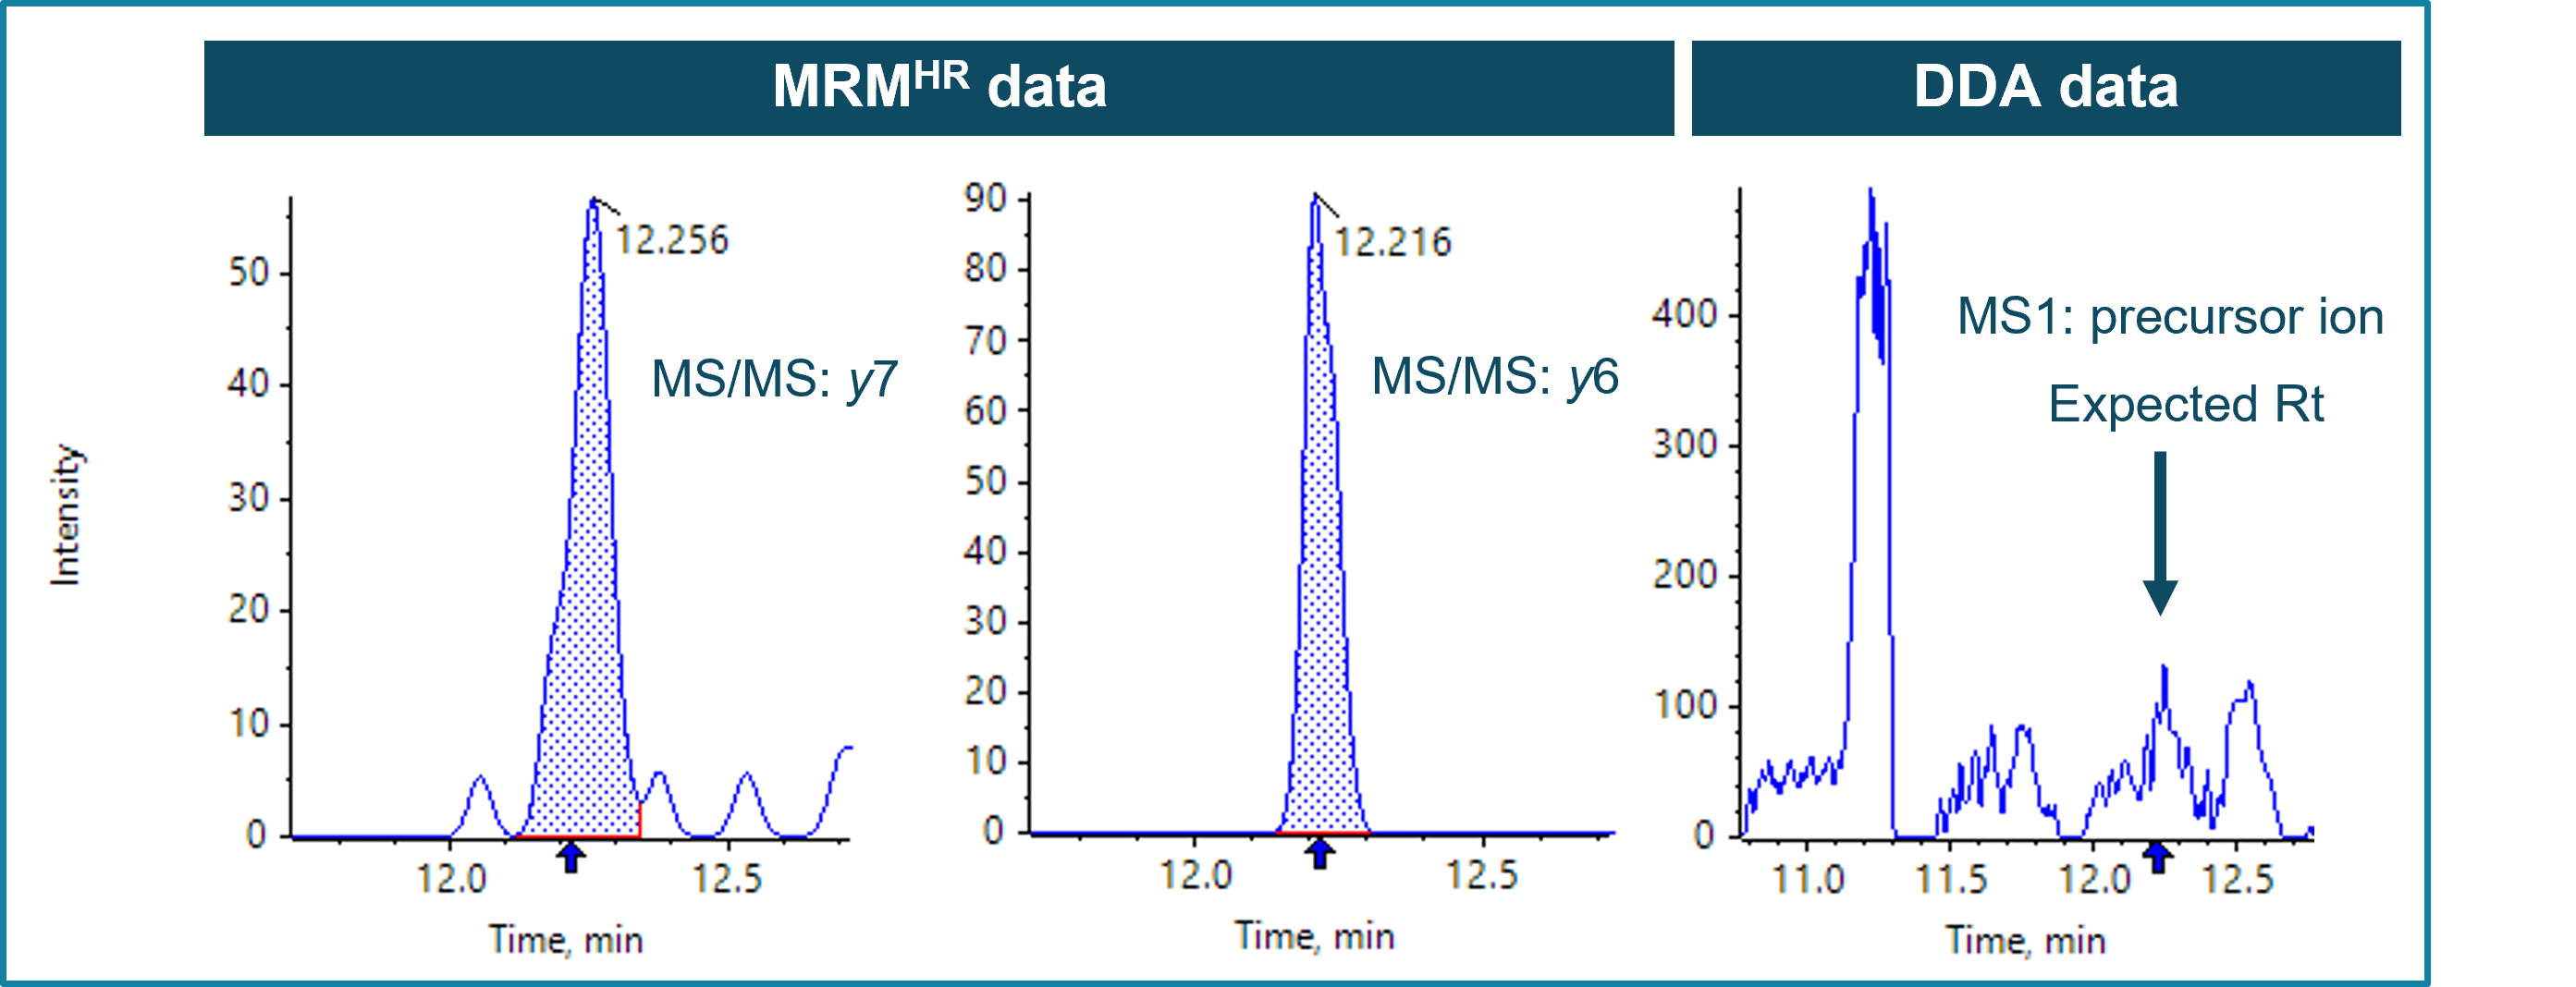
For the second HCP, actin cytoplasmic 1, no distinct peak could be used for quantification due to interferences from matrix at MS1 level (Figure 6, right). To this end, the MS/MS-based MRMHR quantification approach was leveraged, which provided the benefit of improving the specificity and sensitivity. The 3 most abundant transitions from the same signature peptide, which were targeted for MS1-based quantification, were used for MS/MS-based quantification (see quantification method setup in Figure 3b). Distinctive peaks from the sum of XICs of the selected fragments could be observed in all HCP samples resulting from the improved specificity by MRMHR (Figure 5).
Figure 5. MS/MS-based quantification of actin cytoplasmic 1 with an MRMHR approach. Left: samples from different purification stages from final drug to early purification stage material, including blank, BDS, VF pool, CEX and ProA. Middle: peak integration of m/z of the sum of the most abundant 3 fragments of the signature peptide. Right: quantification results table with areas, area ratios related to BSA standard, retention times and ppm calculation related to BSA standard. Bottom: Plot of ppm values of actin across the purification stages analyzed in duplicates or triplicates as indicated.
With that approach, the actin cytoplasmic 1 protein was determined to be at 0.73 ppm and 0.26 ppm in BDS and VF pool, respectively. The results show that MRMHR achieved sensitivities down to the sub-ppm level. This can be attributed to the XICs of the selected fragments showing little to no background compared to the XIC of the precursor at MS1 (Figure 6). Summing of intense fragments with low background can further enhance the sensitivity of the assay. Overall, a decreasing trend of actin was observed from the early-stage material to the final drug, indicating the purifications steps successfully removed a large part of the HCP impurities.
Figure 6. XICs from MRMHR and DDA data of actin cytoplasmic protein 1 in BDS. Examples show two fragments used for quantification at MS/MS level (y7 and y6) as well as the XIC for the related precursor for MS1-based quantification. Significantly better S/N was observed XICs from fragment ion using MRMHR (left and middle) compared to MS1-based XIC (right).
Results from a ligand-binding assay determined the total HCP amount to be around 1 ppm in the final BDS sample (data not shown) compared to ~4 ppm of lysosomal protective protein and <1 ppm of actin based on LC-MS analysis. While for some HCPs and samples good correlation between ligand-binding assays and LC-MS can be found, it is crucial to understand that both assays are fundamentally different and not all information can be bridged. Each assay has its advantages and drawbacks for different scenarios and user-needs. Overall ligand-binding assays are easy to use and have increased throughput capabilities. On the other hand, LC-MS analyses can determine the identity of the proteins, which enables efficient risk management and targeted development of purification processes. Furthermore, changes within the HCP content — even if the overall amount stays the same — can be detected with LC-MS whereas a ligand-binding assay would be blind to such changes. While detection of HCPs in a ligand-binding assay is dependent on the effectiveness of antibodies raised in a host, ionization efficiency is needed for detection in an LC-MS assay. In sum, having versatile assays in the toolbox for HCP determination is key to ensuring safe and effective drugs.
Conclusion
- Versatility and flexibility for robust and highly confident identification and quantification of HCPs meeting different user needs is offered through DDA, MRMHR and SWATH acquisition featured on the ZenoTOF 7600 system
- Highly confident identification of HCPs from early purification stages all the way to final DS of biotherapeutic samples is achieved by high-resolution MS/MS generated by DDA
- Streamlined identification and quantification of HCPs was demonstrated using MS1-based quantification in SCIEX OS software, leveraging a 1-injection workflow
- Superior quantitative performance for HCPs reaching sub-ppm levels can be achieved on the ZenoTOF 7600 system with MRMHR
- Quantification of all detectable proteins based on MS/MS without extensive LC-MS method development can be achieved with SWATH acquisition
References
- Huang, Lihua, et al. (2017) A novel sample preparation for shotgun proteomics characterization of HCPs in antibodies. Anal. Chem. 89(10): 5436-5444.
- Takashi Baba, Pavel Ryumin, Eva Duchoslav et al. (2021) Dissociation of biomolecules by an intense low-energy electron beam in a high sensitivity time-of-flight mass spectrometer. J. Am. Soc. Mass Spectrom. 32(8):1964-1975.
- Qualitative flexibility combined with quantitative power using the ZenoTOF 7600 system. SCIEX Technical note, RUO-MKT-10-13322-A.
 Click to enlarge
 Click to enlarge
 Click to enlarge
 Click to enlarge
 Click to enlarge
 Click to enlarge
 Click to enlarge
 Click to enlarge
 Click to enlarge
 Click to enlarge