Abstract
Some UV filters may possess potential endocrine-disrupting properties and cause environmental damage and these compounds are starting to be banned in various regions. These compounds can be found in food packaging materials and in commercial sun care products. Here, a method using LC-MS/MS on the QTRAP 4500 system has been developed for the detection and quantification of octocrylene, avobenzone, oxybenzone, octisalate, homosalate, and 10 other common UV filters found in commercial sunscreens. Using simple sample preparation, good sensitivity, linearity and recovery was observed with this method.
Introduction
Scientists have put increasing pressure on the US Food and Drug Administration (FDA) to remove some sunscreens from the market. This is in light of recent data that suggest that some UV filters may possess potential endocrine-disrupting properties.1 In 2021, oxybenzone and octinoxate were banned in Hawaii and Key West, Florida after evidence suggested these UV filters contribute to coral reef bleaching.2,3 Following this information, beginning January 1, 2023, 2 more UV filters, octocrylene and avobenzone, will be banned in several US states.4
Recent studies show that the presence of octocrylene in commercial sun care products poses a threat of benzophenone contamination. This contamination might be attributed to the degradation of octocrylene to benzophenone via retro-aldol condensation. Benzophenone is a known mutagen and carcinogen and has been banned in food products and packaging in the US. Recent findings by the FDA also show that oxybenzone, avobenzone octinoxate, octisalate, octocrylene and homosalate are systemically absorbed into the skin.5,6 With more stringent EU restrictions, pressure on the US FDA and sunscreen regulations differing around the globe,7 it is important that the levels of these compounds in sun care products are assessed.
Here, a method was developed to detect and quantify octocrylene, avobenzone, oxybenzone, octisalate, homosalate and 10 other UV filters commonly found in commercial sunscreens using the QTRAP 4500 system (Figure 1, example for oxybenzone).
Key features of the QTRAP 4500 system for UV filter analysis
- Sensitivity of the QTRAP 4500 system for UV filter analysis permits detection at levels as low as low-ng/mL
- Linearity was assessed between 1–200 ng/mL and an r value of >0.99 was achieved
- Spiked sample recovery values between 70–130% were achieved when compared to an external standard calibration curve
- Quantification results using both quantifier and qualifier ions were confirmed by ion ratio
- Quantification of UV filters in commercial products confirm label claims.
Methods
Standard preparation: A mixed stock solution of 15 UV filters was prepared by weighing 10 mg of each standard and dissolving in 10 mL of methanol (1000 µg/mL). The solutions were vortexed until dissolved. A stock solution containing 2-phenyl-5-benzimazole sulfonic acid (PBSA) was prepared by dissolving 10 mg in 20 mL of methanol (500 µg/mL). A lower concentration stock solution of PBSA was prepared because it is sparingly soluble in methanol.
A 100 µL aliquot of the 1000 µg/mL stock solution and a 200 µL aliquot of the PBSA 500 µg/mL stock solution were then diluted in 10 mL of methanol (10 µg/mL mixed stock solution). The resulting solution was vortexed for 30 seconds. The solution was then used to construct a calibration curve between 1–200 ng/mL in methanol.
Sample preparation: A 10 mg sample of sunscreen was weighed and 10 mL of methanol was added. The resulting mixture was vortexed for 5 minutes before being shaken by hand. The solutions were then centrifuged for 5 minutes on the highest centrifugation setting (4500 rpm) before the supernatant was filtered through a 0.22 µm PTFE syringe filter into HPLC vials for analysis.
Pre-spiked sample preparation: A 10 mg sample of sunscreen was weighed and spiked with 100 µL of a 5000 ng/mL mixed standard solution before 9.9 mL of methanol was added. The resulting mixture was vortexed for 5 minutes before being shaken by hand. The solution was then centrifuged for 5 minutes on the highest centrifuge setting (4500 rpm) and the supernatant was filtered through a 0.22 µm PTFE syringe filter into HPLC vials for analysis. The final spiked mixture contained 50 ng/mL of each UV filter.
Post-spiked sample preparation: A 10 mg sample of sunscreen was weighed and 10 mL of methanol was added. The resulting mixture was vortexed for 5 minutes before being shaken by hand. The solution was then centrifuged for 5 minutes on the highest centrifuge setting (4500 rpm) before 990 µL of the supernatant was filtered through a 0.22 µm PTFE syringe filter into HPLC vials. To this solution, 10 µL of a 5000 ng/mL mixed standard solution was added. The final spiked mixture contained 50 ng/mL of each UV filter.
Chromatography: The ExionLC AD system was used with a Phenomenex Luna Omega Polar C18 analytical column (100 Å, 3 µm, 100 mm x 4.6 mm).
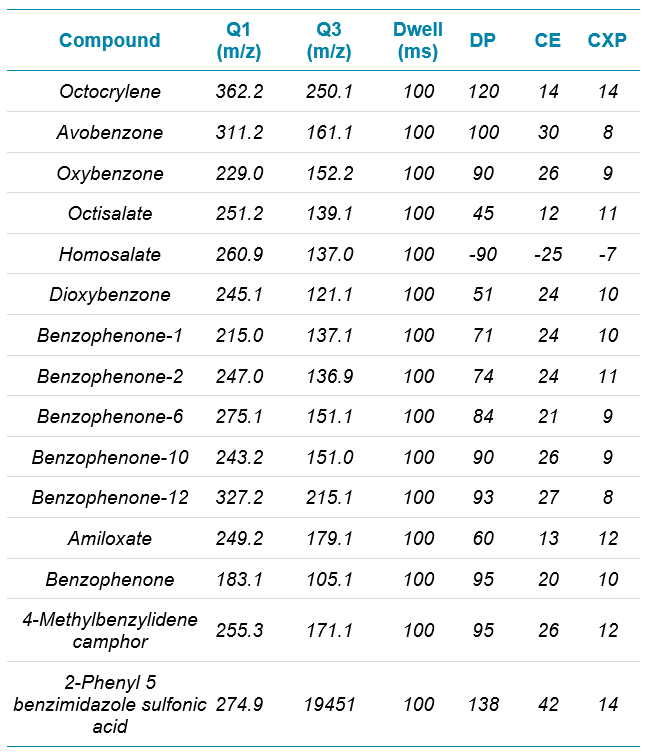
Mass spectrometry: The QTRAP 4500 system was operated in positive ion mode for 14 UV filters and negative ion mode for homosalate using electron spray ionization (ESI) (Table 1).
Data processing: All data were processed using SCIEX OS software.
Results
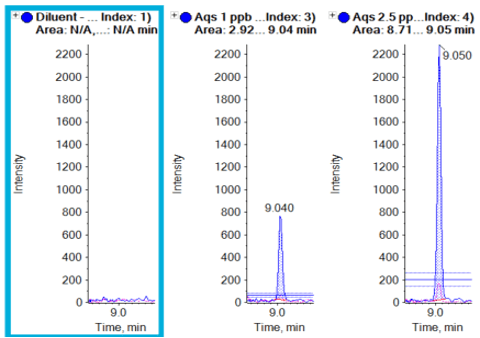
Good separation was achieved for the 15 different compounds using the optimized chromatography method (Figure 2). The use of polarity switching between positive and negative ion modes allowed all compounds to be analyzed in a single method. Calibration curves were generated for all compounds analyzed across a 1–200 ng/mL concentration range. As observed in Table 2, accurate quantification was achieved across this range with an r value >0.99. Figure 3 shows an example calibration curve for octocrylene using the quantifier transition to highlight the linear range of 1–200 ng/mL and an r value >0.99. Table 2 highlights the S/N values of the lowest calibration point for each compound analyzed. The S/N values for some compounds highlight that it may be possible to achieve LLOD and LLOQ values below 1 ng/mL in future studies (Table 2).
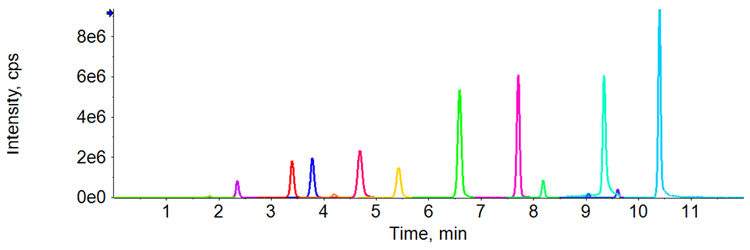
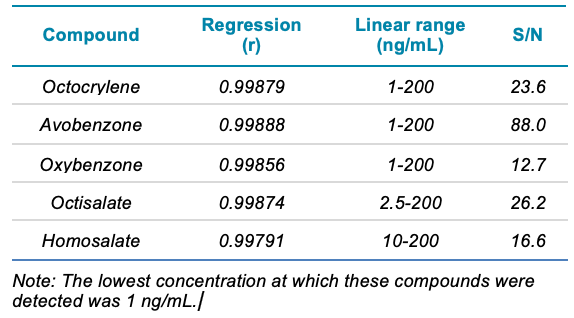
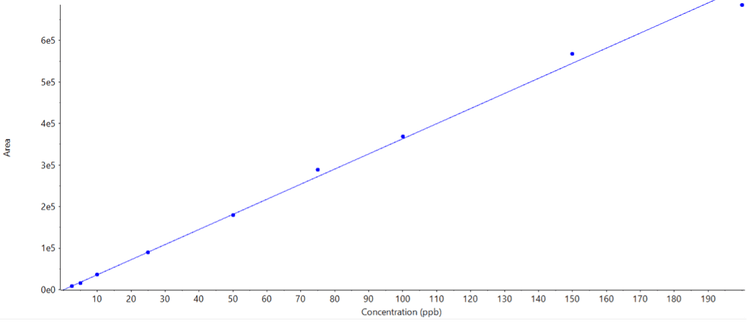
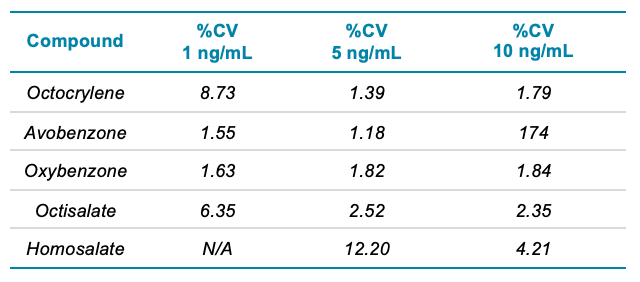
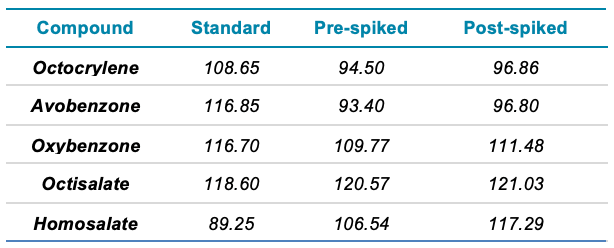
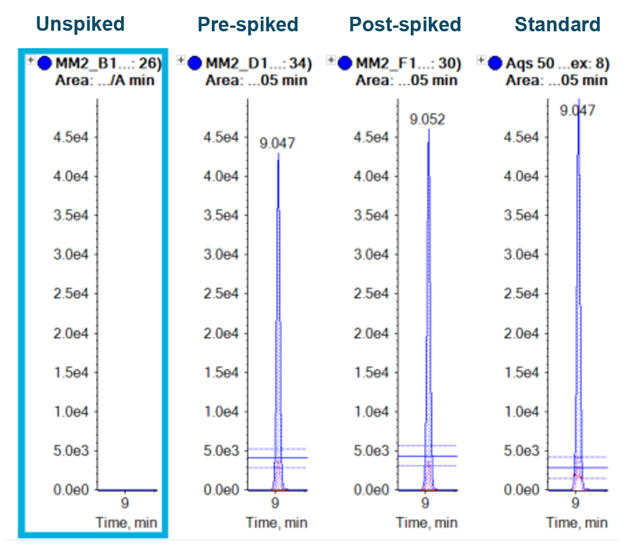
Figure 5 shows the overlaid XICs of the quantifier and qualifier ions with ion ratio lines to indicate the ±30% tolerance for the qualifier transition. Ion ratio processing is easily performed in the Analytics module of SCIEX OS software, which flags samples if the ion ratio tolerances are exceeded. The XICs show no interference in the blank sample at the retention time of octocrylene. Clear peaks are seen at the retention time at the lowest concentration that was analyzed (1 ng/mL).
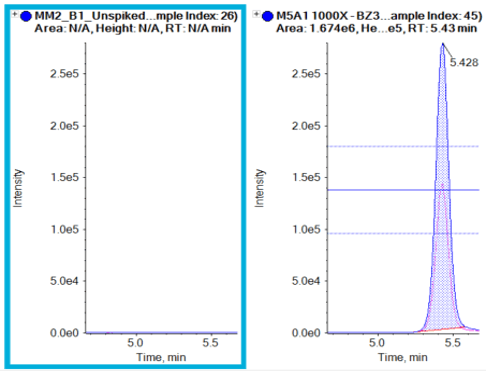
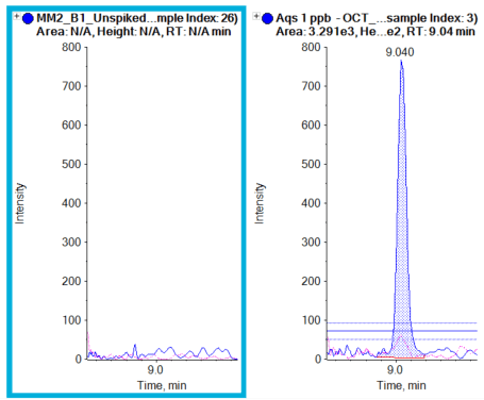
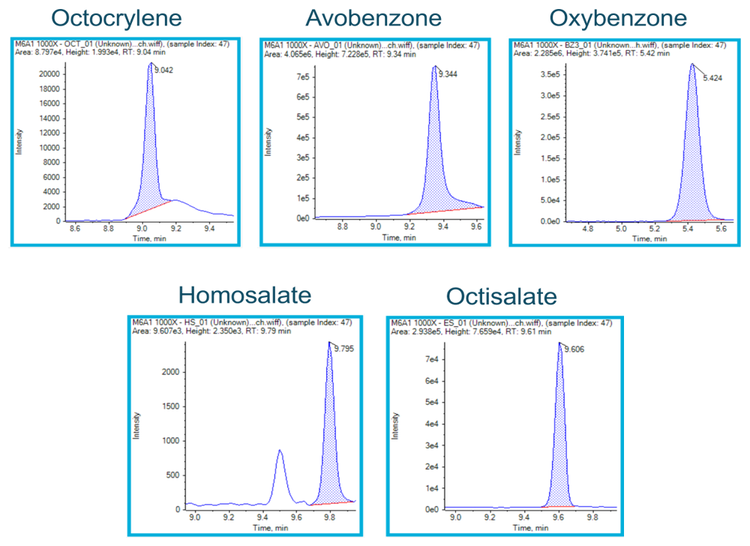
Various commercial sunscreens were tested to confirm label claims. Figure 6 shows results from a sunscreen brand that was labeled octocrylene-free. The label claim was confirmed for this example, as no octocrylene was present, compared to an octocrylene standard. Other brands of commercial sunscreens were tested for oxybenzone, octisalate and homosalate. These compounds were absent from the samples tested, further confirming label claims. In addition, a commercial sunscreen brand that claims to contain octocrylene, avobenzone, oxybenzone, octisalate and homosalate was tested and all compounds were successfully detected using this method (Figure 7).
Conclusions
- A method was developed for the analysis of 15 common UV filters in commercial sunscreens
- Simple, rapid and robust sample preparation with no SPE cleanup
- S/N ratios highlight the sensitivity provided by the QTRAP 4500 system
- Linearity spanned 1–200 ng/mL with an r value >0.99 achieved for all compounds analyzed, therefore providing accurate quantification across this range
- Spiked sample recovery values between 70–130% were achieved when quantified against an external standard calibration curve
- Sensitive detection of UV filter compounds in commercial sunscreens enables label claim confirmation
- The method allows fast response to upcoming regulation changes. New UV filters can be easily incorporated into this existing method.
References
- Benzophenone Accumulates over time from the degradation of Octocrylene in Commercial Sunscreen products- March 2021
- Key West bans Sunscreen Containing Chemicals believed to Harm coral reefs - Feb 2019
- These 7 Destinations Are Banning Certain Sunscreens - May 2021
- Cosmetic business- Researchers call on FDA to pull octocrylene-containing sunscreens from shelves - August 2021
- Effect of Sunscreen Application Under Maximal Use Conditions on Plasma Concentration of Sunscreen Active Ingredients: A Randomized Clinical Trial - June 2019
- USA FDA updates, Sunscreen Drug Products for Over-the-Counter Human Use - February 2019
- Sunscreen regulations across the globe: What the industry needs to know- August 2019