A rapid, direct injection LC-MS/MS method for the quantification of haloacetic acids (HAAs) in drinking water
Using the SCIEX 5500+ system
Amy Heffernan,1 Shalona Anuj2 and Cassandra Kelly2
1SCIEX, Australia; 2Queensland Health Forensic and Scientific Services, Australia
Abstract
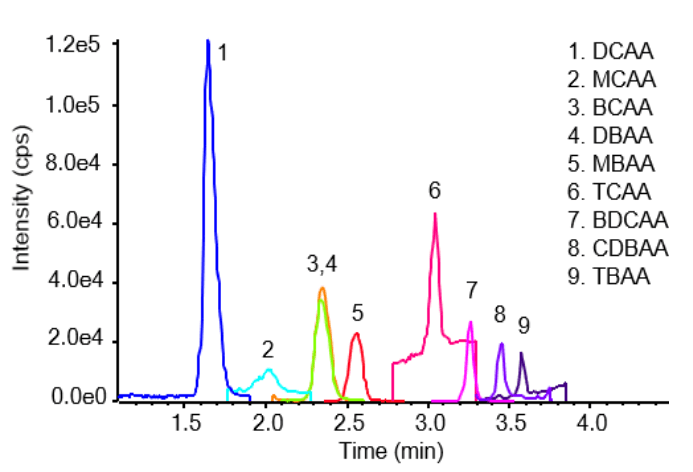
This technical note describes an LC-MS/MS method to quantify haloacetic acids (HAAs) in drinking water using direct injection, achieving detection limits of 1 ppb (ug/L) for 7 out of 9 HAAs analyzed. The sensitivity of the SCIEX 5500+ system allowed for detection limits siginficantly below regulatory levels without the need for time-consuming sample preparation (e.g., SPE). Further, a reversed-phased LC chromatography method avoided the derivatization techniques required in GC methods, ultimately saving additional time. Figure 1 highlights the overlaid extracted ion chromatograms (XICs) of all compounds analyzed at 50 ppb.

Introduction
Unsafe drinking water is a global public health issue and resulted in 1.2 million deaths in 2015, and diarrheal deaths alone contributed 1.9% to the global disease burden.1 Chlorine is an effective and low-cost disinfection agent but may generate harmful disinfection by-products, including haloacetic acids (HAAs), which have been described as cytotoxic and mutagenic.2 EU Directive 2020/21843 regulates 5 representative HAA substances, including: monochloroacetic acid (MCAA), dichloroacetic acid (DCAA), trichloroacetic acid (TCCA), monobromoacetic acid (MBAA), dibromoacetic acid (DBAA) and tribromoacetic acid (TBAA). According to this directive, the sum of these HAA substances must be below 60 µg/L in drinking water. The total amount of HAAs is typically measured only when disinfection methods are used for disinfecting water intended for human consumption.
Gas chromatography (GC) is commonly used for quantifying HAAs and has been approved by the US EPA. However, GC methods require long runtimes, time-consuming sample extraction and derivatization steps, and low sensitivity for monochloroacetic acid. Ion chromatography-mass spectrometry methods, such as the EPA 557, require a specific instrument setup that cannot be used for reverse phase chromatography when the instrument is not used for HAA analysis.
Figure 1. An overlaid extracted ion chromatogram (XIC) of the 9 HAAs analyzed at 50 µg/L.
Key features of the SCIEX 5500+ system for HAA analysis
- SCIEX 5500+ system sensitivity allows for easy sample preparation with direct sample injection after filtering
- Sensitivity meets the regulatory requirements with an LOD of 1 ppb for most of the 9 HAAs analyzed
- High levels of accuracy, evidenced by a % recovery of the quality control (QC) samples that ranged from 99% to 124% over a 2-month period
- Custom flagging in SCIEX OS for quick identification of samples exceeding regulatory limits
Methods
Standard and QC sample preparation: HAA standards were prepared at concentrations ranging from 0.5 to 50 ppb in ultrapure water. QC samples were prepared by spiking standards into ultrapure water at 1, 5 and 50 ppb. QC samples were freshly prepared each day before analysis.
Sample preparation: A 1 mL sample of potable water was filtered through a 0.2 µm RC syringe filter, directly into a 2 mL glass vial prior to analysis. To test the performance of the method, 3 brands of bottled drinking water were used. These matrix samples were fortified at 1 and 10 ppb with each HAA and analyzed in triplicate.
Chromatography: Separation was achieved with an ExionLC AD system and a Phenomenex Synergi Hydro-RP (3.0 x 100 mm, 2.5 μm) column. The column was maintained at 40°C at a flow rate of 0.5 mL/min. An injection volume of 20 μL was used. The gradient conditions used are listed in Table 1.
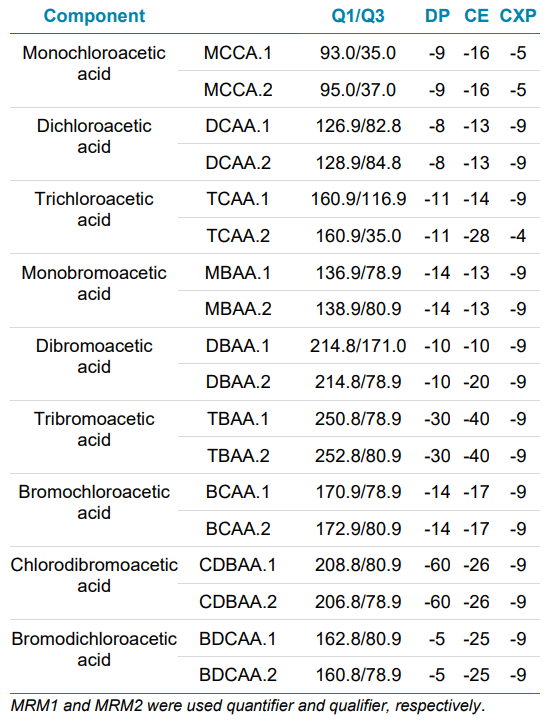
Mass spectrometry: The QTRAP version of the SCIEX 5500+ system was used for analysis. The system was operated in negative ion mode and using electrospray ionization (ESI). The MRM conditions used are outlined in Table 2.
Data processing: All data were processed using SCIEX OS software.
Table 1. Gradient elution profile for the chromatographic separation of 9 HAAs.
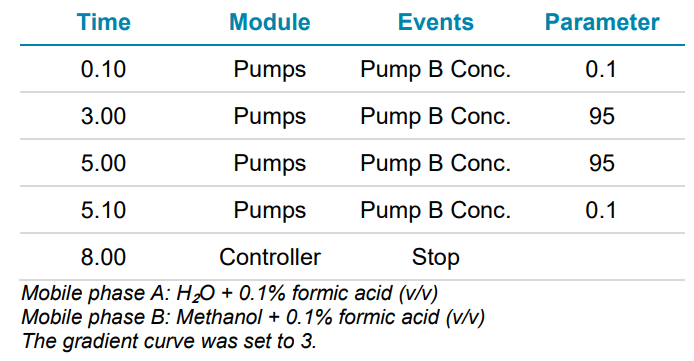
Table 2. MRM transitions for the analysis of 9 HAAs
Method robustness
QC samples were tested across 5 different days over a 2- month period. The recoveries were consistently between 99% and 124% for all QCs analyzed, highlighting the high levels of robustness and accuracy across several weeks. Figure 2 shows in more detail the recovery values achieved across each day of analysis.
Sensitivity and linearity
Figures 3-5 show this method's calibration curves and example chromatograms of the 9 HAAs analyzed. Excellent linearity and sensitivity were achieved. Seven HAAs were detected at concentrations as low as 1 ppb in the spiked sample. The only HAAs that were not detected at 1 ppb were MCAA and TCAA.
Custom flagging rules
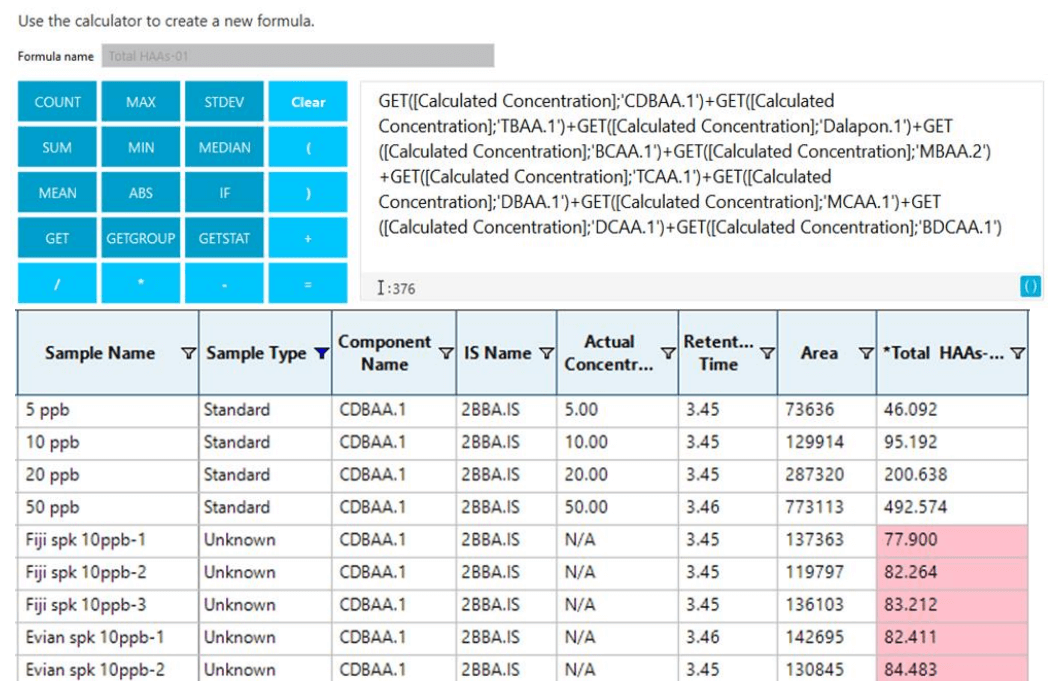
SCIEX OS software has an option to customize the result columns and flagging rules. Using this option, the user can create a column to calculate the sum of all HAAs (“Total HAAs”) and create custom flagging rules to highlight instances in which a sample contains >60 ppb of total HAAs. An example of this is shown in Figure 6, where instances in which the total concentration of HAAs is >60 ug/L are marked in red. Further details about performing automatic calculations and creating flagging rules in SCIEX OS software can be found in the application note. 4
Figure 2. QC sample recoveries from injections performed over several days. Each point represents a QC sample injection.
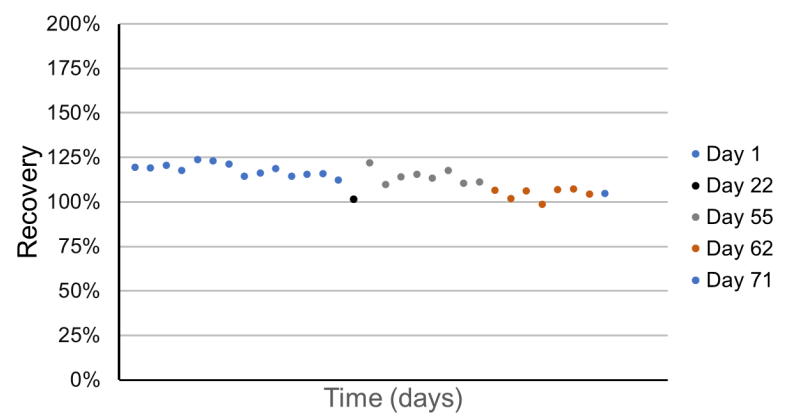
Figure 3. Example chromatograms for MCAA, DCAA, TCAA, MBAA and DBAA. Chromatograms show the matrix blank, 1 and 10 ppb sample spikes and the 10 ppb standard (left to right).
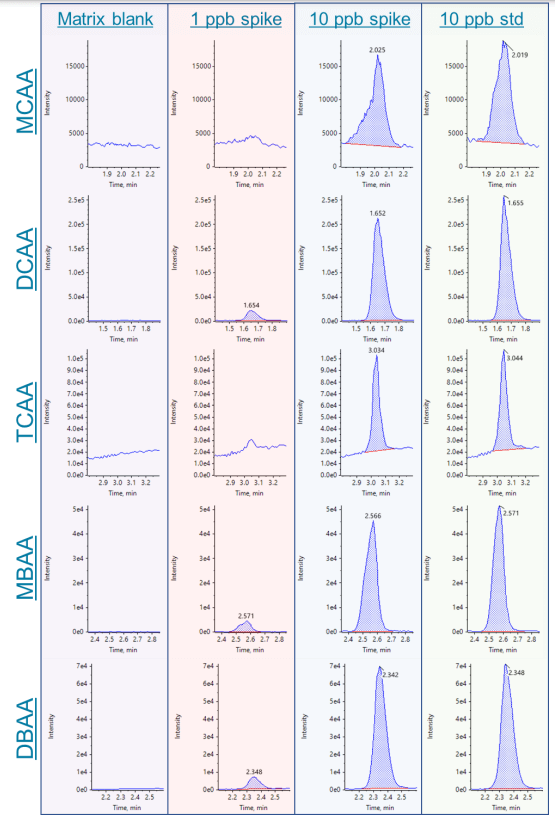
Figure 4. Example chromatograms for TBAA, BCAA, BDCAA and CDBAA. Chromatograms show the matrix blank, 1 and 10 ppb sample spikes and the 10 ppb standard (left to right)
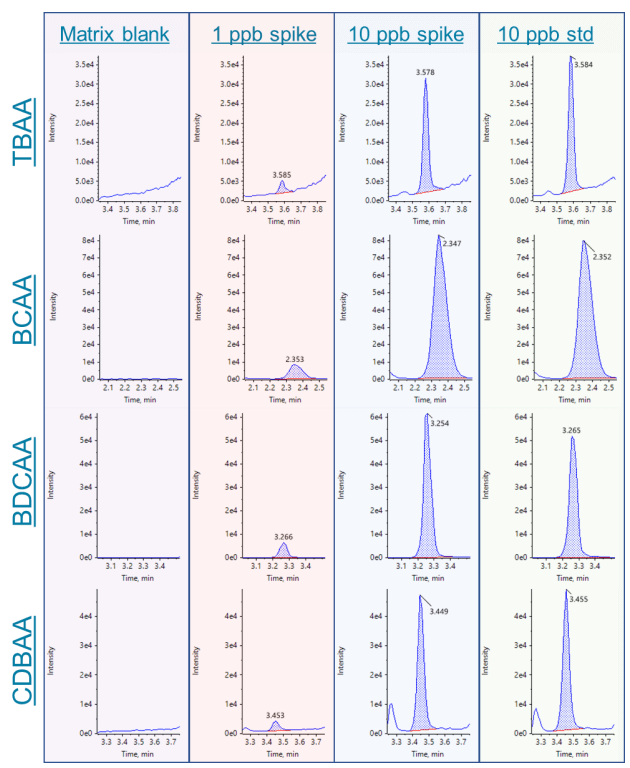
Figure 5. Calibration curves for the HAAs analyzed in this method.
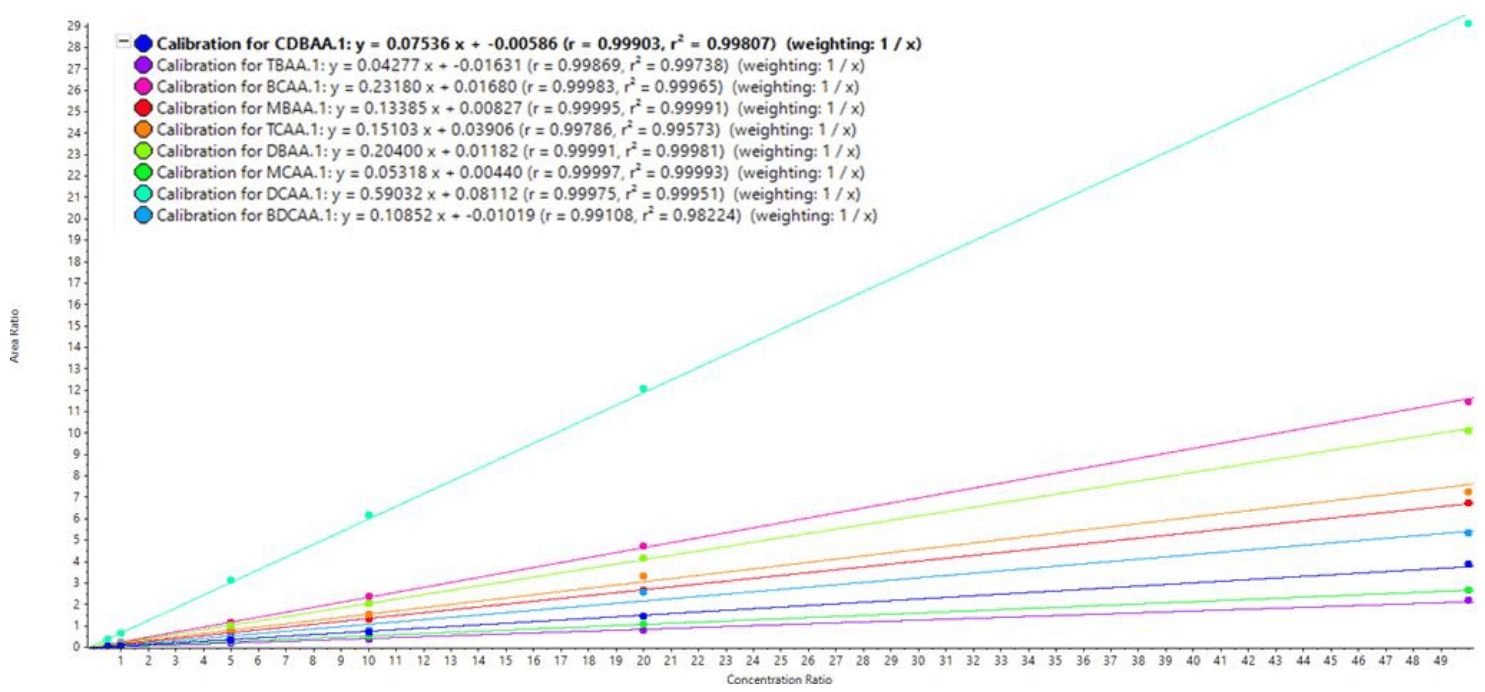
Figure 6. Automatic calculations to flag samples with HAA concentrations above regulatory limits. (Top) The method setup for implementing Calculated Columns in SCIEX OS software to sum the total HAA content of each sample. (Bottom) Results table with flagging rules to show samples with more than 60 µg/L total HAAs (red).
Conclusion
- A linear dynamic range spanning between 0.5-50 ng/mL was observed for all HAAs, except for MCAA (5–50 ng/mL) and TCAA (1–50 ng/mL). R values for each calibration curve were >0.99
- Sensitivity of the SCIEX 5500+ system allowed for simple sample preparation requiring only a filtration step and direct injection
- Reversed-phase LC chromatographyavoided timeconsuming derivatization steps required in GC methods
- A robust and accurate method yielded recovery values between 99% and 124% for QC samples injected over a 2- month period
- Custom flagging rules in SCIEX OS permitted fast data review for samples exceeding regulatory levels
References
- Forouzanfar et al. (2016) Global, regional, and national comparative risk assessment of 79 behavioral, environmental and occupational, and metabolic risks or clusters of risks, 1990–2015: a systematic analysis for the Global Burden of Disease Study 2015. Lancet 388:1659– 1724.
- Hrudey SE. (2009) Chlorination disinfection by-products, public health risk tradeoffs and me. Water Res. 43(8): 2057- 92.
- EU Directive 2020/2184
- CCa and CCB automatic calculation and flagging in SCIEX OS-Q Software, SCIEX application note, RUO-MKT-02- 10631-A