Abstract
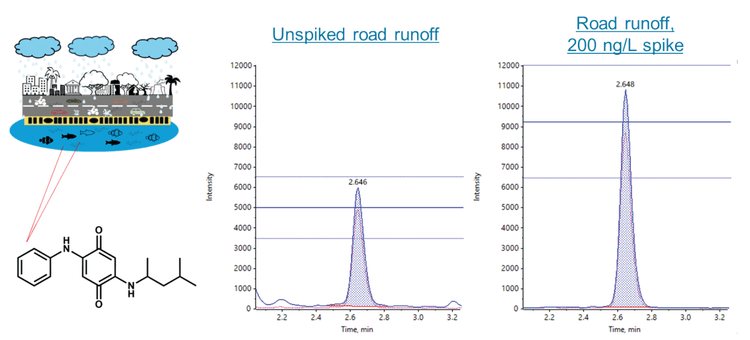
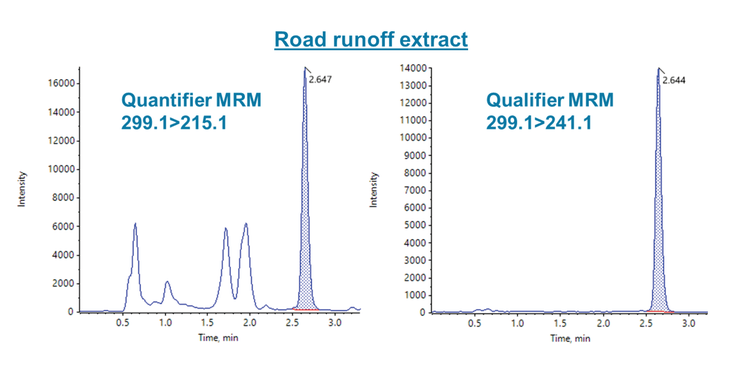
This technical note describes a direct injection method for analyzing 6PPD-quinone (6PPD-Q) in water, achieving mid-ng/L limits of quantitation (LOQ) with a runtime of 8.5 min. Using the SCIEX QTRAP 4500 system, matrix spikes into 5 different water samples at 20 and 200 ng/L showed absolute recoveries between 97% and 108%, demonstrating good data quality when quantifying against a solvent-based calibration curve. A real-world road runoff water sample was analyzed with a measured 6PPD-Q concentration of 120 ng/L (Figure 1), highlighting that the method could measure mid-ng/L 6PPD-Q levels in environmental samples. The 8.5 min gradient resulted in approximately 0.5 min separation from the road runoff interferences in the quantifier transition (m/z 299.1>215.1), while these interferences were not observed in the qualifier transition (m/z 299.1>241.1).
Key benefits of the analysis of 6PPD-quinone in water using the QTRAP 4500 system
- Mid-range ng/L sensitivity in water matrices: Good sensitivity was observed for 20 ng/L spikes in various water samples
- Method recovery across different water sources: Absolute recoveries in the 20 ng/L and 200 ng/L matrix spikes ranged from 97% to 108%, indicating good method performance. Further, the precision (%CV) was <10% for all matrix spikes.
- High-throughput method: The sensitive, high-throughput method used a simple dilution and direct injection sample preparation with an 8.5 min runtime
Introduction
Urban runoff mortality syndrome (URMS), also termed coho pre-spawn mortality, is a condition in which coho salmon die before spawning1. URMS has been atributed to toxic chemicals entering waterways from road runoffs during rainfall events. In 2020, a team of researchers identified 6PPD-Q as the primary casual toxic compound responsible for the coho salmon mortality2. 6PPD-Q is a transformation product of 6PPD, a ubiquitous antioxidant used in tire rubber. Tire-wear particles are washed off into streams and rivers. The study showed that the median lethal dosage (LC 50) for juvenile coho salmon was 95 ng/L. The direct injection method presented in this technical note shows mid-ng/L sensitivity while eliminating the time-consuming SPE sample preparation of EPA Method 1634.3
Methods
Standard preparation: The 6PPD-Q standard and 6PPD-Q-d5 internal standard (ISD) were purchased from TRC Canada. Analyte and internal standard stock solutions were prepared in LC-MS grade acetonitrile. Calibration standards were prepared in 50:50 (v/v), acetonitrile/water and ranged from 0.005 to 10 ng/mL. The final ISD concentration was 5 ng/mL in the calibration standards and samples.
Matrix spike recovery experiments: Method recovery was determined by performing matrix spikes (n=3) before sample preparation (pre-spike) and, in separate samples, after sample preparation (post-spike). The absolute recovery was calculated as the ratio of the pre-and post-spike area counts without ISD normalization. The apparent recovery was calculated after ISD normalization. The method recovery and the matrix effects were evaluated at 2 spiking levels, 20 and 200 ng/L.
Sample preparation: Samples were collected from different sources (LC-MS grade water, tap water, a commercial drinking water, river water and road runoff water). For each sample, a 1 mL aliquot was taken, spiked with the 6PPD-Q stock solution and diluted 1:1 (v/v) with acetonitrile containing 10 ng/mL of 6PPD-Q -d5. The vials were shaken, vortexed for 5 min and centrifuged at 4500 rpm for 5 min. After centrifugation, a 1 mL aliquot was filtered through a Phenomenex CLARIFY-PTFE 0.22 μm syringe filter (P/N: AF8-7702-12) for instrumental analysis.
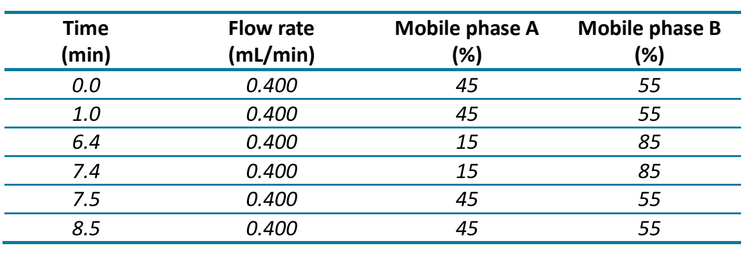
Chromatography: An ExionLC AD system was used with the Phenomenex Kinetex™ C18 column for chromatographic separation (2.6 μm, 100 mm x 2.1 mm, P/N: 00D-4462-AN). Mobile phase A was 0.1% formic acid in water and mobile phase B was acetonitrile. The flow rate was 0.400 mL/min and the gradient conditions used are shown in Table 1. The injection volume was 20 μL and the column oven temperature was 40°C. The autosampler temperature was set to 10°C and 1 mL of rinsing solution (50:50 acetonitrile/water, v/v) was used for the needle washing.
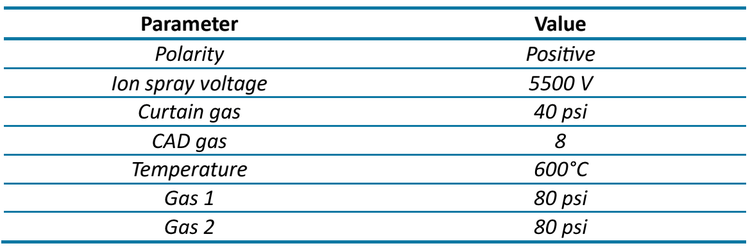
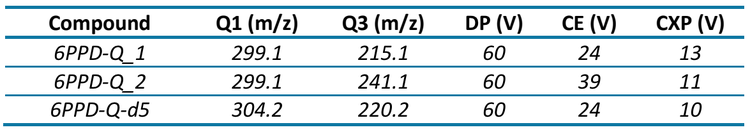
Mass spectrometry: Samples were analyzed on the QTRAP 4500 system operated in multiple reaction monitoring (MRM) mode with positive electrospray ionization. Optimized source and compound-specific parameters are shown in Tables 2 and 3, respectively. Two selective MRM transitions were monitored (Table 3). Confirmation of the target analytes was based on the ion ratio.
Data processing: All data were processed using SCIEX OS software, version 2.1.6.
Quantitative performance of 6PPD-Q in the calibration standards
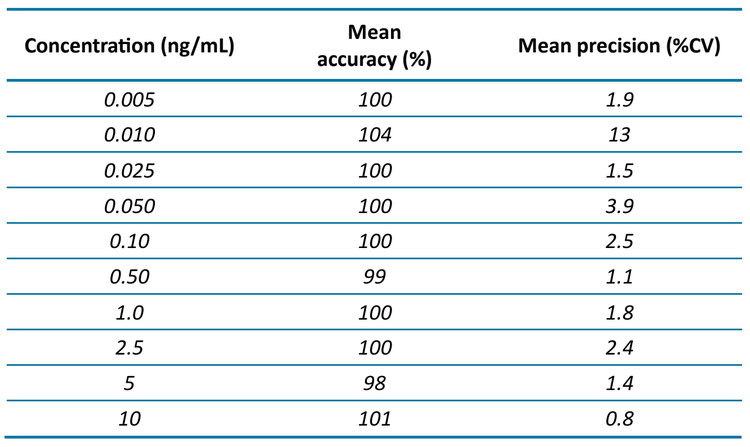
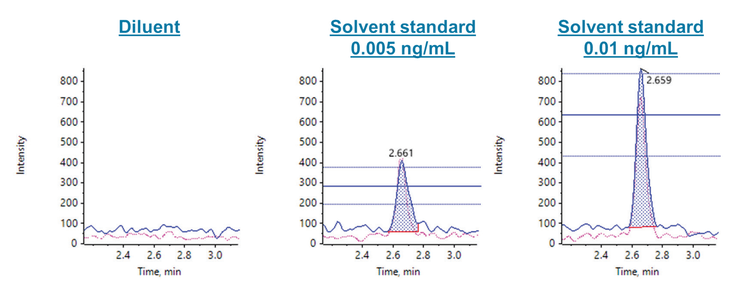
Calibration standards were injected in triplicate to evaluate the sensitivity, accuracy, precision and linear dynamic range of 6PPD-Q using the QTRAP 4500 system. The in-vial LOQ was 0.005 ng/mL (Figure 2) with a mean accuracy of 99.6% and a mean precision of 1.9% CV (Table 4). The r2 was 0.999 over the linear range of 0.005–10 ng/mL. The LOQ was chosen based on the 2 MRM transitions, which both achieved a signal-to-noise (S/N) ratio of ≥10, accuracy ±10%, precision <10% and ion ratio tolerance of ±30%. Considering the entire calibration range, the mean accuracy was within 4% and the mean precision was <3.9% CV, except for the 0.01 ng/mL level (Table 4).
Accuracy and precision in water sample spikes
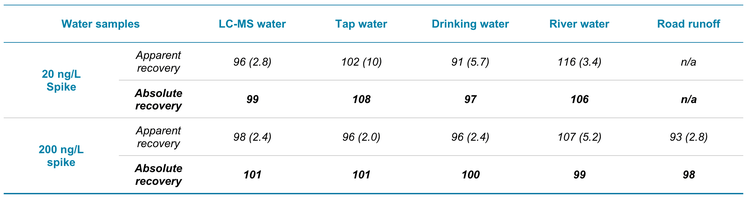
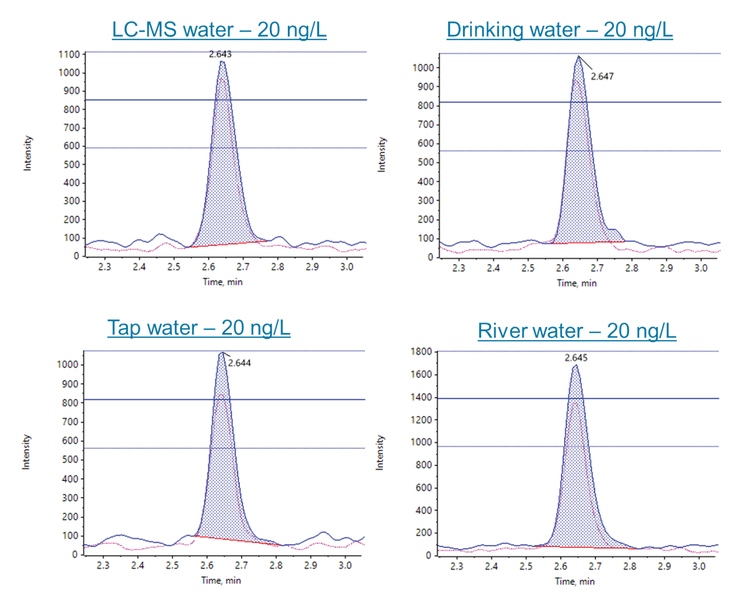
The analytical method was evaluated by spiking 6PPD-Q at 2 levels, 20 and 200 ng/L, into the 5 different water samples. XICs for the 20 ng/L spikes are shown in Figure 3. The road runoff sample was not spiked at 20 ng/L due to the background levels present. Except for the road runoff, none of the water samples showed 6PPD-Q background levels in the unspiked blanks. The samples were processed in triplicate and the unspiked and spiked samples were evaluated against the solvent calibration curve. Table 5 shows the apparent and absolute recoveries observed for the matrix spikes. The apparent recovery represents the ISD-normalized values from spikes performed at the beginning of the sample preparation. The apparent recovery ranged from 96% to 106% in the 20 ng/L spikes and from 93% to 107% in the 200 ng/L spikes. Further, the precision (%CV) was <10% for all matrix spikes. The absolute recovery represents the ratio of the non-ISD normalized pre- to post-extraction spike area counts. The absolute recoveries ranged from 97% to 108% in the 20 ng/L spikes and from 98% to 101% in the 200 ng/L spikes. These results demonstrate good method performance across different water samples, including the river and road runoff samples.
Matrix enhancement was observed in all samples, particularly the river water and the use of the stable isotope-labeled 6PPD-Q internal standard is recommended to ensure good data quality.
Interference and matrix peak in road water
6PPD-Q was detected in the unspiked road runoff water sample with a measured mean concentration of 120 ng/L. Initial experiments showed the presence of potential matrix interferences in the quantifier transition (m/z 299.1>215.1) and therefore, the chromatography conditions were optimized for separation of the 6PPD-Q peak from the interferences. These matrix interferences were only observed in the road water sample. As shown in Figure 4, the optimized conditions resulted in approximately 0.5 min separation, indicating negligible impact from the road water matrix. Interestingly, the interferences were not observed in the qualifier transition (m/z 299.1>241.1) of the road water sample. Therefore, it is recommended to use the m/z 299.1>241.1 transition for complex samples which contain matrix interferences that cannot be separated. Overall, these results demonstrate the ability to detect 6PPD-Q at environmentally relevant levels in complex water samples.
Conclusion
The technical note showed:
- The development of a high-throughput, direct injection method to analyze 6PPD-Q in environmental water samples with an 8.5 min runtime
- Low-pg/mL sensitivity in solvent standards using the SCIEX QTRAP 4500 system with an LOQ of 0.005 ng/mL
- Absolute recoveries ranging from 97% to 108% in the 20 ng/L and 200 ng/L matrix spikes
- The Phenomenex Kinetex C18 column showed good analyte retention and separation from road runoff water interferences using reverse-phase conditions
- Quantitation of 6PPD-Q at 120 ng/L in a real-world road runoff sample
References
- Department of Ecology, State of Washington. Hazardous Waste and Toxics Reduction Program Technical Memo, November 29, 2021.
- Tian, Z.; Zhao, H.; Peter, K.T.; Gonzalez, M.; Wetzel, J. et al. A ubiquitous tire rubber–derived chemical induces acute mortality in coho salmon. Science, 2020, 371 (6525),185-189. DOI: 10.1126/science.abd6951.
- United States Environmental Protection Agency. DRAFT Method 1634, Determination of 6PPD-Quinone in Aqueous Matrices Using Liquid Chromatography with Tandem Mass Spectrometry (LC/MS/MS), EPA 821-D-24-001. December 2023.