Abstract
This technical note describes two methods for the quantitation of per- and polyfluorinated alkyl substances (PFASs) in water samples. Both methods achieved accurate quantitation at levels of approximately 1-10 ng/L for more than 17 PFASs. Method 1 is compatibility with EPA Method 537.
Introduction
PFASs are unique chemicals whose physicochemical properties make them important for use in a variety of industrial and consumer products including carpets, cookware, food packaging, fire suppressants, and others.1 Chemically, PFASs are aliphatic structures containing one or more C atoms on which H substituents have been replaced by F atoms. Classification and naming is typically by the particular functional group present, such as carboxylic acids, sulfonates, phosphonic acids, etc., as well as the length of the carbon chain. Desirable in various industrial applications for their chemical stability and low reactivity, these properties also make PFASs highly resistant to degradation in aquatic environments. Typical concentrations of PFASs found in various environmental water sources range from pg/L to µg/L levels.2
Human exposure to PFAS residues has been implicated in the incidence of cancer, obesity, endocrine system disruption, and other adverse health effects.3-4 In recognition of these potential risks, sources of human exposure to these chemicals (e.g., via drinking water) are receiving public and scientific attention.
PFASs exhibit relatively high aqueous solubility and can be transported and bioaccumulated from contaminated water sources. The US EPA maintains health advisory limits for select PFASs (e.g., perfluorooctanoic acid (PFOA) at a limit of 70 ng/L) in water, but these levels have been exceeded in some areas experiencing extreme point source inputs of these chemicals.5
Given the tremendous persistence of PFASs in the environment and their known presence in human populations exposed via drinking water and other environmental routes, demonstration of the capability for accurate and precise low-level quantitation is paramount for research and testing laboratories. Robust quantitative analytical methods utilize the specificity and sensitivity of LC-MS/MS with MRM monitoring. However, a primary analytical challenge to this assay is the prevention and reduction of background PFASs originating from the LC system and contamination during sample collection and preparation.
This application note presents two methods for the quantitation of per- and polyfluorinated alkyl substances (PFASs) in water samples. While the MS/MS detection method using the SCIEX Triple Quad™ 5500 System is similar between the two methods, the sample preparation and injection volume differ significantly.
Key features of PFAS methods
- LC-MS detection using a Shimadzu LC-20ADXR coupled to a SCIEX Triple Quad™ 5500 System
- Special modifications to the pumps and autosampler are described to mitigate laboratory-based contamination of PFASs.
- Use of a delay column for separation of a contamination PFAS peak from the analytical peak
- The first method presented here utilizes a weak-anion exchange solid phase extraction (SPE) method to concentrate water samples for analysis using a 7.5 minute HPLC gradient.
- The second method utilizes dilution of a water sample in methanol and direct injection of 950 µL of the diluted sample using a 17.5 minute HPLC gradient.
- Large volume injection of an aqueous sample is intended to achieve method sensitivity while reducing accumulated background during sample concentration steps.
- Both methods achieved accurate quantitation at levels of approximately 1-10 ng/L for more than 17 PFASs.
Methods
Standards and internal standards (IS): The PFAS standards and internal standards were obtained from Wellington Laboratories (Guelph, Ontario) and were prepared in Baker HPLC-grade methanol. Standard stock solutions were prepared by dilution with 96% methanol and 4% water (purified using a Millipore water purification system).
Sampling and sample preparation: Water samples were obtained anonymously from various sources in the United States. Samples were stored in the dark at 4°C in 250 mL high density polyethlyene bottles until analysis.
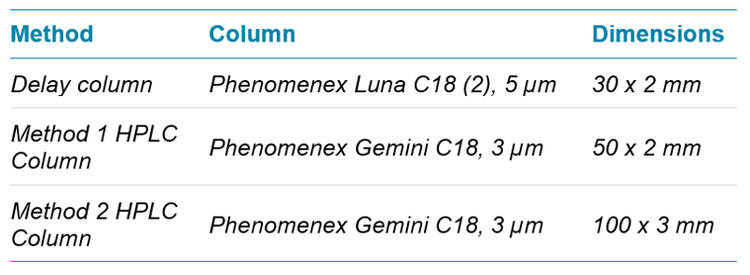
Chromatography: Shimadzu LC-20ADXR binary pumps with a Shimadzu DGU-20A5 degasser was used for separations. All fluoroethylene polymer (FEP) tubing on the Shimadzu pumps and degasser was replaced with PEEK tubing with similar internal and external dimensions. A Phenomenex Luna C18(2) column (dimensions shown in Table 1) was installed between the pump mixing chamber and the column, outside of a Shimadzu CTO-20AC column oven. This column served as a delay or hold-up column to isolate PFAS contamination originating from the pumps and eluents. A longer and/or larger diameter Luna C18(2) column must be installed on heavily contaminated systems to prevent breakthrough of contamination.
Chromatographic separation was performed using a Phenomenex Gemini C18 HPLC column at 0.6 mL/min (Table 1). The Gemini C18 column was heated to 40°C in the column oven. A PAL-HTC-xt autosampler with dynamic load-wash (DLW) was modified by replacing all FEP tubing from the rinse solvent lines, the needle seal, and the sample holding loop with PEEK or stainless steel. The autosampler syringe and sample holding loop was rinsed with methanol and 1:1 methanol:acetonitrile between samples.
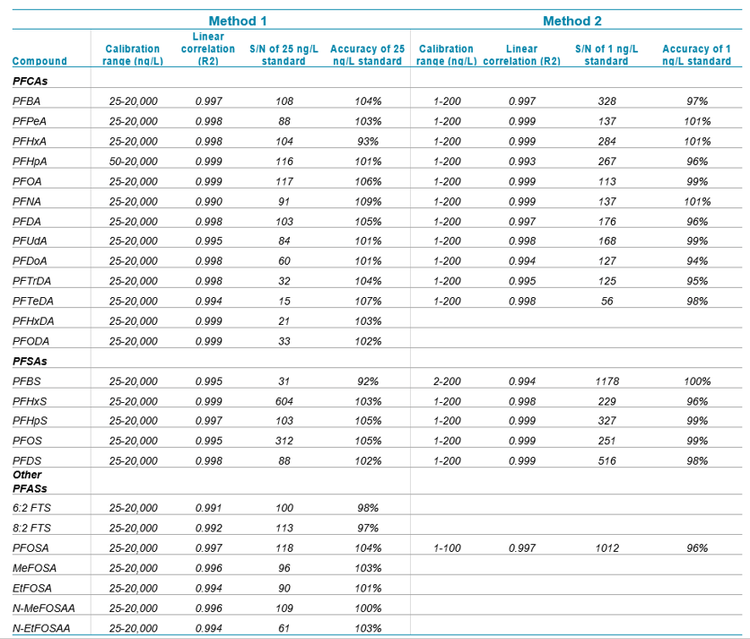
Method 1: Solid phase extraction and 10 µL injection: A mixture of surrogate standards (25 ng) was added to 250 mL water samples in the sampling bottle, and the entire volume was extracted using weak anion exchange SPE as recommended by ISO standard 251016. The empty sample container was rinsed with 10 mL of methanol with 0.3% NH4OH, which was then added to the SPE tube to elute the PFASs. The extract was evaporated to dryness, reconstituted in 500 µL of 80% methanol/20% water, and transferred to a polypropylene vial for analysis. All standards and blanks were also prepared at a final methanol concentration of 80%.
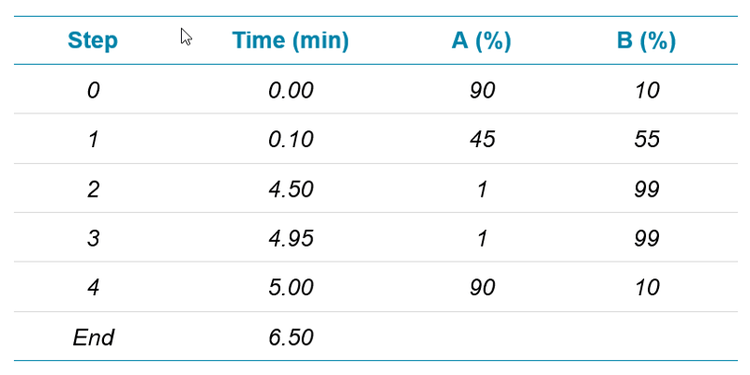
For Method 1, 10 µL injections of the standards and samples were analyzed using a 6.5 min gradient method (Table 2) with a 7.5 min total runtime, including the 1 min autosampler injection cycle. Water with 20 mM ammonium acetate was used as the “A” solvent and methanol was the “B” solvent.
Method 2: Dilution and large volume injection: A 1 mL aliquot of a water sample was added to a 2 mL clear glass autosampler vial with a polyethylene septum cap containing 0.65 mL of methanol and a mix of surrogate standards at a final concentration of 50 ng/L. The final concentration of methanol in the diluted sample was 40%, and standards, blanks, and quality control samples were all prepared at the same concentration. A PAL HTC-xt autosampler was modified to inject 950 µL of the diluted samples and standards.
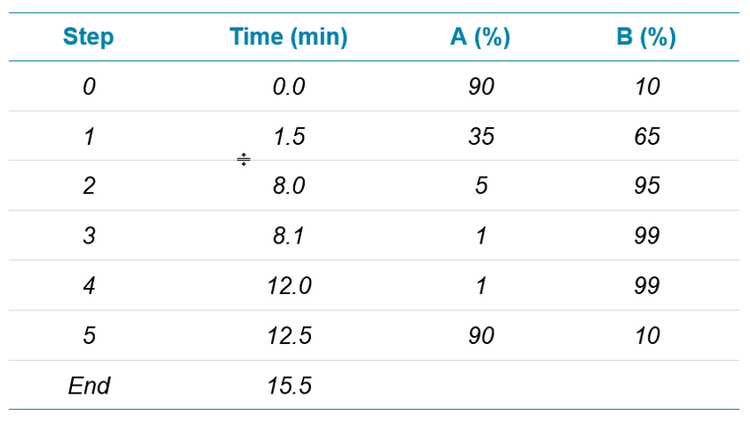
For Method 2, samples were analyzed using an extended 15.5 min gradient method (Table 3) with a 17.5 min total runtime, including the 2 min autosampler injection cycle. Water with 20 mM ammonium acetate was used as the “A” solvent, and methanol was the “B” solvent.
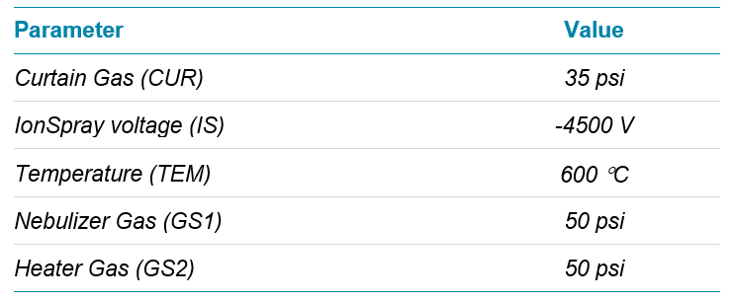
MS/MS detection: A SCIEX Triple Quad 5500 System with a Turbo V™ Ion Source and ESI probe was used for analysis in negative polarity. The ion source parameters were optimized for the LC conditions using the Compound Optimization (FIA) function in Analyst® Software (Table 4).
One characteristic MRM transition was monitored for each analyte and internal standard (Download method information 8 ). The Scheduled MRM™ Algorithm was activated to monitor compounds only during a 60 second expected retention time window to maximize dwell times and optimize the cycle time of the method. As a result, all of the peaks in the calibration contained >12 points per peak.
Calibration was performed using a 7-point curve at concentrations of 25, 50, 250, 1000, 2500, 10000, and 20000 ng/L for Method 1 and 1, 2, 5, 20, 50, 100, and 200 ng/L for Method 2. Quantitation was performed using MultiQuant™ Software 3.0.2 using 1.0 Gaussian smoothing and 1/x2 weighted linear regression. PFASs with matched isotopically labelled surrogate standards were quantified using isotope dilution, while PFASs without matched surrogate standards were quantified using internal standard calibration with structurally similar isotopically labeled standards (full analyte and internal standard list shown in Appendix Figure 1). A concentration factor of 500 was applied to samples analyzed using Method 1, and a dilution factor of 1.65 was applied to samples analyzed using Method 2.
Method 1 chromatography results
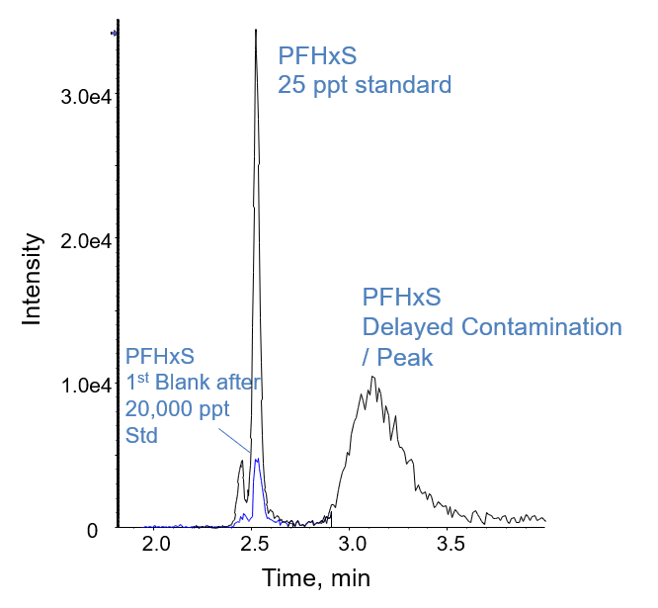
The Gemini C18 column was selected for both methods based on its strong retention and predictable resolution of PFASs. All of the other columns tested exhibited breakthrough of the short chain acids in the column dead volume during optimization of the 950 µL injection method. The Luna C18(2) column was selected as the delay column for both methods after initial testing indicated that it provided better separation of PFAS contamination than other columns. For PFASs, blank contamination is a major concern for analysis due to potential contamination during sample preparation or contamination originating from analytical instrumentation. Figure 1 shows a small carryover peak at 2.5 min for PFHxS in a blank analyzed immediately following the injection of the highest calibration standard of 20,000 ng/L. The area of the carryover peak was only 0.078% of the highest standard and 21% of the lowest calibration standard for Method 1 (25 ng/L). The second peak at 3.2 min in Figure 1 is attributed to delayed PFHxS contamination originating from the HPLC pumps. Without the delay column, this contamination would instead focus on the analytical column and elute at 2.5 min along with the standard and sample peak.
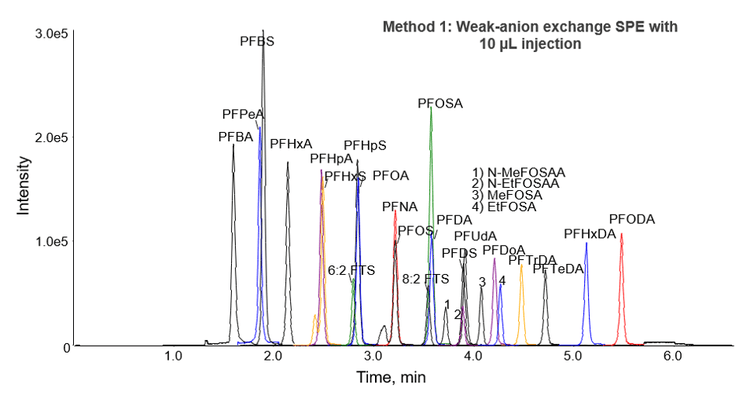
A 50 mm x 2 mm, 3 µm Gemini C18 column was selected for Method 1, which utilized a 10 µL injection volume. The chromatographic separation of 25 PFASs is shown in Figure 2. The average peak asymmetry factor for the first 2 eluting peaks (PFBA and PFBS) in the initial calibration standards was calculated to be 1.3 in Method 1 using MultiQuant Software 3.0.2. This is within the acceptance criteria set by EPA 537 of 0.8-1.5 7.
Partial resolution of the branched and linear isotopes is necessary for PFAS analysis to distinguish between samples containing only linear isotopes or isotope mixtures. As shown in Figure 2, the earlier eluting branched isotopes are clearly distinguishable from the major peak corresponding to the linear isotopes for the 2 compounds that contained both branched and linear isotopes in the standards (PFHxS and PFOS). Most methods recommend that these two peaks are summed for quantitation, which was performed in this method using MultiQuant Software 3.0.2.
Method 1 calibration
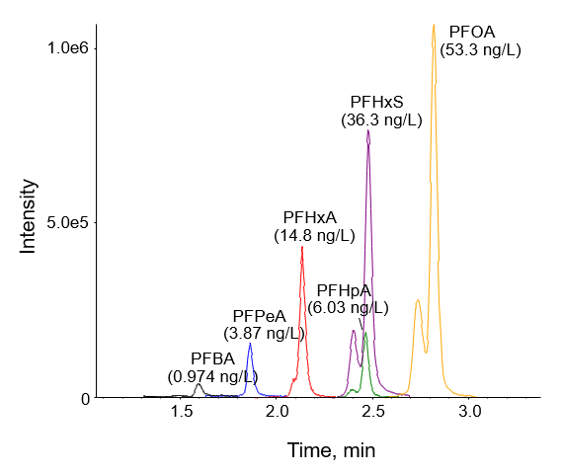
The initial 7-point calibration for Method 1 exhibited good accuracy within +/- 30% of the expected values for all points, accuracy within +/- 10% for the lowest calibrator, and R2 coefficients of >0.990, as shown in Table 5. Based on the S/N ratio of the low calibrator and the linearity of the curve, the calibration range could be extended on both the high and low levels to improve the dynamic range. A water sample analyzed using Method 1 exhibited concentrations of several PFASs ranging from 0.974 to 53.3 ng/L, as shown in Figure 3.
Method 2 chromatography
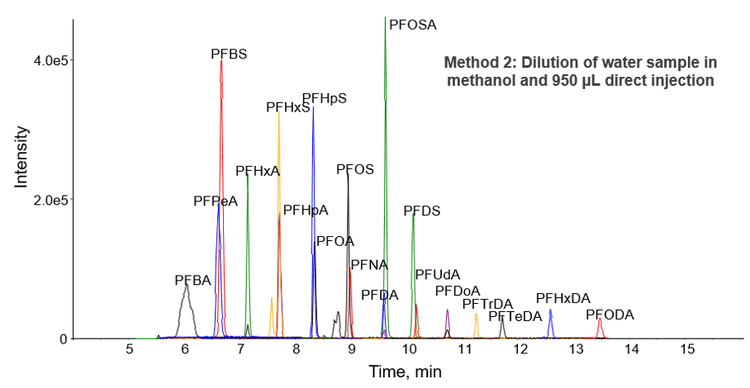
Method 2 is a large-volume, direct aqueous injection method designed for drinking, surface, and ground water samples. After the addition of surrogate standards and a simple dilution with methanol, 950 µL of the sample was injected directly onto the Gemini C18 column. In contrast to Method 1, a longer and larger diameter column was used to improve retention of the analytes in the large volume injection. This resulted in a longer total runtime (17.5 minutes compared with 7.5 minutes), but provided robust results for the large volume injection and minimal retention time shift (Figure 4). The only compound that exhibited deteriorated peak shape due to the large injection volume was PFBA. However, the broadened peak shape of PFBA did not affect quantitation accuracy or precision.
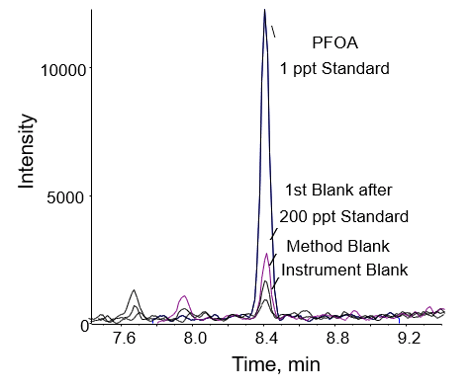
Similar to Method 1, blank contamination from the instrument was minimized by using a delay column in Method 2. Blank contamination from sample preparation was also minimized in Method 2 by reducing the number of pipetting steps and testing all new batches of solvents prior to use. The integrated areas of the first blank after the highest concentration sample (200 ng/L) were less than 50% of the lowest calibrator. For example, the area of the first blank analyzed after the 200 ng/L calibration standard was 22% of the area of the 1 ng/L standard for PFOA as shown in Figure 5. The other blanks shown in Figure 5 exhibited even lower response for PFOA, which could be contributed to laboratory contamination for the method blank and solvent contamination for the instrument blank.
To be compatible with common sampling practices, the Method 2 was not optimized for recovery of the longest chain PFASs, PFHxDA and PFODA, from the sample container or from the autosampler vial. Due to the stronger hydrophobicity of these compounds compared with the shorter chain PFAS, PFHxDA and PFODA appeared to bind to polypropylene containers when the methanol concentration was <40%. Modifications to this method to improve the recovery and precision of PFHxDA and PFODA analysis may include collecting smaller samples (10-20 mL), diluting the entire sample with methanol in the sampling container, and adding surrogate standard directly to the sampling container.
Direct analysis of water samples is impaired by the presence of 5 g/L Trizma in samples, which is added to drinking water samples as a requirement by EPA method 537. Trizma suppresses ionization of the PFASs and elutes slowly from the column for minutes after the injection. Therefore, Trizma should not be added to samples that will be analyzed using direct aqueous injection, but is fully compatible with SPE as performed in Method 1.
Method 2 performance
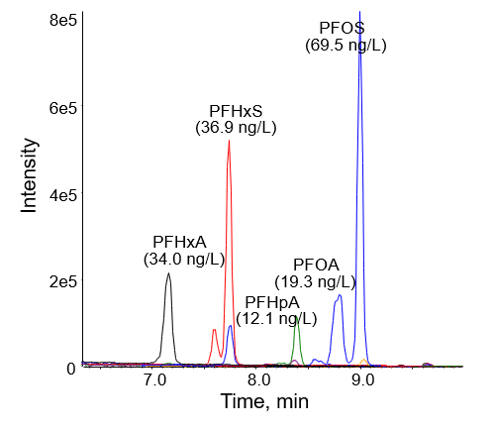
Because large-volume injection methods are less common for PFASs compared with offline extraction methods, this application note reports the recovery and precision of continuing calibration standards over 1 week of continuous water sample analysis to demonstrate the robustness and accuracy of Method 2. The chromatogram and quantitated values for several PFASs in one of these water samples are shown Figure 6.
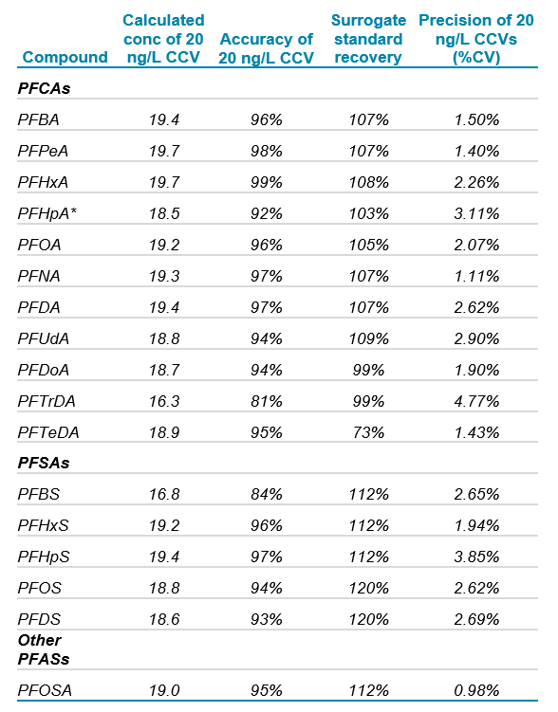
As shown in Table 6, a continuing calibration standard at 20 ng/L analyzed 1 week after the initial calibration exhibited quantitative accuracy of 92-99% for all compounds with the exception of PFTrDA (81%) and PFBS (84%). Due to limited availability of surrogate standards, PFBS was analyzed using 18O2 PFHxS as an internal standard, and PFTrDA was analyzed using 13C2 PFDoA. The absence of an exact isotope-labelled surrogate for these two compounds likely contributed to the decreased accuracy of the ongoing calibration standard.
During the 1 week period of full-time water sample analysis, 9 replicates of the 20 ng/L continuing calibration verification (CCV) were analyzed as shown in Table 6. The precision (%CV) for all of the PFASs was <5%, which indicates excellent precision for the large volume injections. The surrogate recovery, calculated as the response of the surrogate standard in the 20 ng/L ongoing calibration standard divided by the response of the surrogate standard during the initial calibration, was within 73-120% for all of the PFASs analyzed.
Summary
The 2 methods reported here were designed for optimum robustness using the SCIEX Triple Quad 5500 System as the analytical platform. Both methods may be expanded to include soil, sediment, and biological extracts. Minimum and maximum reporting limits of approximately 1 ng/L to 400 µg/L could be achieved using both methods. These ranges could be expanded by increasing the extracted volume in Method 1 or by further dilutions in Method 2. The example chromatograms shown in this application note also demonstrate that the lower calibration levels than the levels analyzed here could be included in initial calibration curves to further improve the sensitivity of the method.
Method 1 has the advantage of compatibility with EPA Method 537 and allows sample concentration using solid phase extraction. Method 2 has the advantages of minimal sample preparation and fewer steps to introduce lab-based PFAS contamination. With the growing need for PFAS analysis of environmental samples, these versatile methods will be useful for labs aiming to evaluate growing lists of PFASs.
Acknowledgements
SCIEX acknowledges TestAmerica (Sacramento, CA) for collaborating with SCIEX by providing and conducting the analysis of standards for this application note. SCIEX also acknowledges Phenomenex (Torrence, CA) for providing HPLC columns and expertise for this application note and other method development efforts.
References
- Buck et al., (2011) Perfluoroalkyl and polyfluoroalkyl substances in the environment: Terminology, classification, and origins. Integr Environ Assess Manag. 7(4), 513-541.
- Rahman, MF.; Peldszus, S.; Anderson, W. B. (2014) Behaviour and fate of perfluoroalkyl and polyfluoroalkyl substances (PFASs) in drinking water treatment: A review. Water Research, 50, 318-340.
- Braun, JM et al (2016) Prenatal perfluoroalkyl substance exposure and child adiposity at 8 years of age: The HOME study. Obesity, 24, 231−237.
- Barry, V.; Winquist, A.; Steenland, K. (2013) Perfluorooctanoic acid (PFOA) exposures and incident cancers among adults living near a chemical plant. Environ. Health Perspect., 121 (11−12), 1313− 1318.
- Hu, XC. et al. (2016) Detection of Poly- and Perfluoroalkyl Substances (PFASs) in U.S. Drinking Water Linked to Industrial Sites, Military Fire Training Areas, and Wastewater Treatment Plants. Environ. Sci. Technol. Lett. (2016).
- ISO. 2009. Water quality – Determination of perfluorooctanesulfonate (PFOS) and perfluorooctanoate (PFOA) – Method for unfiltered samples using solid phase extraction and liquid chromatography/mass spectrometry. International Organization for Standardization, ISO 25101:2009 (TC 47/ SC 2). pp 19.
- EPA Method 537 ‘Determination of Selected Perfluorinated Alkyl Acids in Drinking Water by Solid Phase Extraction and Liquid Chromatography / Tandem Mass Spectrometry LC/MS/MS) version 1.1 (2009).
- Download MRM Method information.