Abstract
In this technical note, a multi-residue panel of contaminants was analyzed in pre-concentrated harbor waters. This analysis achieved limits of quantitation (LOQ) as low as 1 ng/L using the SCIEX 7500 system. Coastal water samples were selected from sites that have been impacted by wastewater treatment plants (WWTPs) over a number of years. Calibration curves ranged from 1–400 ng/L, depending on the compound analyzed. The targeted method consisted of 132 compounds, which included pharmaceuticals, pesticides and recreational drugs. An additional 341 analytes were also screened in a separate acquisition method, enabling a wider sweep of chemical contaminants. The analysis of trace chemical residues is an important factor in monitoring and assessing the extent of chemical contamination, particularly when due to human activities. Figure 1 shows the extracted ion chromatograms (XICs) for 3 analyzed compounds in harbor water at 1 ng/L (pre-concentrated).
Key benefits of the quantitation of multi-class chemical pollutants in coastal waters using the SCIEX 7500 system
- Targeted quantitation: 132 compounds were analyzed in 51 harbor water samples to assess the contaminant profile
- Parts-per-trillion level sensitivity: LOQ values as low as 1 ng/L, with calibration curves ranging from 1–400 ng/L in pre-concentrated samples (10 mL sample volume, 33.3x concentration) were observed
- Emerging compound screening: An additional 341 unique compounds were analyzed without authentic analytical standards to screen for other possible contaminants in the harbor water samples, allowing a further 50 compounds to be tentatively identified
Introduction
Anthropogenic activities contribute significantly to chemical pollution and wastewater is a substantial source of chemical mixtures that are released into the environment.1 This is primarily due to insufficient contaminant degradation within WWTPs and the discharge of untreated sewage.2-4 Recently, public interest has increased and concerns have been raised regarding the impact of chemical exposure to the environment.5 Large-scale routine monitoring in the environment poses many logistical issues that can be aided by citizen science that supports the design and implementation of monitoring campaigns.
Environmental contaminant analysis is challenging due to the sensitivity required to detect trace levels of chemicals and further complications by the complexity of sample matrices. Extensive sample pre-treatment and sensitive instrumentation are key to overcoming these challenges to enable reliable quantitation at low-ng/L levels.
Methods
Standards: All non-labeled chemical standards were purchased from Merck Life Sciences.
Sample collection: Samples were collected in triplicate from selected sites in Chichester and Langstone (UK) over consecutive days at low tide and throughout the year. Surface water samples were collected in 60 mL Nalgene bottles and stored at -20°C in the lab before sample pre-treatment and subsequent analysis.
Sample preparation: Water samples were filtered through a 0.2 µm hydrophilic PTFE syringe filter and subsequently spiked with isotopically labeled internal standards (50 ng/L). A 10 mL aliquot of filtered sample was loaded onto a pre-conditioned Oasis HLB solid-phase extraction (SPE) cartridge (6 mL, 200 mg). Cartridges were eluted with methanol and the solution was evaporated under nitrogen until dryness before being reconstituted in 300 µL of 95:5 (v/v), water/acetonitrile prior to injection.
Quantitation was performed for the targeted method with a 7- point matrix-matched calibration curve prepared from pooled surface water samples. The mix of analytes was spiked at a concentration of 0 (calibration blank), 1, 5, 10, 25, 100, 200 and 400 ng/L prior to SPE. Following the same procedure as the samples, the spiked samples were concentrated to a final volume of 300 µL (concentration factor: 33.33:1).
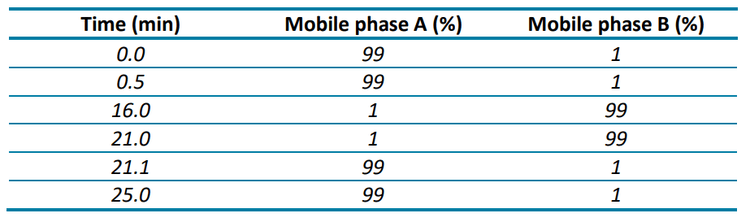
Chromatography: An ExionLC system equipped with a Phenomenex Luna™ Omega Polar C18 (100 x 2.1 mm, 3 µm, 100 Å) column was used for analyte separation. Analytes were separated using the gradient conditions described in Table 1. The injection volume was 20 µL. Mobile phase A was water with 0.1% formic acid and 5mM ammonium formate and mobile phase B was methanol with 0.1% formic acid and 5mM ammonium formate. The flow rate was 0.5 mL/min and the column oven temperature was 40°C.
Quantitative performance of matrix-matched calibration standards
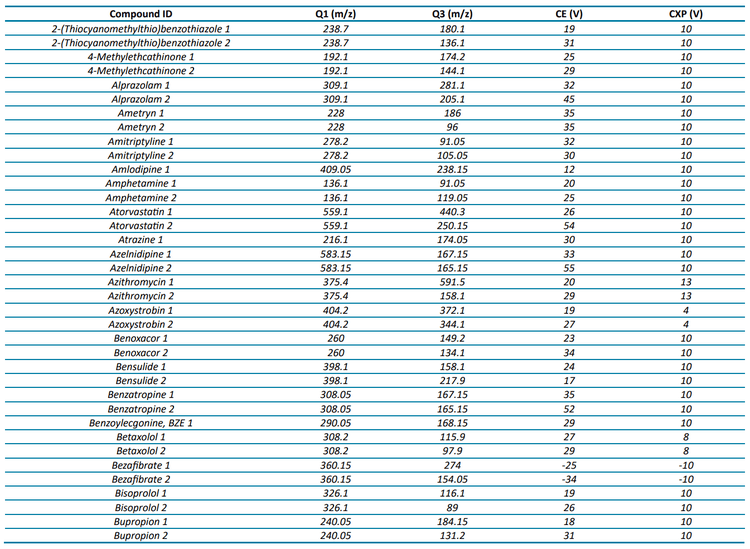
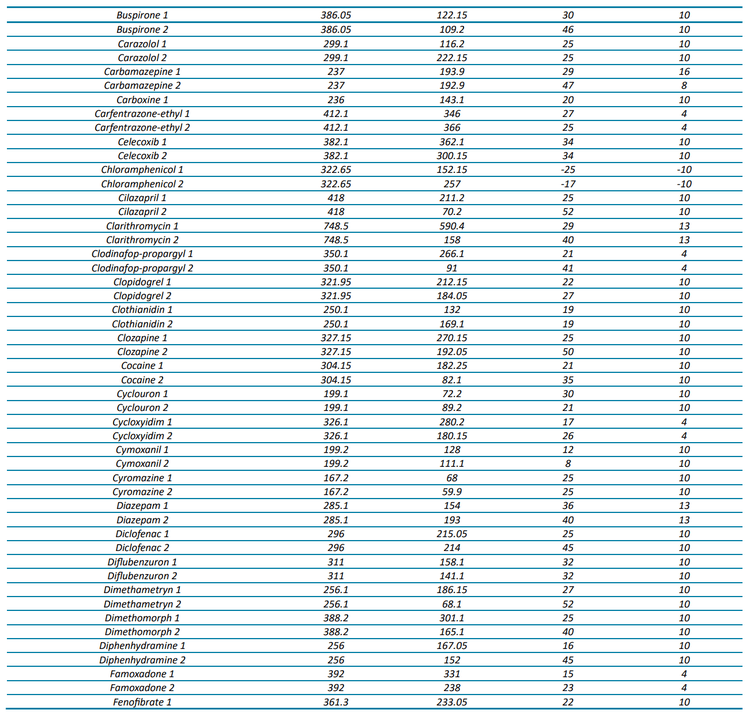
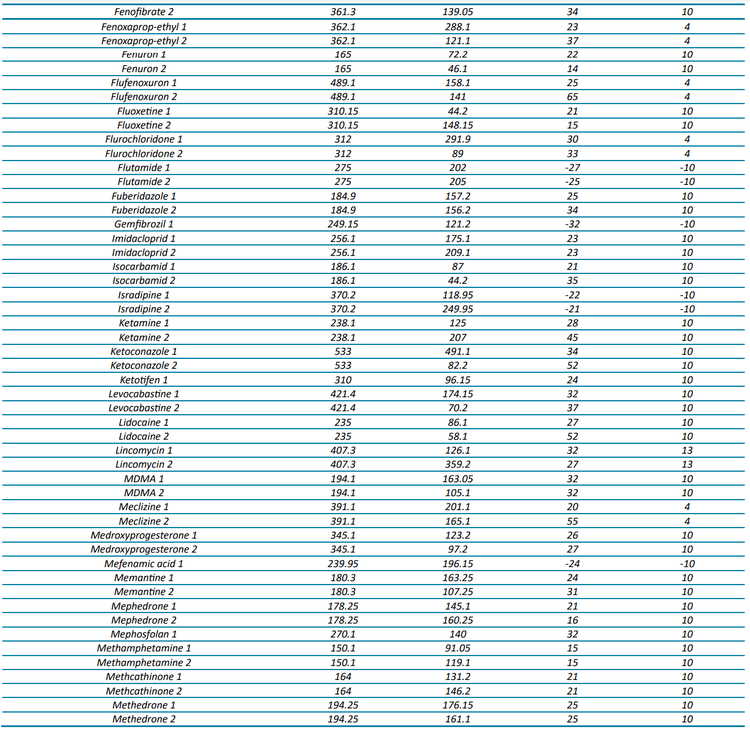
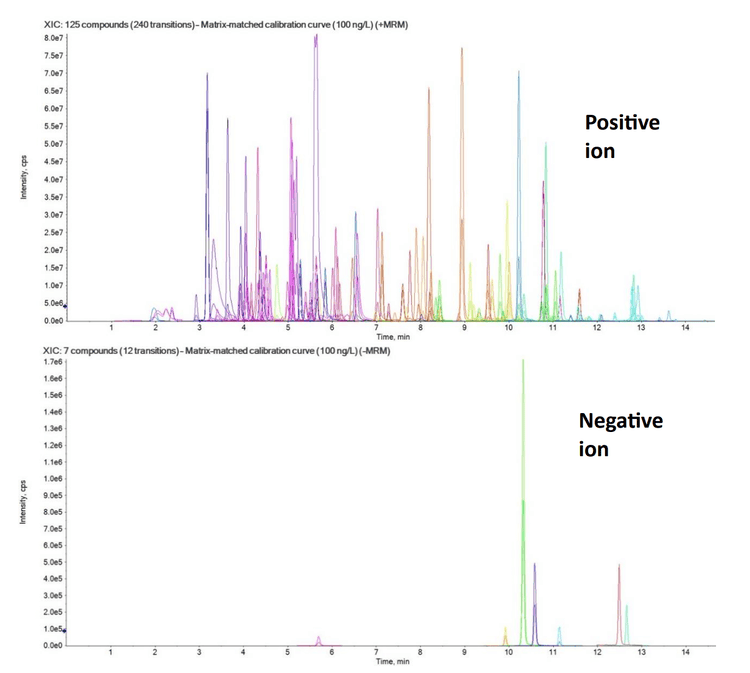
The targeted acquisition method included 132 compounds (252 transitions), with 125 compounds analyzed in positive mode and 7 in negative mode using polarity switching and scheduled MRM acquisition. Figure 2 shows the XICs for all transitions in the 100 ng/L matrix-matched calibration curve.
At a concentration of 1 ng/L in the matrix-matched calibration curve, 70% of the analytes (93 out of 132) were detected with a signal-to-noise (S/N) ratio ≥3, while 49% (65 analytes) demonstrated a S/N ratio ≥10. Analytical performance was greater at the 5 ng/L level, with 91% (120 compounds) demonstrating a S/N ratio ≥3 and 75% (99 compounds) exceeding a S/N ratio of ≥10. For a majority of compounds, these standard levels were used to determine the limit of detection (LOD) and LOQ with background subtraction to account for background contamination. These analyses revealed that 67% of the analytes (89 out of 132) exhibited LODs <1 ng/L and 85% (112 analytes) had LOQs <10 ng/L. All remaining analytes were detectable at concentrations <100 ng/L with LOQs ranging up to 220 ng/L. The results shown here highlight the quantitative performance that can be achieved, as most of the analytes included in the diverse panel of environmental contaminants in harbor water samples were detected at 1 ng/L.
For 65 compounds, the full linear range (1–400 ng/L) was tested, whereas the 1 ng/L concentration was excluded for 51 other compounds to span 5–400 ng/L. The linear range tested for the remaining compounds ranged from 10 or 25 to 400 ng/L. Five compounds could not be quantified due to high LOQs, leading to a limited number of available calibration points. These analyses revealed that 116 compounds had R2 linear fit values ranging from 0.9809 to 0.9999 and 11 compounds were better represented by a quadratic fit with R2 ranging from 0.9963 to 1.
Method robustness
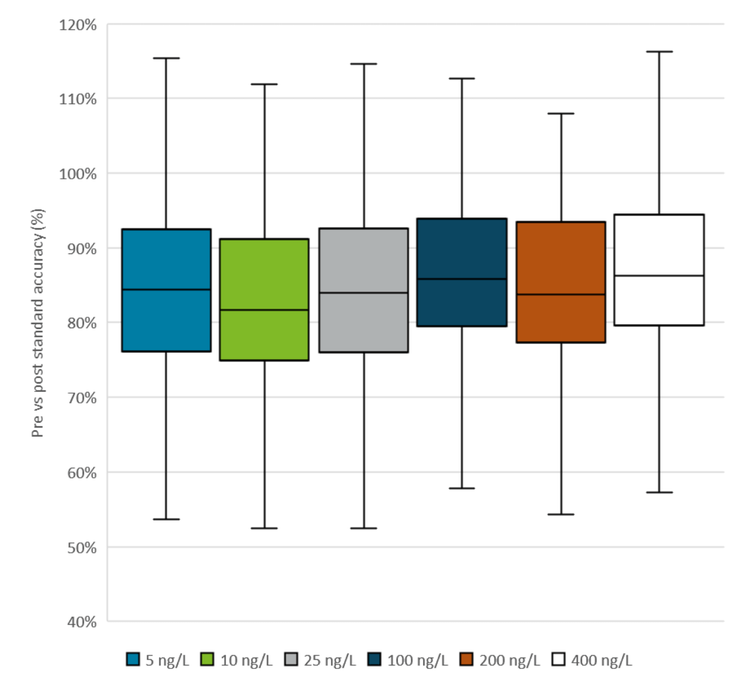
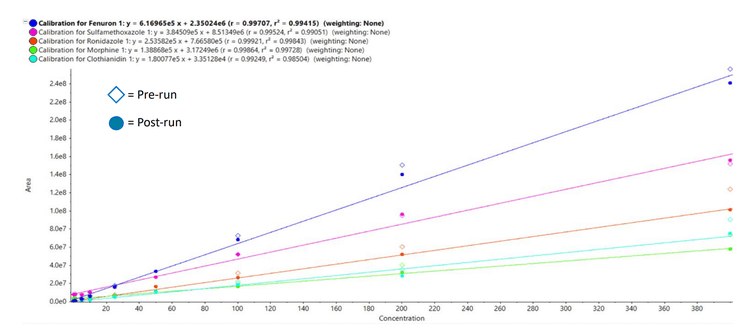
Robustness and instrumental performance were assessed by comparing the responses of the matrix-matched calibration standards before and after an analysis batch of 51 coastal water samples. The calibration curve injections conducted before and after the sample runs predominantly yielded % accuracy values between 80–100%, with median values in the range of 80–90% for all calibration points and all compounds analyzed (Figures 3 and 4). The pre- to post-batch ratios near 100% indicate no loss in sensitivity during the batch.
Targeted quantitation in real-world coastal water samples
The targeted acquisition method was applied to 51 coastal water samples collected in November 2022. Peaks above the analyte LOQs were quantified using a matrix-matched calibration curve. Compound LODs and LOQs were determined by the lowest concentration, which produced S/N ratios of 3 and 10, respectively.
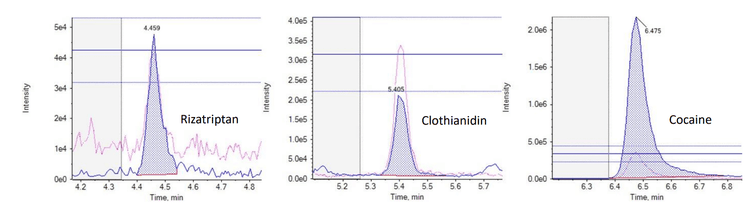
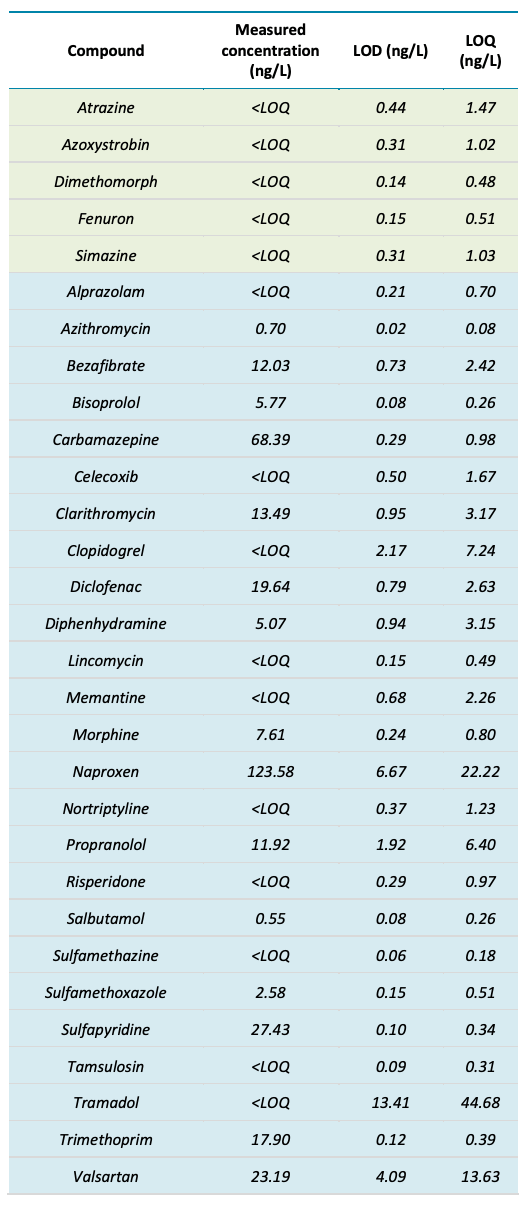
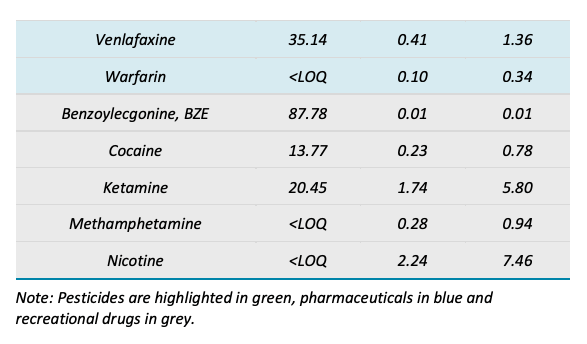
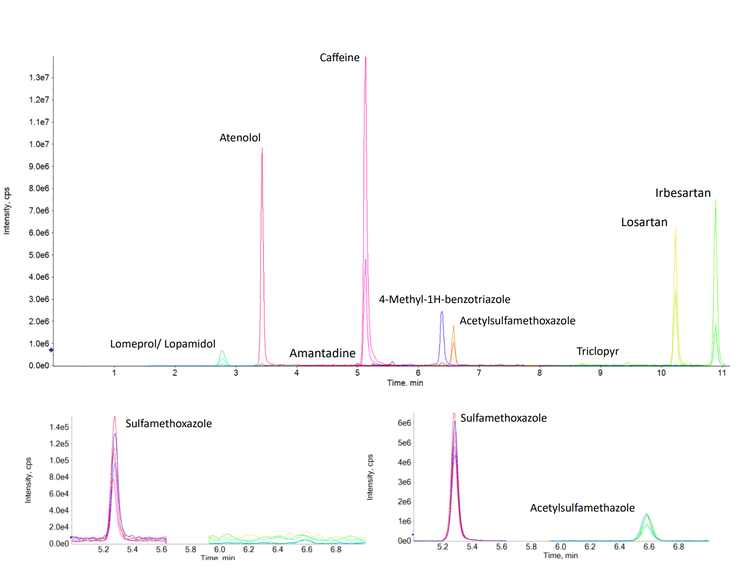
For example, the Budds Farm sample collected on November 11, 2022 showed detections for 37 of the 132 targeted compounds with concentrations ranging from <LOQ to 123.6 ng/L (naproxen). The detected compounds included 5 pesticides, 27 pharmaceuticals and 5 illicit drugs. Table 3 shows the measured concentration and the LOD and LOQ concentrations for each compound observed in the sample. Figure 5 shows the XICs of 3 compounds detected in the sample from each category (pesticides, pharmaceuticals and illicit drugs).
Screening analysis
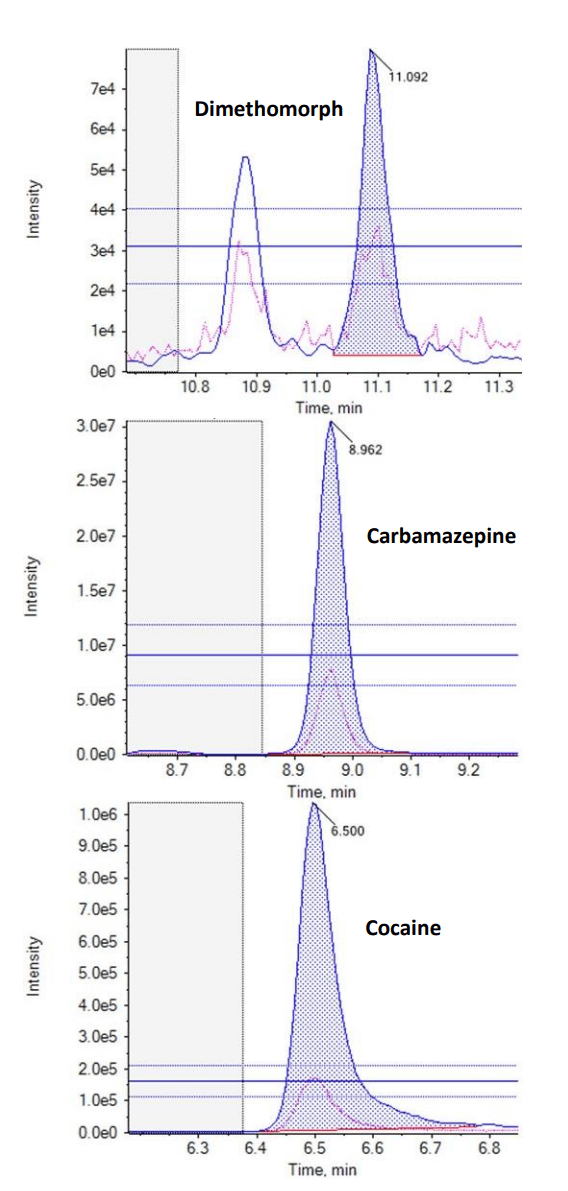
In addition to targeted acquisition, the samples were screened using an MRM list containing 341 unique analytes. This MRM list covered industrial chemicals, pharmaceuticals, personal care products and pesticides that were not included in the targeted method. This MRM list was used to determine any additional compounds present in the sample that did not match the available analytical standards. A total of 50 compounds from the extended list were detected in the 51 samples analyzed. Most of the compounds identified were pesticides and pharmaceuticals, including known biotransformation products such as carbamazepine-10,11-epoxide and acetyl sulfamethoxazole. Figure 6 summarizes the compound classes of the 50 additional compounds identified when using the extended list. Figure 7 shows representative XICs of some of the compounds observed.
Conclusion
- A targeted method of 132 compounds was utilized to quantify contaminants in harbor water samples using matrix-matched calibration curves
- The compounds analyzed covered a diverse mixture of contaminants, including pharmaceuticals, pesticides and recreational drugs
- LOQs as low as 1 ng/L were achieved using 10 mL of sample, with calibration ranges spanning between 1 and 400 ng/L
- An extended list of 341 compounds was used to screen the samples analyzed to assess emerging contaminants within the samples, leading to an additional 50 compounds being identified
References
- Aus der Beek, T., Weber, F.-A., Bergmann, A., Hickmann, S., Ebert, I., Hein, A. and Küster, A. (2016), Pharmaceuticals in the environment—Global occurrences and perspectives. Environ Toxicol Chem, 35: 823-835.
- Luo Y, Guo W, Ngo HH, Nghiem LD, Hai FI, Zhang J, Liang S, Wang XC. A review on the occurrence of micropollutants in the aquatic environment and their fate and removal during wastewater treatment. Sci Total Environ. 2014 Mar 1;473- 474:619-41.
- Verlicchi P, Al Aukidy M, Zambello E. Occurrence of pharmaceutical compounds in urban wastewater: removal, mass load and environmental risk after a secondary treatment--a review. Sci Total Environ. 2012 Jul 1; 429:123- 55.
- Weyrauch P, Matzinger A, Pawlowsky-Reusing E, et al. Contribution of combined sewer overflows to trace contaminant loads in urban streams. Water Research. 2010 Aug;44(15):4451-4462.
- BBC news article – Drugs, pesticides and medicine found in south coast seawater – 09th June 2023