Forensic authentication of hemp-derived products using a dual mass spectrometry-UV detection approach
Using Scheduled MRM™ Algorithm on the SCIEX QTRAP® 6500+ LC-MS/MS System
Simon C. Roberts1, Paul Winkler1, Scott Krepich2, Ty Garber3, KC Hyland1, Christopher Borton1, and Pierre Negri1
1SCIEX, Redwood City, CA, USA, 2Phenomenex, Inc., Torrance, CA, USA, 3Phenova, Inc., Golden, CO, USA
Abstract
A recent federal legislation change has legalized CBD derived from hemp with a delta-9-tetrahydrocannabinol (THC) concentration of not more than 0.3% by dry weight. However many commercially-available products contain levels of THC above the federal legal limit. Crime labs need routine tests capable of accurately detecting and quantifying THC present in alleged hemp-derived products to ensure its concentration levels are below the federal legal limit. A comprehensive workflow for the detection and quantitation of 11 cannabinoids in hemp-derived products using HPLC-UV in tandem with a SCIEX QTRAP 6500+ System gas been developed that enables accurate THC quantitation in hemp-derived samples across the entire potency range.

Introduction
The popularity of CBD products has been on the rise following a recent change in federal legislation. This new bill, also known as the 2018 Farm Bill, provided a regulatory amendment to specifically legalize hemp, which is defined as a cannabis plant with a delta-9-tetrahydrocannabinol (THC) concentration of not more than 0.3% by dry weight.1 Even though CBD is stll a controlled substance, many products have become widely available to the general public.2 Many of these commercially-available products contain levels of THC above the federal legal limit. This issue is creating concern by state and local regulators that these products contain illegal levels of THC and this has led to the need for laboratories to have accurate, robust and legally defensible methods to measure the concentration of THC and other cannabinoids present in these samples to ensure compliance with the new federal regulation.
Since the promulgation of the 2018 Farm Bill, one of the challenges facing legal authorities is the lack of reliable tests capable of quantifying the amount of THC in alleged hemp-derived products. The near IR field instruments currently used to detect and quantify THC in these products suffer from poor accuracy. In addition, the variability of field sampling procedures often results data imprecision and inaccuracy. On the other hand, crime labs have been slow in adjusting to the new federal regulations and have not yet implemented routine tests capable of accurately measuring the THC levels in seized products. This is particularly problematic for law enforcement personnel needing to test seized products that are suspected of containing THC levels higher than those permitted by the new federal rules. As a result, there is an urgent need to develop new tests capable of accurately detecting and quantifying THC present in alleged hemp-derived products to ensure its concentration levels are below the federal legal limit.
In this technical note, a comprehensive workflow is presented for the detection and quantitation of 11 cannabinoids using HPLC-UV in tandem with a SCIEX QTRAP 6500+ system, enabling accurate THC quantitation in hemp-derived samples.
Figure 1: Confidently quantify and rapidly report THC levels in hemp-derived samples.
Key features of HPLC-UV in tandem with MS/MS method for potency analysis
- Simplified sample preparation procedure is fast and easily implemented to a forensic sample preparation workflow
- Combination of HPLC-UV and MS/MS detection provides an extended linear dynamic range for potency testing, enabling analysis of oil, distillate and wax without any carryover or need for further dilution
- Workflow covers 0.05-100% potency by weight, allowing accurate quantification of cannabinoids in a single injection
- Streamlined workflow allows monitoring of high- and low-abundant cannabinoids, providing an efficient workflow for accurate quantification of these species in hemp-derived products
- Custom flagging feature in SCIEX OS Software automatically determines whether the PDA or the MS is used for detection, ensuring generation of accurate quantitative results
- Efficient sample generation process in SCIEX OS Software enables creation of a report providing quantitative potency results of cannabinoids in hemp-derived samples
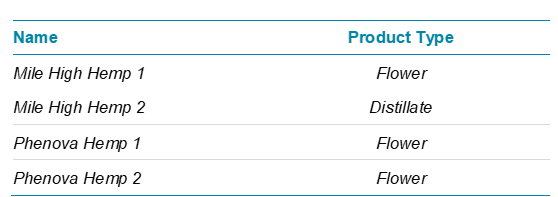
Table 1. List of hemp-derived samples tested in this study.
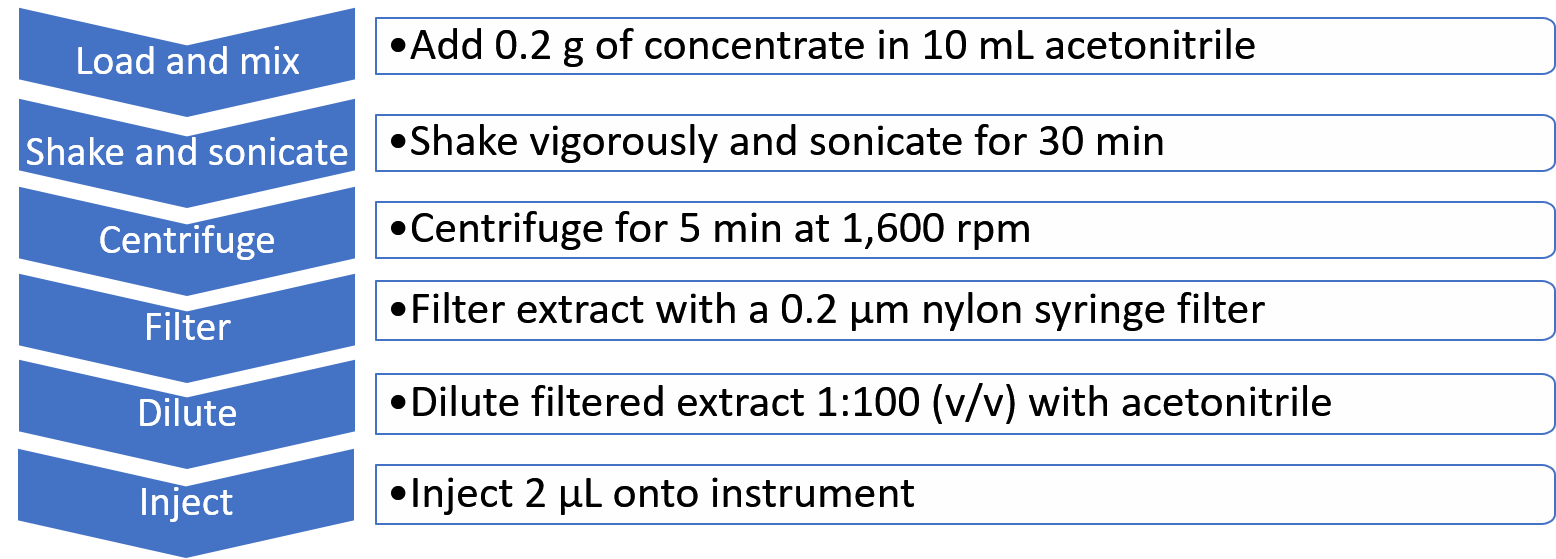
Sample preparation: Flower samples were homogenized prior to extraction. Distillate samples were processed without homogenization. 0.2 gram of each sample was mixed in 10 mL of acetonitrile. The resulting solution was shaken vigorously and sonicated for 30 minutes. Following sonication, the solution was centrifuged for 5 minutes at 1,600 rpm. The extract was filtered using a 0.2 µm nylon syringe filter. The filtered extract was then diluted 1:100 (v/v) with acetonitrile. A summary of the hemp-derived sample preparation procedure is shown in Figure 2.
Figure 2. Hemp-derived samples preparation. A 6-step sample preparation procedure was used for the samples analyzed in this study.
Liquid chromatography: UHPLC separation was performed on a Phenomenex Luna Omega Polar C18 column (150 x 4.6 mm, 3 µm, 00F-4114-E0) at 25ºC on an ExionLC™ AC System equipped with a PDA (photodiode array) detector set to measure absorbance from a wavelength range of 210-230 nm. Mobile phases used consisted of water, acetonitrile, and modifiers. The LC flow rate was 1 mL/min and the total run time was 12.5 min. The injection volume was 2 µL.
Mass spectrometry: Data was collected in both positive and negative polarity modes on the SCIEX QTRAP 6500+ System. The MRM algorithm was used in order to acquire an adequate amount of data points for quantifiable data.
Data analysis: Data processing was performed using SCIEX OS Software 1.5. To accurately determine the concentration of the top 5 commonly detected cannabinoids (THC, THCA, CBD, CBDA and CBN), a high calibration range curve was generated using the UV detector and a low calibration range curve was generated using MS/MS on the MS detector. Once the calibration curves were plotted, custom calculations were set up in SCIEX OS Software to automatically convert the calculated concentrations to percent by weight of the plant using the mass extracted, volume extracted and total dilution factor.
Developing a robust quantitation method by combining UV and MS/MS detection in a single dilution/injection scheme
Both UV- and MS-based detection techniques have been extensively used for cannabinoid analysis following LC separation. LC with UV detection in the 200-230 nm range makes use of the absorption properties of cannabinoids in the UV range and allows accurate quantification of the cannabinoid species present in a sample. MS/MS is a more specific detection technique that produces unique MS/MS fragments specific to each compound. LC separation with MS/MS detection is often required as several of the cannabinoids produce fragment ions that are not discernable by MS/MS analysis alone. In addition, the sensitivity of modern mass spectrometers enables limits of detection (LOD) in the fg/mL and pg/mL range, providing reliable quantification of low-abundance species in a sample.
Accurate quantification of both high- and low-abundance cannabinoids is challenging due to the wide range of cannabinoid concentrations in cannabis and hemp samples. The concentration of highly abundant species such as delta-9-THC and tetrahydrocannabinolic acid in cannabis or cannabidiol and cannabidiolic acid in hemp can exceed 90% while the concentration of low-abundant species in the same sample can fall below 0.5%. The disparity of these cannabinoid concentrations is not compatible with the linear dynamic range of any detector, often requiring multiple dilutions and injections to ensure that the calculated concentrations fall within the linear range of the instrument detector used.
To circumvent this challenge, a SCIEX ExionLC system with an integrated PDA detector was combined in line with a SCIEX QTRAP 6500+ system. The dual detection system provides a larger dynamic range and enables quantitation of 11 cannabinoids in hemp-derived samples ranging from 0.05-100% total weight in a single dilution/injection scheme. The MS/MS system allowed detection of low-abundance species at the low-end of the potency range, while the PDA detector provided accurate quantification of high-abundance species at the high-end of the potency range.
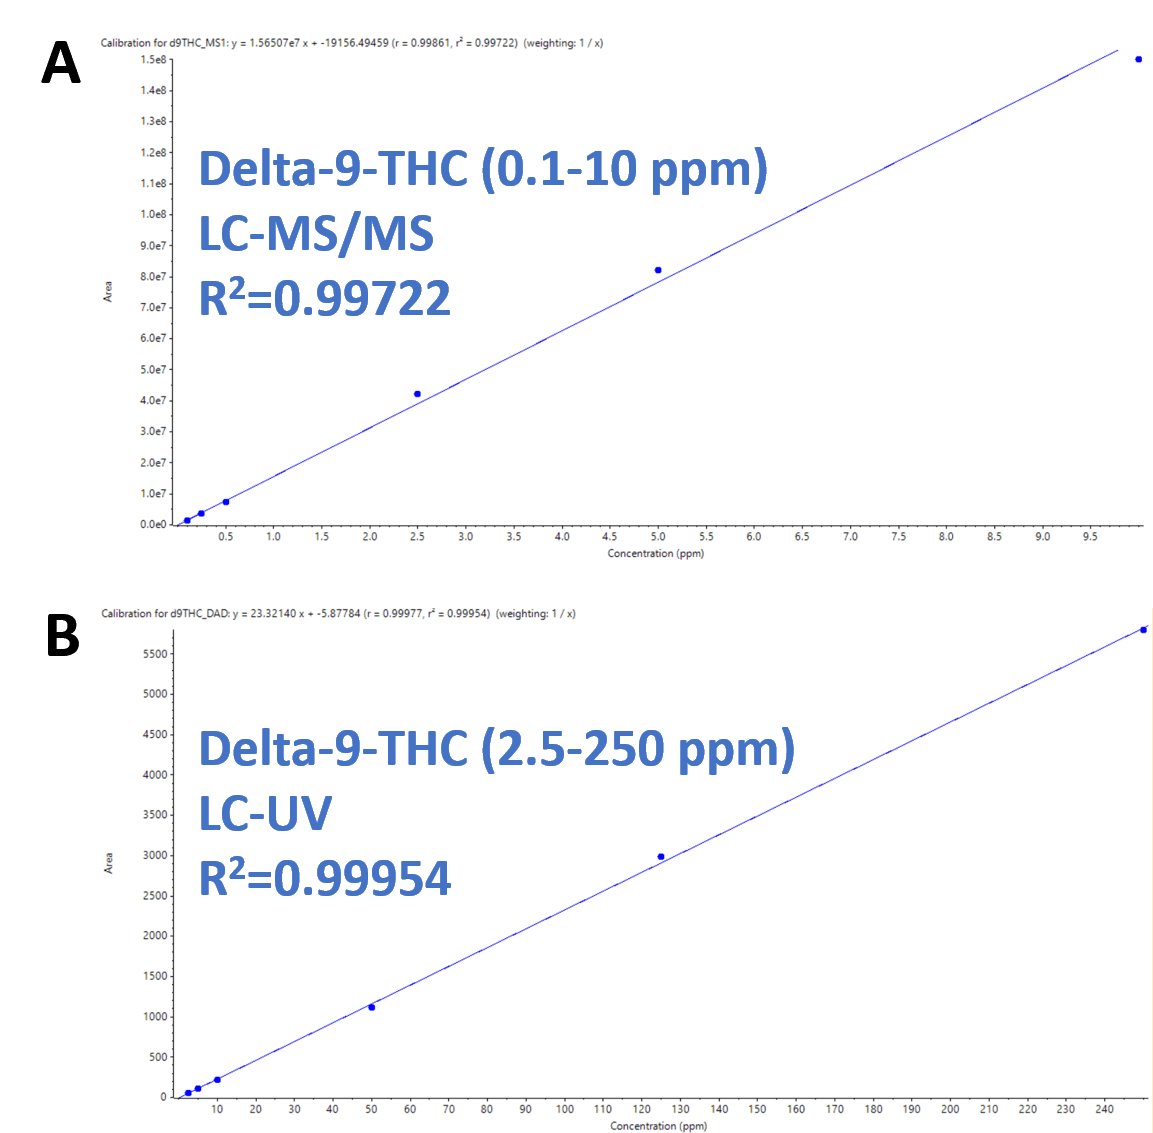
Figure 3 shows the overlapping calibration curves from the two detectors for delta-9-THC. The MS detector (Figure 3A) covered the low-end concentrations (0.1-10 ppm in vial – 0.05-5% in samples) and the UV detector (Figure 3B) covered the high-end concentrations (2.5-250 ppm in vial – 2.5-125% in samples). The use of the dual detection approach enabled coverage of concentrations ranging from 0.05 to 125% potency by weight in a single injection. The calibration curves demonstrated excellent linearity with R2 values of 0.99 for both detectors.
Figure 3. Excellent linearity and high dynamic range for delta-9-THC. A) Delta-9-THC calibration curve using the MS detector (0.1-10 ppm in vial; corresponds to 0.05-5% in samples) showing R2 of 0.99722. B) Delta-9-THC calibration curve using the UV detector (2.5-250 ppm in vial; corresponds to 2.5-125% in samples) showing R2 of 0.99954.
Combined LC-UV-MS/MS approach leads to accurate THC quantification
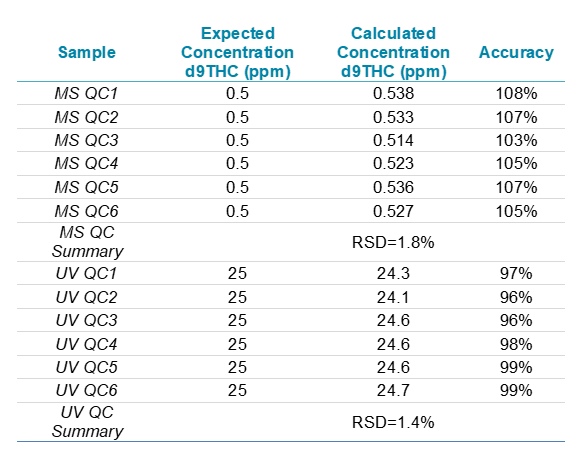
Investigating the robustness of a newly developed workflow is a critical part of the validation process that enables full implementation of the assay into routine laboratory analysis. The reproducibility of the method was investigated by calculating the continuing calibration verifications (CCVs) every 10 samples. Table 2 summarizes the reproducibility of CCV standards for the quantification of delta-9-THC by both the MS/MS- and UV-based detection methods. The results indicate good method reproducibility of delta-9-THC in a 0.5 ppm MS/MS CCV and a 25 ppm PDA CCV with RSDs of 1.8% and 1.4%, respectively. In addition, the calculated CCV values were within the desired 25% of the expected concentration throughout the course of the run, highlighting the high accuracy of the developed method.
Table 2. Reproducibility of CCV standards for delta-9-THC analyzed by MS and UV throughout the 60 sample batch.
The same workflow was used to analyze hemp-derived products and determine their total THC content. The sample preparation procedures and analysis conditions, including dilution factor, injection volume, and calibration standards, were kept identical to showcase the versatility of the current workflow and its ability to accurately analyze different types of samples. Detection was performed using both the LC-UV and the LC-MS/MS system. THC quantitation was reported using the LC-MS/MS detector as it provides reliable quantification of low-abundance cannabinoids in the samples.
Figure 4 shows the results for the accurate quantification of THC in hemp flower. Integration of the peak in the extracted ion chromatogram (XIC) for the quantifier and qualifier ions of both delta-9-THC (315 Da à 193.1 Da for the quantifier and 315 Da à 135 Da for the qualifier) and THCA (357 Da à 313.4 Da for the quantifier and 357 Da à 191.2 Da for the qualifier) was performed automatically in SCIEX OS software. Quantitation results were processed using SCIEX OS software, which automatically converted the results to a percentage using the extracted sample mass entered into the batch and the total dilution factor. Using the MS/MS detector, delta-9-THC and THCA concentrations in the hemp flower were found to be 0.07% and 0.10%, respectively. The total percentages by weight of CBD and THC were calculated by adding the acid and neutral forms of each (CBD+CBDA for total CBD and THC+THCA for total THC) after applying a 0.877x molar correction factor to the acids to take into account the extra molecular weight of the acids before decarboxylation. The total percentages of THC and CBD in the flower samples were 0.15% and 5.93%, respectively. The total THC concentration in this sample fell below the 0.3% by dry weight federal legal limit.
Figure 4: XICs and quantitative results for delta-9-THC and THCA in a hemp-derived sample. (Top) SCIEX OS software calculated the concentration of the detected cannabinoids and automatically converted the results to a percentage. (Bottom) XIC traces and peak integration for the quantifier and qualifier ions of both delta-9-THC (315 Da à 193.1 Da for the quantifier and 315 Da à 135 Da for the qualifier) and THCA (357 Da à 313.4 Da for the quantifier and 357 Da à 191.2 Da for the qualifier) used to quantify delta-9-THC and THCA concentrations in the sample. |
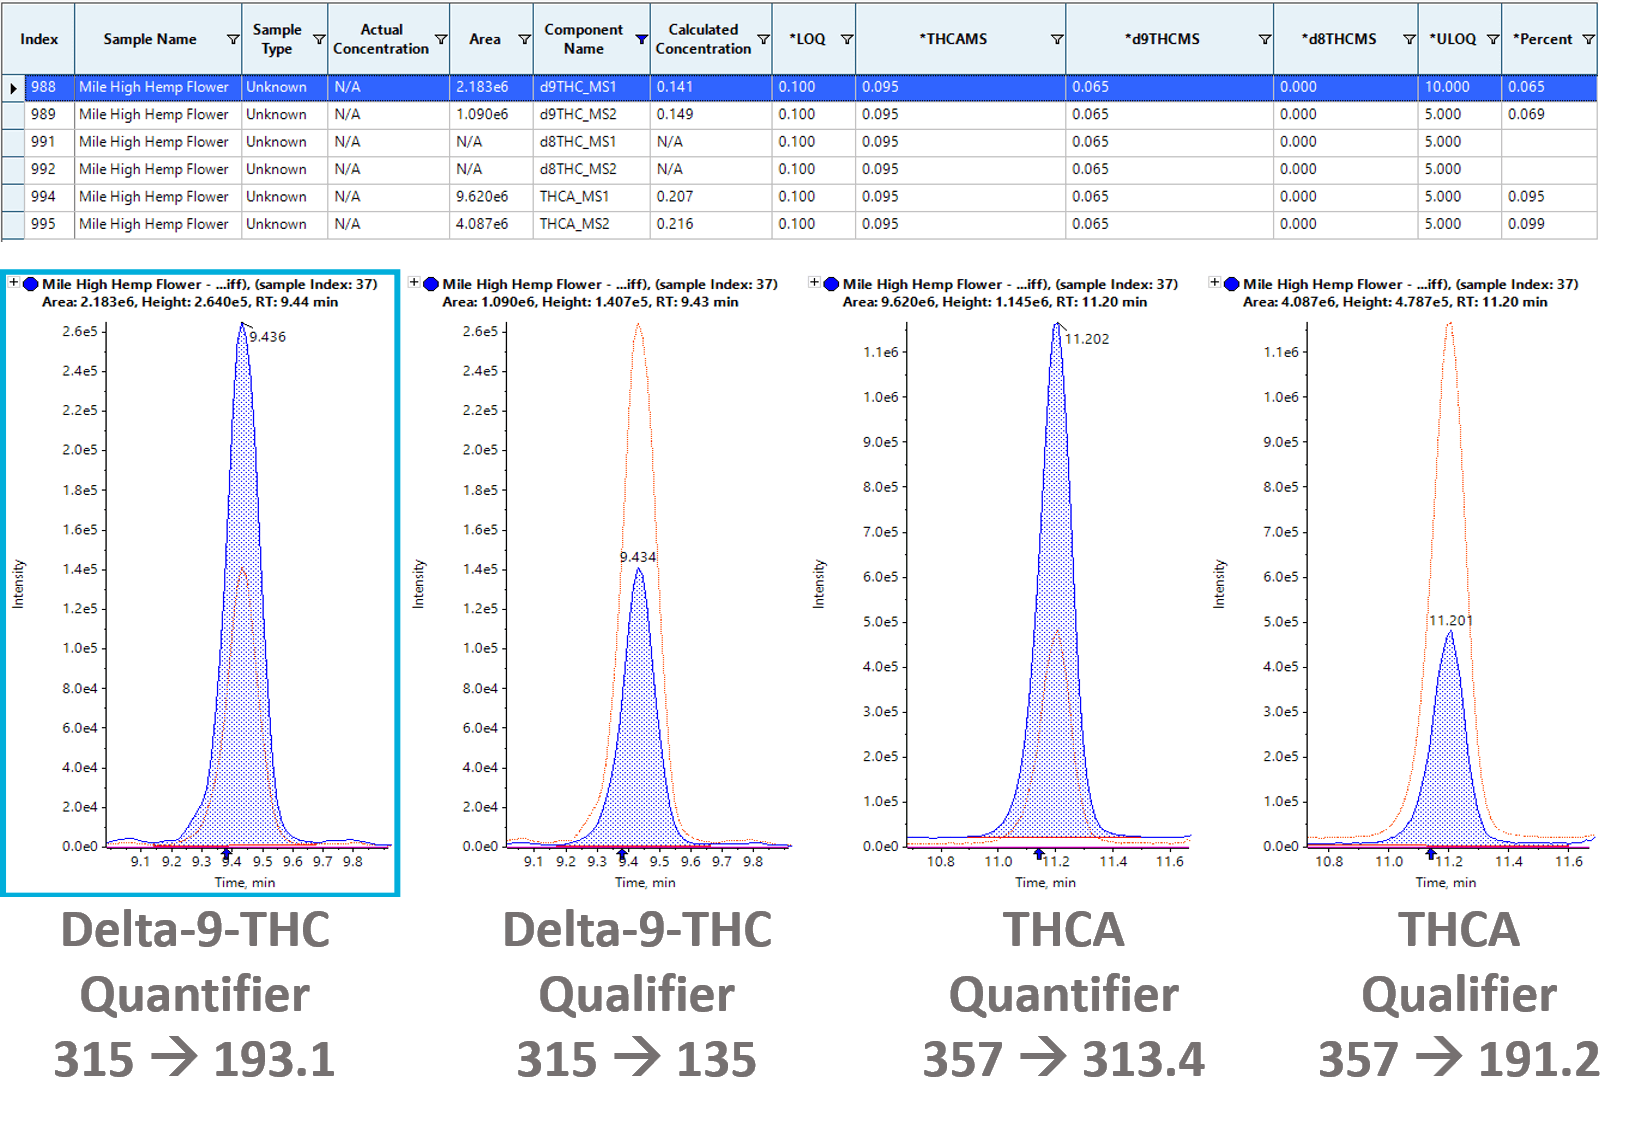
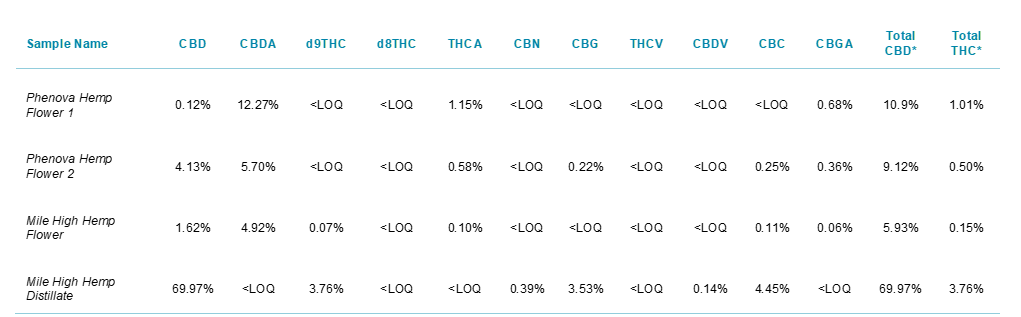
Table 3 shows the results of the four hemp-derived samples tested in this study. Using the dual detector approach, accurate quantification of 11 cannabinoids was accomplished in a single run. The quantitative results were calculated automatically in SCIEX OS which enabled fast and robust data processing with less manual intervention and streamlined reporting tools. The custom flagging features in SCIEX OS Software automatically determined whether the calculated results for the MS/MS or the UV detector are reported based on the values generated by each detector. Using this approach, accurate quantitation of total THC and total CBD by weight in each sample was accomplished. Out of the four samples analyzed, only one (Mile High Hemp Flower) contained THC levels below the 0.3% by dry weight federal legal limit. The advantage of this workflow lies in the ability to accurately quantify the different sample types (flower, distillate, concentrate, wax, etc) without having to change parameters such as dilution factor, injection volume, and calibration standards between the sample runs.
Table 3. Summary table of cannabinoid concentrations for the 4 hemp-derived samples analyzed in this study. *Total CBD and THC concentrations assume 100% decarboxylation of CBDA and THCA to CBD and THC, respectively, on a molar basis.
Custom reporting enables efficient sample quantification reporting
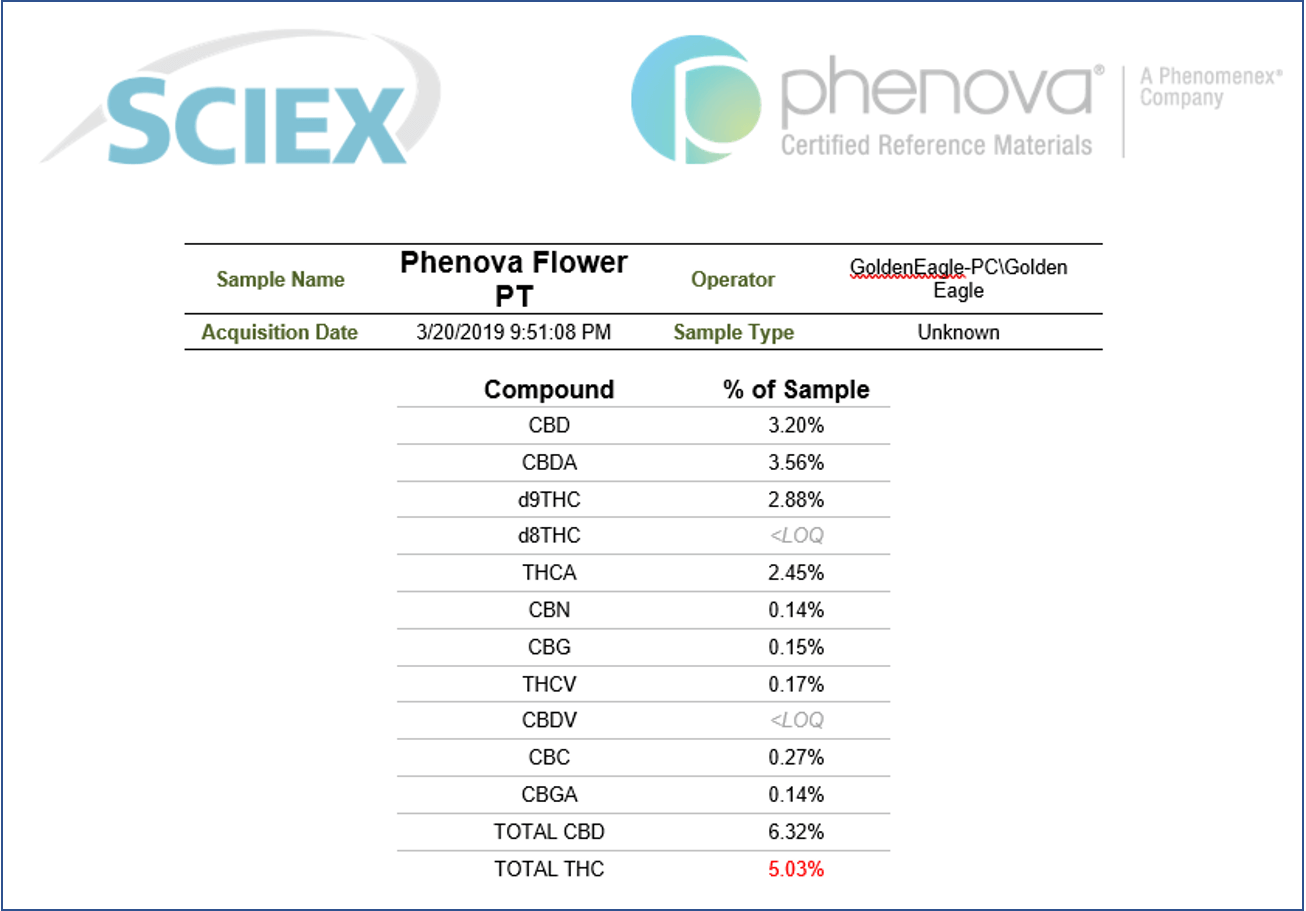
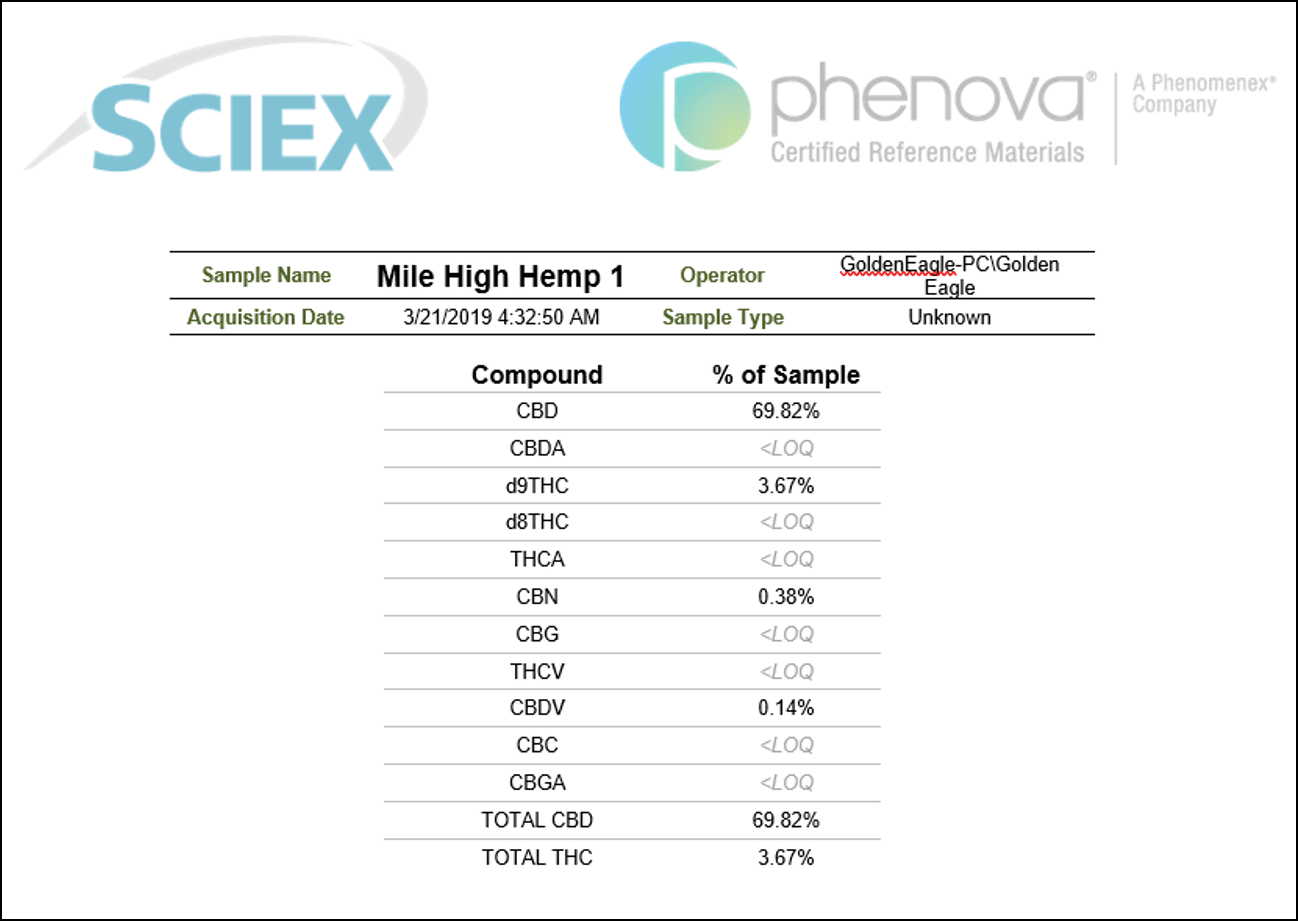
Another great advantage of the use of the SCIEX OS software is that it provides the ability to streamline the review of the results and efficiently summarize them in a sample report. The report can be easily customized to include detailed sample information as well as cannabinoids quantification in percentage by weight for each of the samples analyzed. Figure 5 shows a sample report template that was used to summarize the quantitative findings following the analysis of a hemp-derived sample (Mile High Hemp 1). The report includes a comprehensive summary of the sample analysis and lists the calculated concentrations of all of the cannabinoids present in the sample. Total CBD and THC concentrations were reported to be 69.82% and 3.67% by weight, respectively. Because the moisture content was not analyzed for these samples, the values represent the percentage of each cannabinoid in the entire sample and were therefore not directly comparable to reported label values. The combination of automated results generation and efficient sample reporting in this method streamlines the analysis of hemp-derived samples. Together these features are shown to dramatically reduce data analysis and enable fast sample reporting.
Figure 5. Efficient sample quantification reporting using SCIEX OS Software. Custom report template exported from results showing quantification of 11 cannabinoids in a hemp-derived sample (Mile High Hemp 1). The report also lists total CBD and total THC concentration percentages.
Conclusions
A comprehensive workflow for the detection and accurate quantification of THC in hemp-derived products was successfully developed. The combination of HPLC-UV in tandem with a SCIEX QTRAP 6500+ system is shown to provide a substantial advantage to enable accurate cannabinoid quantification across the entire potency range. The versatility of the described workflow allows accurate quantification of cannabinoids without the need for multiple sample injections and dilutions.
- A standardized sample preparation procedure enabled analysis of different types of hemp-derived samples without changing the mass of sample extracted or any other parameters
- Dual detector scheme provides extended linear dynamic range for potency testing, enabling accurate quantification of both the low- and high-abundant cannabinoid species
- MS/MS detector enabled accurate quantification of THC in a variety of hemp-derived samples in a single run
- Streamlined data processing and results generation in SCIEX OS is shown to provide fast and accurate total THC concentration in hemp-derived products, hence drastically increasing laboratory throughput
- Efficient data reporting process enabled generation of a comprehensive summary including calculated concentrations of all of the cannabinoids present in the sample
References
- 2018 Farm Bill, Section 12619.
- What You Need to Know (And What We’re Working to Find Out) About Products Containing Cannabis or Cannabis-derived Compounds, Including CBD, FDA 2020.
- Potency Analysis in Hemp and Cannabis Products using a Single-Dilution Combined LC-UV-MS/MS Approach. SCIEX Technical note RUO-MKT-02-9907-A.