Abstract
In this technical note, the ZenoTOF 7600 system, a hybrid time-of-flight mass spectrometer (TOFMS), was used to measure the endogenous concentrations of targeted lipid mediators in rat plasma. Generally, this type of analysis is performed using a triple quadrupole mass spectrometer (TQMS) with a multiple reaction monitoring (MRM) scan mode. This method is very sensitive and generates accurate and precise data. However, this technique is not typically amenable to simultaneous structural characterization via an MRM-directed data-dependent acquisition (DDA) scan without a significant loss in the duty cycle. High-resolution mass spectrometers (HRMS), like the ZenoTOF 7600 system, generate a full product ion spectrum during quantitative analysis that does not impact the assay's duty cycle, accuracy, or precision.
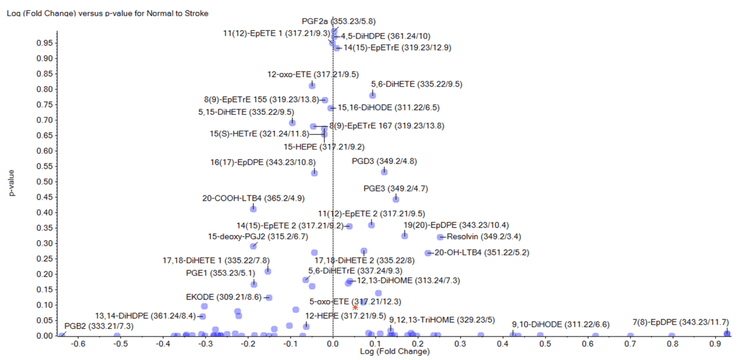
Here, the ZenoTOF 7600 system was used to measure the concentration of >90 endogenous lipid mediators in plasma obtained from healthy rats and rats that had experienced an ischemic stroke. The relative amounts of each lipid mediator were compared in the two groups using a single-point internal standard comparison. To verify the identity of each lipid mediator, the MS/MS spectra acquired during quantitative analysis were processed using the LibraryView application in SCIEX OS software to match lipid mediators to a spectral library. Finally, the data were processed using principal component analysis (PCA) with MarkerView software to determine changes in lipid mediator abundance between the two experimental groups (Figure 1).

Key features of lipid mediator analysis on the ZenoTOF 7600 system
- The ZenoTOF 7600 system can detect and quantitate endogenous lipid mediators in rat plasma
- The simultaneous acquisition of full product ion spectra during quantitative analysis enables structural verification of each lipid mediator by LibraryView software to enhance the assay specificity and accuracy
- The MarkerView application within SCIEX OS software facilitates statistical analysis of acquired data to highlight the biological impact of the results
Introduction
Lipid mediators are a potent class of fatty acid-derived bioactive lipids that mediate cell signalling events. They play an essential role in virtually all stages of the host immune response—from initiation to propagation and, ultimately, resolution (1). Consequently, there is considerable research interest in their biosynthesis and metabolism, and the enzymes responsible for their biosynthesis are attractive candidates for anti-inflammatory drug development.
The high potency of lipid mediators contributes to the challenge of their measurement: they are typically generated as a response to cell stimulation, they have short half-lives, and their concentrations are often in the sub-nanomolar range. Multiple methods have been developed to measure various lipid mediators, including immunoassays and mass spectrometry-based analysis (2-3). Immunoassays were initially very promising due to their sensitivity, but they have fallen out of favor due to issues related to specificity. TQMS is the preferred platform to measure lipid mediators (4). This instrument type has sufficient sensitivity to measure the low levels of many lipid mediators in vivo. A standard operating procedure (SOP) was previously developed to measure lipid mediators in vivo using SCIEX high-end TQMS instruments (5).
The low endogenous concentrations and the ephemeral nature of some lipid mediators have created a controversy in this field, with questions about quantitative reproducibility and structural identity being the main issues. TQMS systems are generally unable to simultaneously acquire a qualitative product ion spectrum during quantitative analysis because of the effects it would have on the instrument duty cycle. HRMS instruments typically generate a full product ion spectrum during quantitative analysis, which can be used for qualitative analysis. However, until recently, HRMS systems lacked the sensitivity to measure these lipids in vivo. The ZenoTOF 7600 system with Zeno pulsing has been shown to have comparable sensitivity to a high-end TQMS system for specific small molecule analytes (6). Additionally, the instrument is capable of simultaneous structural characterization of molecules using either collisioninduced dissociation (CID)- or electron-activated dissociation (EAD)- based fragmentation (7).
This study leveraged the ZenoTOF 7600 system's sensitivity and versatility to quantify lipid mediators in rat plasma. The full product ion spectra acquired during quantitative analysis were used to verify the lipids’ identities by matching them to a NIST library database with LibraryView software. The biological importance of these results was highlighted using MarkerView software to determine the changes in lipid mediator abundance due to ischemic stroke in rats.
Materials and methods
Materials: 12(S)-HETE-d8 (12S-hydroxy-5Z,8Z,10E,14Zeicosatetraenoic-5,6,8,9,11,12,14,15-d8 acid) was purchased from Cayman Chemical (Cat # 334570). A single internal standard was used to generate peak area ratios for each analyte that could be compared among the different sample groups. All solvents were LCMS grade and obtained from Burdick and Jackson. This solvent brand has less contaminating background chemical noise in the low mass range (100-500 Da) in the negative ion mode than other brands of solvents.
Sample preparation: Rat plasma serum samples were extracted using a solid phase extraction (SPE) column. Samples were loaded, washed, and eluted with methanol (MeOH) from the SPE column. Extracts were reconstituted in 100 µL MeOH and stored at -20 ˚C until analysis. Samples were prepared for analysis by HPLC MS/MS by reconstituting in 100 µl MeOH, and 10 µL was injected on column.
Chromatography: Rat plasma extracts were analyzed on a ZenoTOF 7600 system using an Exion UHPLC equipped with a Phenomenex Kinetex C18 column (150 x 2.1 mm; 2.6 µm particle size). The autosampler was maintained at 10 °C, and a 10 µL sample volume was injected on column. The column oven temperature was kept at 60 °C with a constant mobile phase flow rate of 0.4 mL/min for a total run time of 21 min. The mobile phase compositions were (A) 0.1% acetic acid in water and (B) 0.1% acetic acid in 84:16 ACN/MeOH. Chromatographic gradient details are shown in Table 1.
Results and discussion
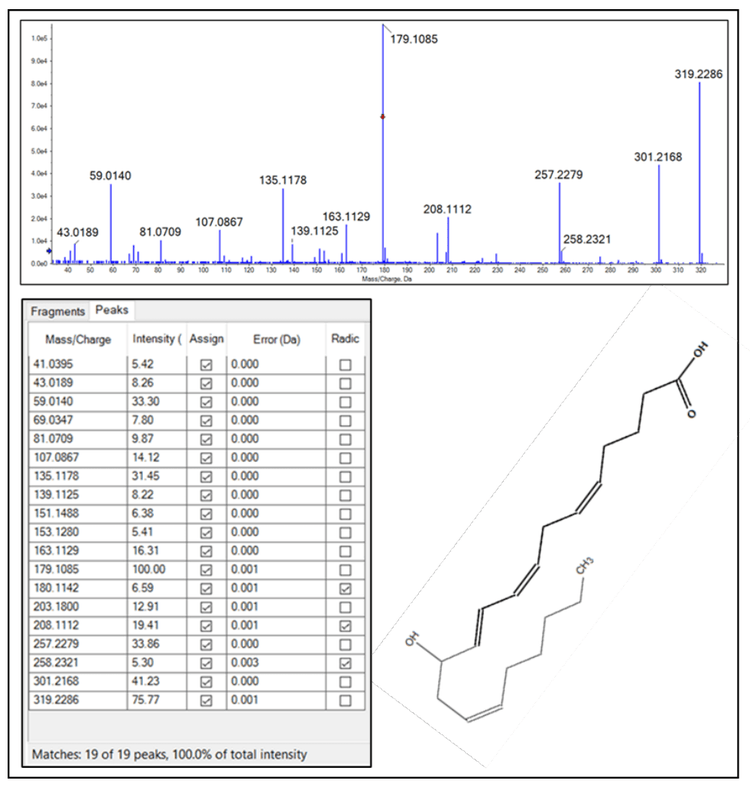
One of the benefits of analyzing lipid mediators by HRMS is the generation of a full product ion spectrum, particularly with sMRMHR analysis. This contrasts with TQMS analysis, wherein a qualitative product ion spectrum can only be acquired via a dedicated scan, which will increase the overall duty cycle of the experiment and may generate lower-quality data. Figure 2 (top panel) shows the CIDbased product ion spectrum acquired for 12-HETE during sMRMHR analysis. Within the Explorer module of SCIEX OS software, the fragment pane (bottom, left) can be linked to the acquired MS/MS data and assign peaks from an in silico-generated fragment. This, in turn, can be linked to a .mol file (bottom, right) where the fragments can be highlighted in bold on the structure. This capability enables analyte confirmation and provides multiple fragments from which the analyte can be quantitated.


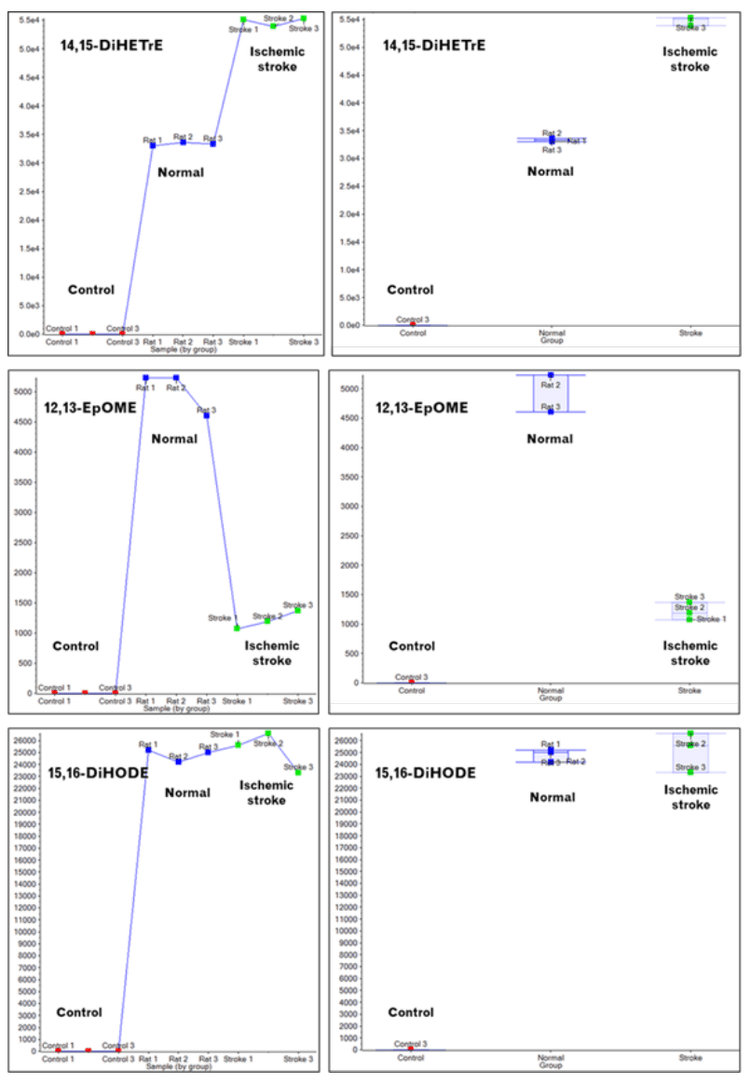
Extraction controls show no 12,13-EpOME, and its levels decrease upon ischemic stroke.
The relative concentration changes in lipid mediators among the different sample types can be assessed from the data using MarkerView software, a module within SCIEX OS software. Figure 4 shows three sets of panels (top, middle, and bottom) that highlight the changes in the concentrations of 14,15-DiHETrE, 12,13-EpOME, and 15,16-DiHODE resulting from ischemic stroke, respectively. 14,15-DiHETrE concentrations rise significantly, as shown by the triplicate data points in the top left panel and the averaged data in the box and whisker plots in the top right panel. Similar data is shown for the other two lipid mediators, except that the concentration of 12,13-EpOME decreases upon ischemic stroke, and the 15,16-DiHODE concentrations remain the same. The extraction control samples demonstrate there is interference associated with the sample preparation.
As noted in the introduction, the experimental measurement of lipid mediators is challenging due to their relatively low endogenous concentrations and the potential uncertainty in specificity associated with MRM-based analysis. In the absence of authentic primary reference standards by which to assign a chromatographic retention time, lipid mediators are typically identified, and the method is validated via product ion analysis of each lipid mediator to ensure the structure product ion spectrum is consistent with the analyte (Figure 2). During method development, this is a critical step to ensure the accuracy of the experimental assay. However, once an assay is developed, structural confirmation is often not a part of the routine experimental design on TQMS instruments due to its effects on the experimental duty cycle and the overall sample throughput.


MarkerView software was used to evaluate differences between the two sample sets (Figure 1). PCA analysis of the endogenous concentrations between healthy and ischemic rats shows significant differences in some lipid mediators due to ischemic stroke. The expense and difficulty in acquiring authentic standards for each lipid mediator prohibits absolute quantitation for each lipid mediator; however, using a single deuterated standard, as was done in these experiments, enables relative quantitation between multiple sample sets. These data are sufficient to identify lipid mediators that change in response to treatment and can direct targeted efforts with the appropriate primary reference and internal standards.
In summary, the ZenoTOF 7600 system can measure approximately 90 different lipid mediators in vivo with a sensitivity like that of a high-end TQMS system. Indeed, a recent study of bile acid analysis in human plasma was performed that directly compared the sensitivity of the ZenoTOF 7600 system to the QTRAP 7500 instrument (7); the data showed a similar level of sensitivity between the two platforms. An added benefit to high-resolution quantitative analysis is the ability to collect an accurate mass product ion spectrum that can be used for structural characterization and confirmation.
Conclusion
- The ZenoTOF 7600 system is sensitive enough to measure a large number of lipid mediators in rat plasma
- During quantitative analysis, an accurate mass product ion spectrum is obtained that can be used for structural characterization and confirmation
- The additional qualitative data improves the accuracy and the overall quality of this quantitative experiment
- Using the ZenoTOF 7600 on a small cohort study showed the utility of HRMS in the measurement of lipid mediators in vivo and established the methodology for larger-scale studies
References
-
- Leuti A, Fazio D, Fava M, Piccoli A, Oddi S, Maccarrone M. Bioactive lipids, inflammation and chronic diseases. Adv Drug Deliv Rev. 2020;159:133-169. doi: 10.1016/j.addr.2020.06.028. Epub 2020 Jul 3. PMID: 32628989
- Michael Puppolo, Deepti Varma, Susan A. Jansen, A review of analytical methods for eicosanoids in brain tissue, Journal of Chromatography B, Volume 964, 2014, Pages 50-64, ISSN 1570-0232, https://doi.org/10.1016/j.jchromb.2014.03.007
- Martin Giera, Jean M. Galano, Eicosanoids, Editor(s): Paul Worsfold, Colin Poole, Alan Townshend, Manuel Miró, Encyclopedia of Analytical Science (Third Edition), Academic Press, 2019, Pages 259-263, ISBN 9780081019849, https://doi.org/10.1016/B978-0-12- 409547-2.13984-8
- Harkewicz R, Dennis EA. Applications of mass spectrometry to lipids and membranes. Annu Rev Biochem. 2011;80:301- 25. doi: 10.1146/annurev-biochem-060409-092612. PMID: 21469951; PMCID: PMC3410560
- Norris, P, Gorti, SKK, and Pearson, M, Higher sensitivity analysis of a large panel of lipid mediators, SCIEX technical note RUO-MKT-02-12508-A, Higher sensitivity analysis of a large panel of lipid mediators (sciex.com)
- Paul RS Baker, Robert Proos, Maxim D Seferovic and Thomas D. Horvath, Quantitative analysis and structural characterization of bile acids using the ZenoTOF 7600MS system, SCIEX technical note MKT-30747-A, https://sciex.com/tech-notes/life-scienceresearch/metabolomics/quantitative-analysis-andstructural-characterization-of-bile-ac
- Pierre Negri, Alex Krotulski, Enhancing high-resolution mass spectrometry performance for NPS analysis with improved sensitivity and characterization, Toxicologie Analytique et Clinique, Volume 34, Issue 3, Supplement, 2022, Page S149, ISSN 2352-0078, https://doi.org/10.1016/j.toxac.2022.06.251


