Abstract
This technical note demonstrates the ability of the SCIEX ZenoTOF 7600 system to sensitively quantify steroids and to qualitatively characterize their structures using electron-activated dissociation (EAD)-based fragmentation. The high speed of the MS/MS acquisition (133 Hz) mode enables high sample throughput while maintaining good spectral quality. The complimentary EAD fragmentation mode provides diagnostic fragments to distinguish steroid isomers and isobars.
Introduction
Hormonal steroids regulate most body functions and the dysregulation of these molecules can play a role in the pathophysiology of human disease. Early techniques to measure endogenous steroids include immunoassay and gas chromatography-mass spectrometry (GC-MS). Immunoassays are problematic because they lack specificity for low-level steroids due to interference from endogenous steroids present at higher levels. In contrast, GC-MS offers higher specificity and is sensitive to low-level steroids, however, it requires extensive sample preparation via derivatization. More recently, steroid analysis by liquid chromatography-tandem mass spectrometry (LC-MS/MS) has emerged as a sensitive and specific technique with a simplified sample preparation.
Here, the analysis of hormonal steroids by LC-MS/MS is explored using the ZenoTOF 7600 system (Figure 1). The lower limit of quantification (LLOQ) and the limit of detection (LOD) were calculated for steroids and steroid levels were measured in plasma samples. EAD-derived fragment ions were used to structurally characterize the steroids of interest. EAD generated structure-specific fragment ions that were sufficient to distinguish steroid isomers and isobars during analysis without requiring extensive chromatographic development.
Key features for steroid analysis using the ZenoTOF 7600 system
- The method leveraged the speed and sensitivity of the ZenoTOF 7600 system to enable robust, high-throughput quantitative analysis of hormonal steroids
- Fragment ions generated by EAD provided structural details that permitted characterization that cannot be achieved using data generated by collision-induced dissociation (CID)
- The LLOQs calculated for all measured steroids by HRMS were sufficient to accurately measure steroids in plasma
Methods
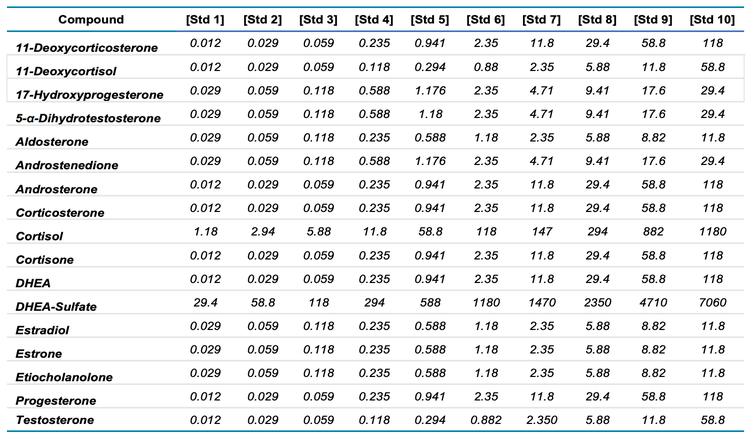
Sample preparation: Stock solutions of analytes and internal standards were diluted in PBS to generate standard curves using technical replicates to determine the LOD and LLOQ of steroids (Table 1). PBS was used as a matrix surrogate because plasma contains significant amounts of endogenous steroids. Deuterated internal standards were added to NIST 1950 plasma samples at a final concentration of 1 ng/mL to quantify endogenous steroids. For plasma samples and quality control (QC) samples, 5 µL of the internal standard mixture was added to 200 µL of sample with and 300 µL DI water. Samples were shaken @ 700 rpm for 5 minutes, and the protein was precipitated by adding 250 µL of 0.1M zinc sulfate and shaking @ 600 rpm for 5 minutes after which 500 µL cold methanol was added. Samples were again shaken at 500 rpm for 5 minutes, centrifuged at 2637 rcf for 10 minutes at room temperature, and the supernatant was collected and loaded onto a preconditioned HLB SPE 30mg (30 µm) plate. The plate was washed with DI water and steroids were eluted with acetonitrile. The eluant was dried with N2, and samples were reconstituted in 50 µL 50:50 methanol:water. The samples were then analyzed by LC-MS/MS using the ZenoTOF 7600 system.

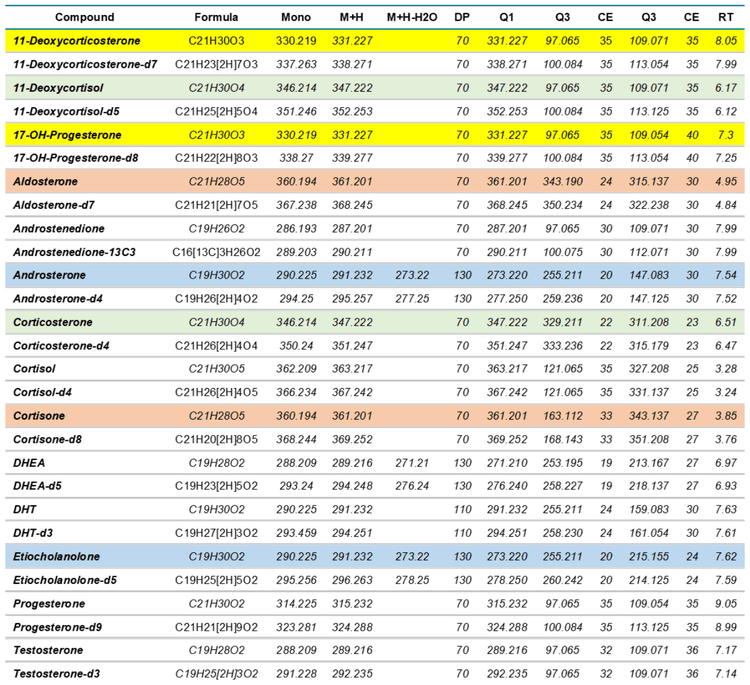
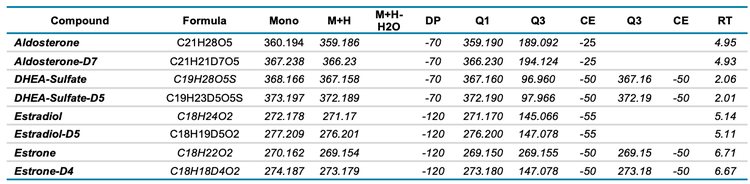
Mass spectrometry: Data were acquired with a ZenoTOF 7600 system using 2 methods. The LLOQ and LOD of various steroids were determined using the scheduled high-resolution multiple reaction monitoring scan mode (sMRMHR). The MRM transitions used are shown in Tables 3 and 4 for positive and negative ion modes, respectively. For positive ion mode analysis, CID and EAD accumulation times were set at 10 and 35 ms, respectively. In the negative ion mode, accumulation times were set at 25 and 35 ms, respectively. The compound-specific parameters used, including collision energy (CE) and declustering potential (DP), are listed in Tables 3 and 4. For DHEA-sulfate and estrone, pseudo MRM transitions were used (precursor ion to precursor ion) due to inefficient fragmentation. The impact of individual ZenoTOF 7600 system parameters on compound analysis has been previously described.1
Experiments to structurally characterize steroids via EAD-based fragmentation were performed using a data-dependent acquisition (DDA) scan mode. The TOF MS mass range was set to m/z 100–500 for positive ion mode and m/z 100–800 for negative ion mode. The accumulation time was set to 100 ms. The data-dependent MS/MS accumulation times used matched those reported for the positive and negative polarity sMRMHR experiments.
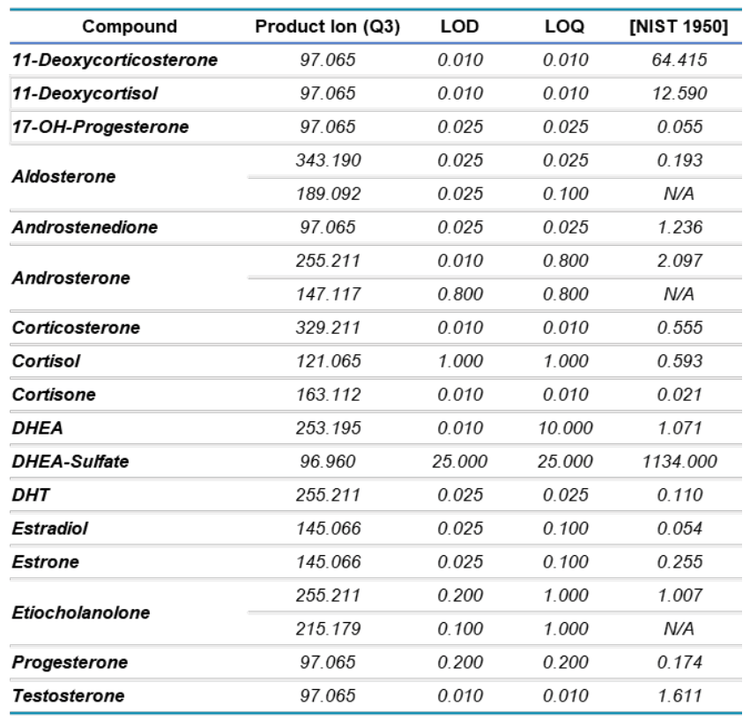
LLOQ and LOD determination for steroids on the ZenoTOF 7600 system
Standard curves analyzed using the sMRMHR scan mode run with CID-based fragmentation yielded LLOQ and LOD values for all compounds tested (Table 5). DHEA-sulfate, estradiol and estrone were measured in the negative ion mode and all other compounds were measured in the positive ion mode. Aldosterone had LOD and LLOQ values from both positive and negative ion modes. These values were derived from linear regression lines for each standard curve. The LOD and LLOQ values calculated for each compound, except androsterone, were equivalent to the lowest concentrations used in the standard curve. The qualifying MRM transition (273.2/147.1) of androsterone had an LLOQ around the fifth standard in the curve listed in Table 1. In contrast, the quantitative MRM transition for androsterone matched the lowest concentration of the standard curve. The LLOQ values achieved therefore might have been lower, had a greater concentration range been tested for the standard curve. However, the limits achieved were sufficient to enable accurate detection of all measured steroids in plasma..
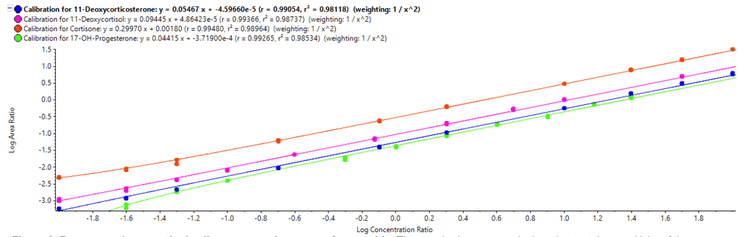
Linear regression curves were generated for each steroid (Figure 2) and a linear dynamic range (LDR) > 5-orders of magnitude was observed. The generated standard curves were within the LDR, as exemplified by simultaneous runs of the standard curves for 11-deoxycortisol and cortisol. The standard curve for 11-deoxycortisol included concentrations as low as 0.012 ng/mL, whereas the standard curve for cortisol included concentrations as high as 1180 ng/mL. This large difference in concentrations spans a LDR of 5 orders of magnitude, from -2 to +3 log concentration ratios (data not shown).
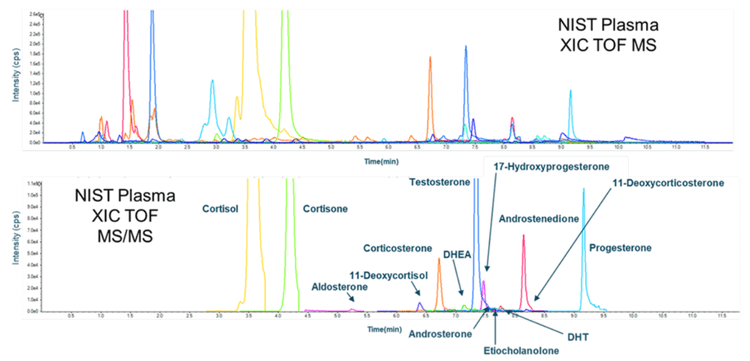
Quantification of steroids in NIST 1950 plasma
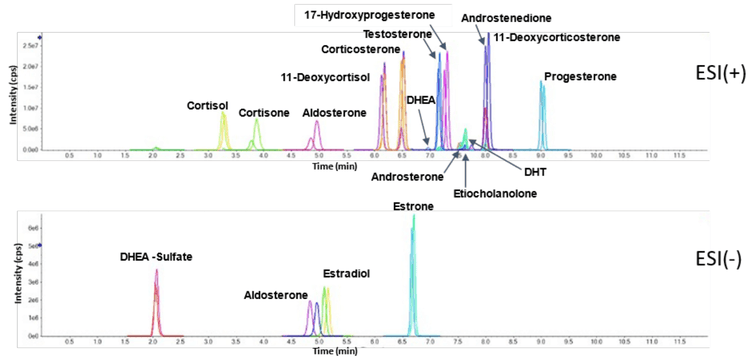
The pooled plasma standard from the National Institute of Standards and Technology (NIST), NIST 1950, is an important reference standard for measuring endogenous metabolites. The internal standard curves generated with primary reference and internal standards in a PBS matrix surrogate were used to measure the concentrations of the 17 monitored steroids (Table 5). A representative chromatogram showing the total ion chromatogram (TIC) and the XIC for NIST 1950 is shown in Figure 3. These data demonstrate that the ZenoTOF 7600 system has the requisite sensitivity and linear dynamic range to measure these compounds in a biological matrix.
Structural characterization of steroid standards using EAD-based fragmentation
Distinguishing structural isomers is a significant challenge in bioanalysis. During MS/MS events, isolation of the precursor ion in Q1 is a low-resolution event, regardless of whether the instrument is nominal or accurate mass. Consequently, isobaric molecules that have nearly the same mass can make it more challenging to distinguish between isomers. This is further complicated when analyzing complex matrices, such as plasma. Traditional LC-MS/MS methodologies use CID to generate fragments for quantification. If isomers and/or isobars interfere with the analysis of CID-based fragments, then time-consuming chromatographic methods must be used to resolve these compounds. However, the development of EAD using a tunable electron emitter, such as that found on the ZenoTOF 7600 system, has improved the generation of unique diagnostic fragment ions for singly charged molecules. The EAD-generated fragments enable high compound specificity without the need for extensive chromatographic method development.
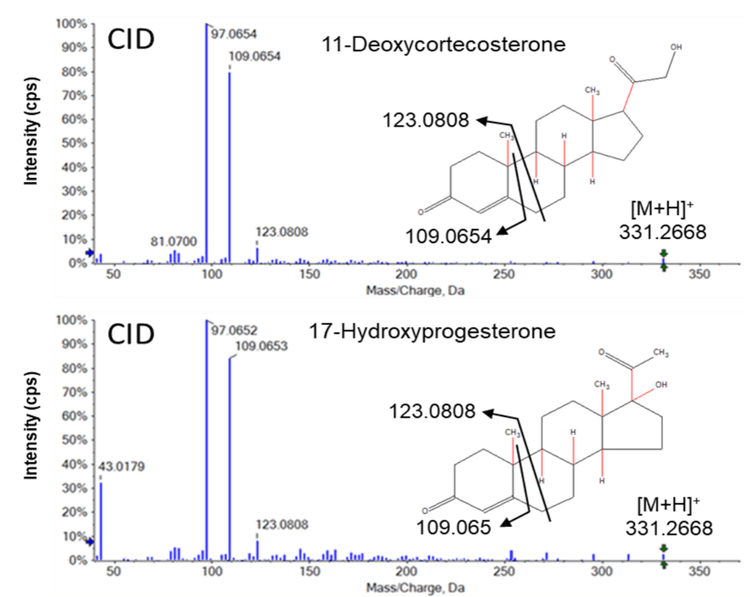
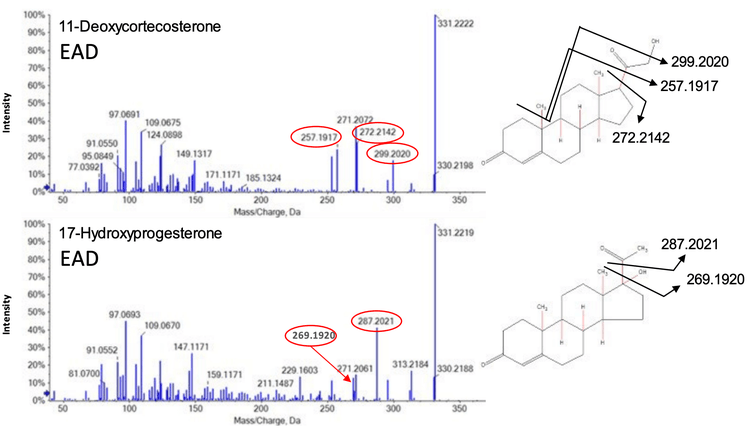
EAD fragmentation can be used to distinguish between molecules that appear identical with CID fragmentation. Figure 4 shows the identical CID product ion spectra for the isomers 11- deoxycorticosterone and 17-hydroxyprogesterone, which both have masses of m/z 331.227 (Table 3, highlighted in yellow). MRM transitions are not sufficient to distinguish between the CID-based spectra of these molecules. Therefore, the isomers must first be chromatographically separated by HPLC.
In contrast, EAD-based fragmentation generated rich MS/MS data for the same pair of isomers, without requiring an additional chromatography step (Figure 5). EAD fragmentation results in both homolytic (radical-based) and heterolytic (not radical-based) scission events. Unlike CID, which uses thermal degradation to cleave molecules at low-energy bonds, EAD cleaves functional groups, ring structures and alkyl chains, independent of bond energy. This results in a rich spectrum that can provide sufficient structural information to fully characterize a molecule.
Figure 5 (top) shows 3 unique EAD-based fragments derived from 11-deoxycorticosterone that were not present in the spectrum for 17-hydroxyprogesterone (Figure 5, bottom). Similarly, 2 unique fragments were found for 17-hydroxyprogesterone. These product ions can be used in sMRMHR experiments using EAD-based fragmentation to increase the specificity of the assay by distinguishing between these 2 isomers.
This pattern of results was not unique to the 11- deoxycorticosterone and 17-hydroxyprogesterone isomers. Similar data were obtained for the other 3 sets of isomers (Table 3, highlighted in blue, green and orange) and structurally specific EAD-based fragment ions were found that could distinguish each compound (data not shown).
Conclusion
- The method leverages the speed and sensitivity of the ZenoTOF 7600 system to enable robust, high-throughput analysis of hormonal steroids in human plasma
- Fragment ions generated by EAD provide structural details that allow characterization that cannot be achieved using data collected by CID
- The simultaneous use of CID- and EAD-based fragmentation during quantitative analysis supports high-throughput analysis while improving analyte specificity
References
- Baker, PRS and Proos R. Untargeted data-dependent acquisition (DDA) metabolomics analysis using the ZenoTOF 7600 system. https://sciex.com/technotes/life-science-research/metabolomics/untargeteddata-dependent-acquisition--dda--metabolomics-analysi