A sensitive method for the quantitation of PFAS in a fluoro-pharmaceutical active pharmaceutical ingredient
Ebru Selen, Rahul Baghla and Eshani Galermo
SCIEX, USA
Abstract
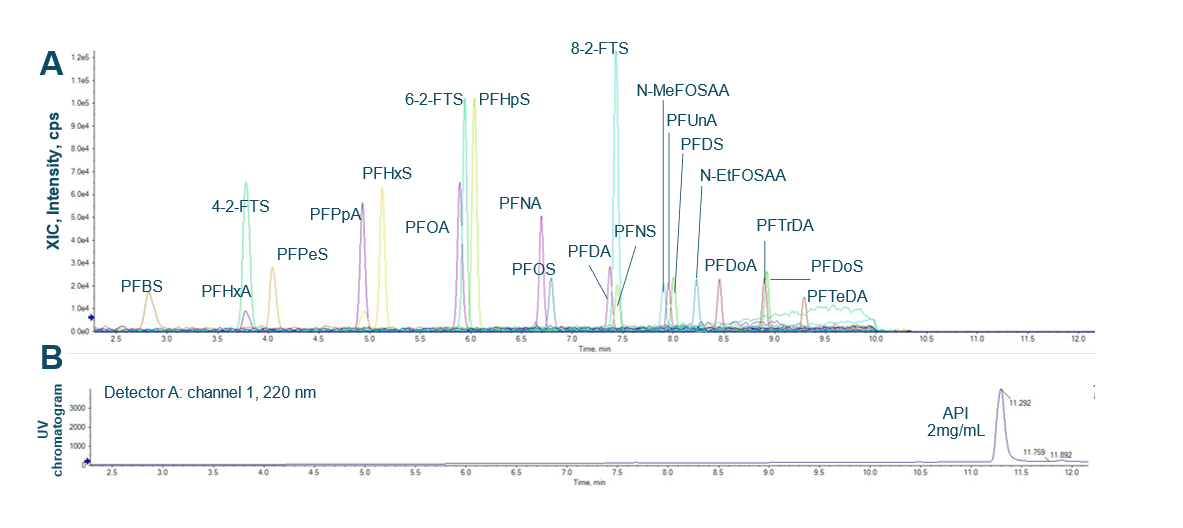
This technical note demonstrates a sensitive quantitation method for perfluoroalkyl and polyfluoroalkyl substances (PFAS) in a fluoro-pharmaceutical active pharmaceutical ingredient (API). Baseline chromatographic separation was achieved between the PFAS and the API (Figure 1). Accurate and highly reproducible quantitative performance was achieved for the analysis of 23 PFAS in API solution.
Introduction
The safety limits for PFAS in drinking water are carefully determined and regulated by government organizations to ensure public health. The definition of PFAS in the pharmaceutical industry has only recently become a topic of discussion. In such a scenario, evaluating PFAS in pharmaceuticals would necessitate sensitive and selective assays for high-confidence detection and quantitation. In this technical note, a sensitive quantitation method using existing minimal risk level (MRL) screening values1 for the 4 PFAS; PFOA, PFNA, PFHxS and PFOS in water to study the presence of PFAS in an API at maximum daily dose level. Here, a representative study was performed with 23 PFAS compounds where no PFAS compounds were detected in the unspiked API test solution (Table 4).
Figure 1: Chromatographic separation was achieved for all PFAS compounds in the presence of 2 mg/mL API. Representative extracted ion chromatograms (XICs) of PFAS at 0.05 ng/mL in API (A) are displayed. A UV chromatogram of API indicates a clear separation between PFAS and the API at 2 mg/mL concentration (B).
Key features of quantitative analysis of PFAS using the SCIEX 7500+ system
- Baseline chromatographic separation: Achieve baseline separation of 23 analyzed PFAS and the API
- Low-ng/mL level quantitation of PFAS compounds: LOQs ranging between 0.001 and 0.02 ng/mL were achieved with an accurate quantitative performance with %CV <9% for a total of 23 studied PFAS
- Achieving wide dynamic range: A wide linear dynamic range (LDR) spanning ≥3 orders of magnitude was reached with a coefficient of determination (r2) of ≥0.993 for all PFAS analyzed on the SCIEX 7500+ system
- User accessibility to front-end cleaning: Easily perform routine system maintenance to elevate instrument uptime using the DJet+ assembly1
Methods
Samples and reagents: PFAS mixture (PFAC-MXH) and respective internal standard (IS) mixture (MPFAC-HIF-ES) were purchased from Wellington Laboratories.
Sample preparation: A working stock of 20 ng/mL was prepared in a 90:10 (v/v) methanol/water mixture and serially diluted using the same solvent to prepare the calibration curve samples. The concentrations ranged between 0.001 and 20 ng/mL. The API test solution was prepared using the same diluent. 0.05 ng/mL of the PFAS and IS mixture were spiked into the API test solution containing 2 mg/mL of API.
Chromatography: Chromatographic separation was achieved using a delay column Phenomenex Gemini (3 x 50 mm, 3 μm, 100 Å) after the mixer on LC to delay any possible PFAS contamination coming from mobile phase solvents. A Phenomenex Kinetex Phenyl Hexyl (3 x 100 mm, 2.6 μm, 100 Å) column was used to achieve baseline separation between the PFAS and API. The column was kept at 40°C. The ExionLC AD system was operated at a 0.3 mL/min flow rate. Mobile phase A was 5mM Ammonium acetate in water and mobile phase B was 5mM ammonium acetate in methanol. An injection volume of 2 μL was used for the analysis.
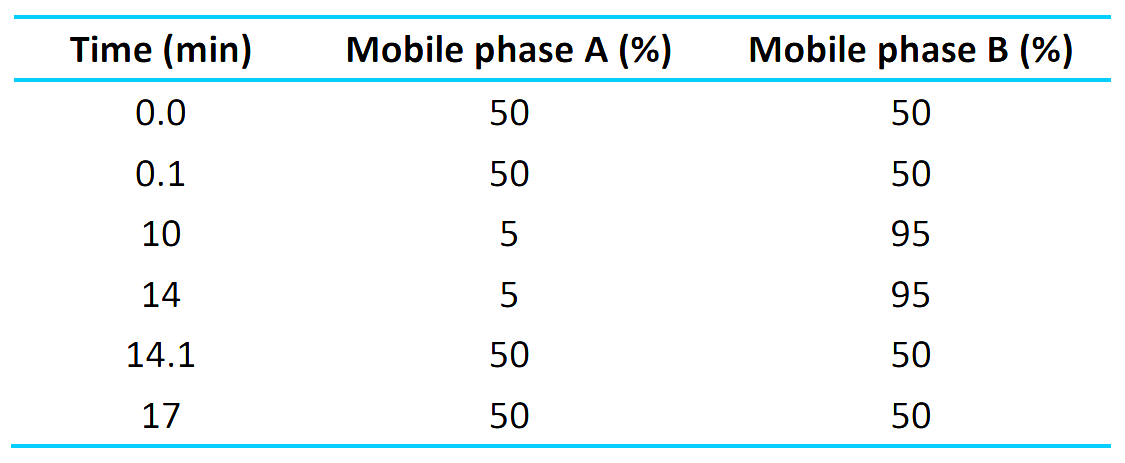
The chromatographic gradient conditions are summarized in Table 1.
Table 1: LC gradient.
The diverter valve was set to switch to waste at 10 min to divert API peak to the waste after the elution of PFTeDA peak at 9.292 min.
UV chromatography: UV detection was enabled at 220 nm for the API detection.
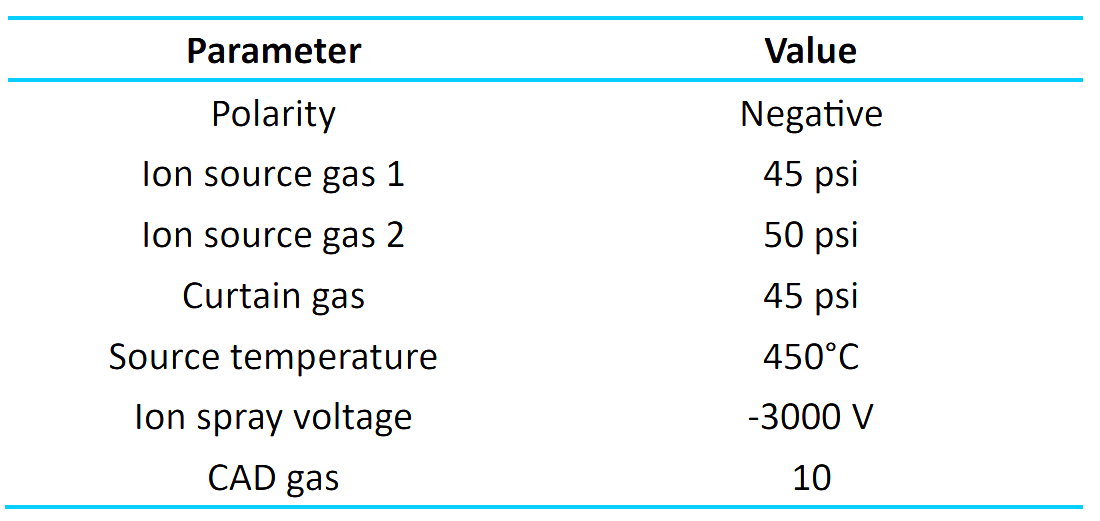
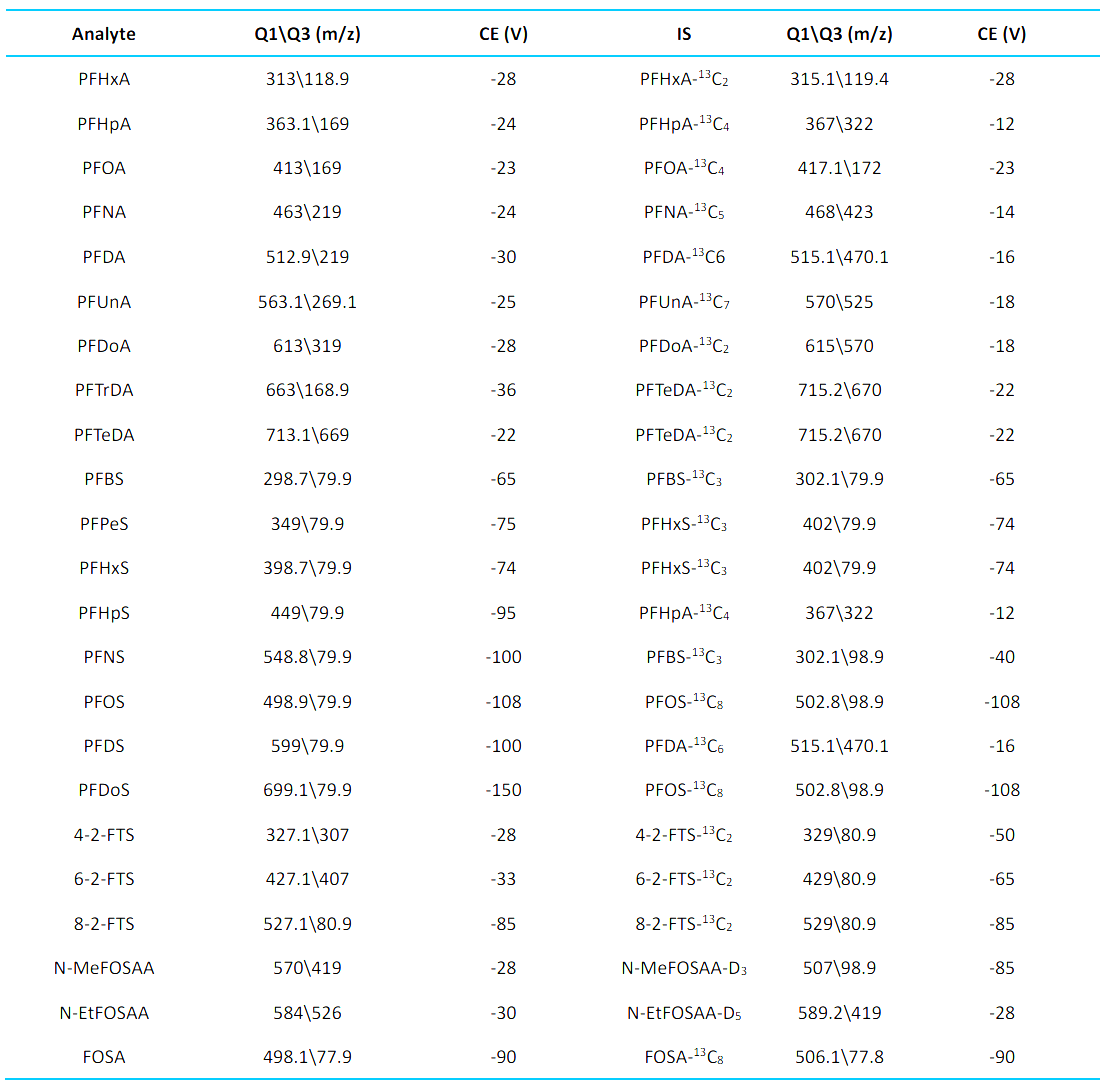
Mass spectrometry: The optimized source and gas parameters are listed in Table 2. MRM transitions are listed in Table 3.
Table 2: Source and gas parameters.
Data processing: Data collection and analysis were performed using the SCIEX OS software, version 3.3.1. Peaks were integrated using the MQ4 algorithm and a weighting of 1/x2 was used for quantitation.
Table 3: MRM transitions and conditions.
Quantitation performance
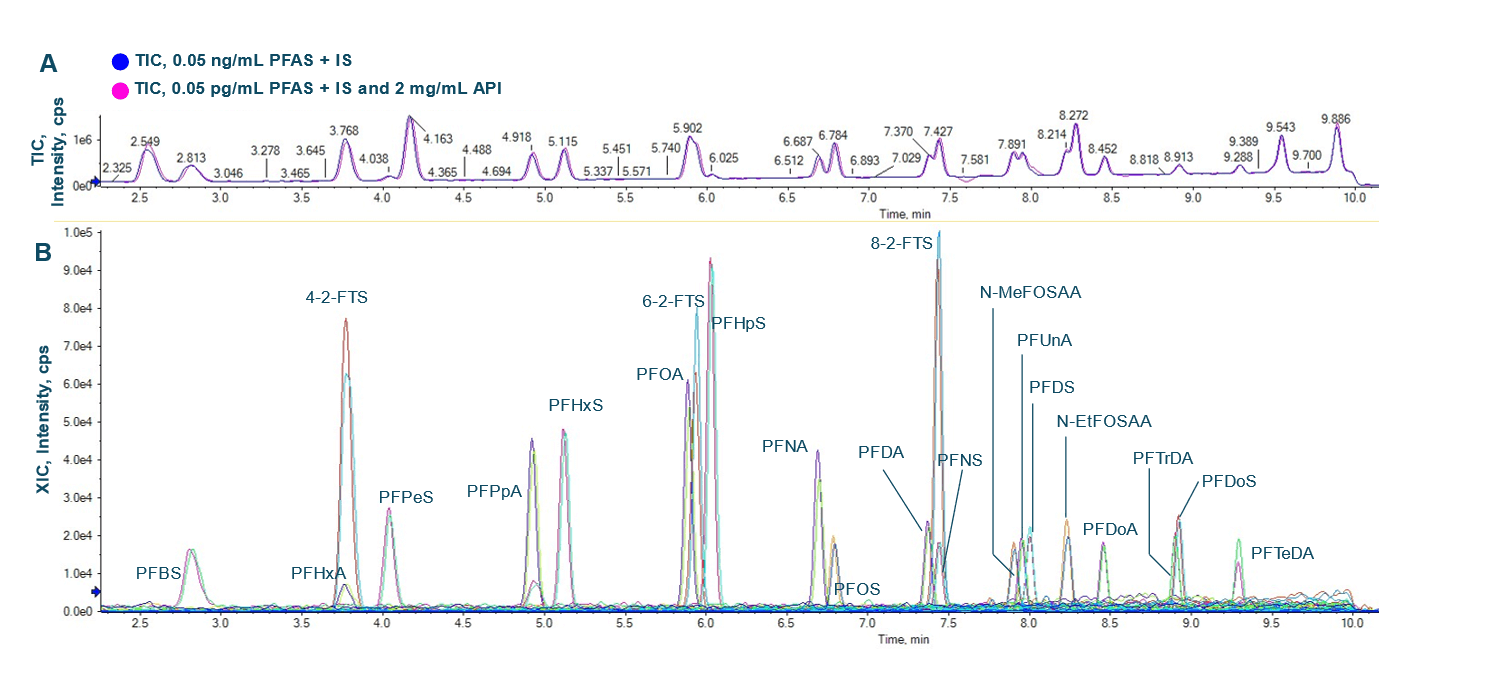
This technical note demonstrates a low-ng/mL level quantitation of PFAS using the SCIEX 7500+ system. Overlay XIC traces demonstrate similar chromatography of PFAS compounds in solvent and API solution at 2 mg/mL (Figures 2A and 2B). A clear separation between API and the PFAS is demonstrated in (Figure 1).
Figure 2: Overlay of the total ion chromatograms (TICs) of 0.05 ng/mL PFAS in solvent (blue) and in API (pink) (A) and XICs of all the PFAS compounds (B).
Exposure limits were calculated for 4 PFAS, perfluorooctanoic acid (PFOA), perfluorooctane sulfonic acid (PFOS), perfluorohexane sulfonic acid (PFHxS) and perfluorononanoic acid (PFNA) based on the published detection limits in drinking water.2 Table 4 shows the quantitation results for these PFAS compounds at the LOQ levels with their respective daily limit concentrations for water consumption in adults and children.
Table 4: Four PFAS and their MRLs2 in drinking water.
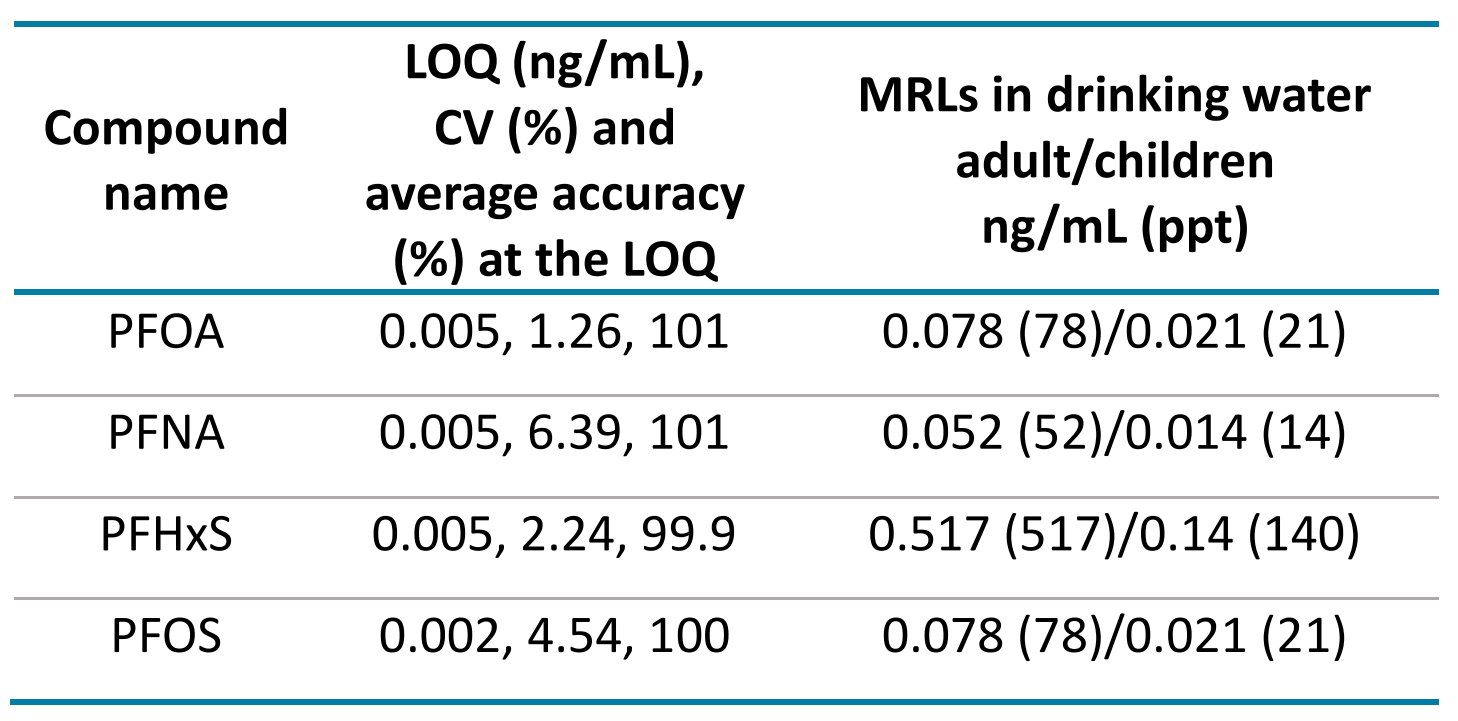
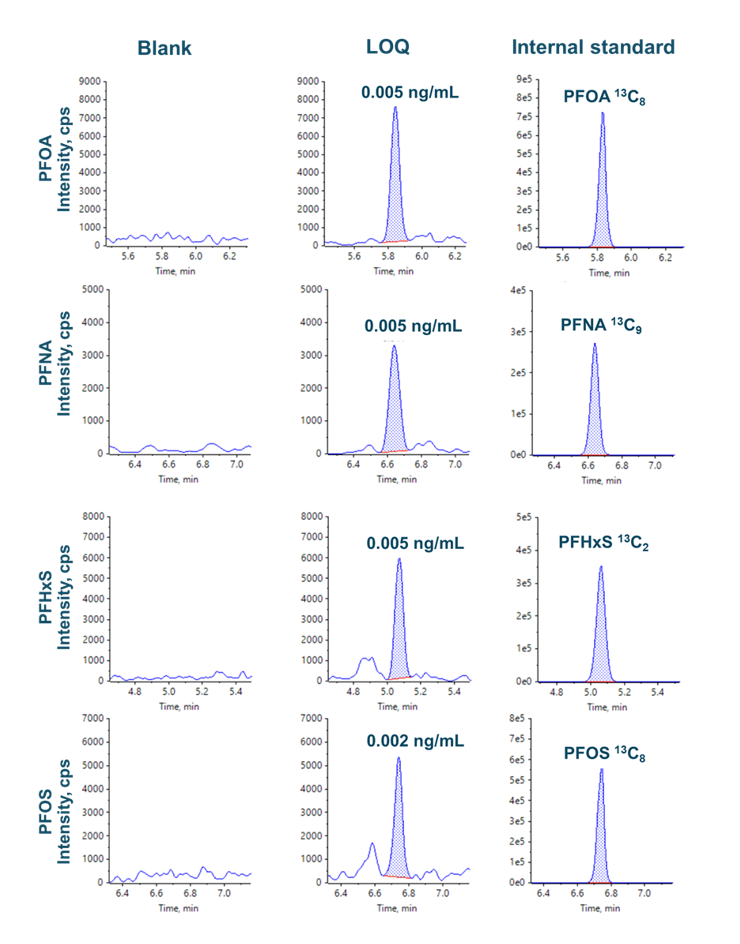
Figure 3 shows the XICs at the LOQ levels for PFOA, PFNA, PFOS and PFHxS. LOQs were achieved with ± 6% variability and with acceptable accuracy (Table 4, Figure 3). No background contamination was observed in blank samples (Figure 3). Figure 4 shows the quantitative performance for PFOA, PFNA, PFOS and PFHxS. The LDR was ≥3.3 orders of magnitude with an r2 of ≥0.995 for the 4 representative PFAS. The assay accuracy was within ±13% with %CV <8% for PFOA, PFNA, PFOS and PFHxS.
Figure 3: Representative XICs of PFOA, PNFA, PFHxS and PFOS and their respective internal standards. LOQs ≤ 0.005 ng/mL were achieved for 4 PFAS. No contamination interference was observed at the retention time of the analyte.
The XICs of 4 representative PFAS in API blank were evaluated; no PFAS compounds were detected in the unspiked API test solution (Figure 5).
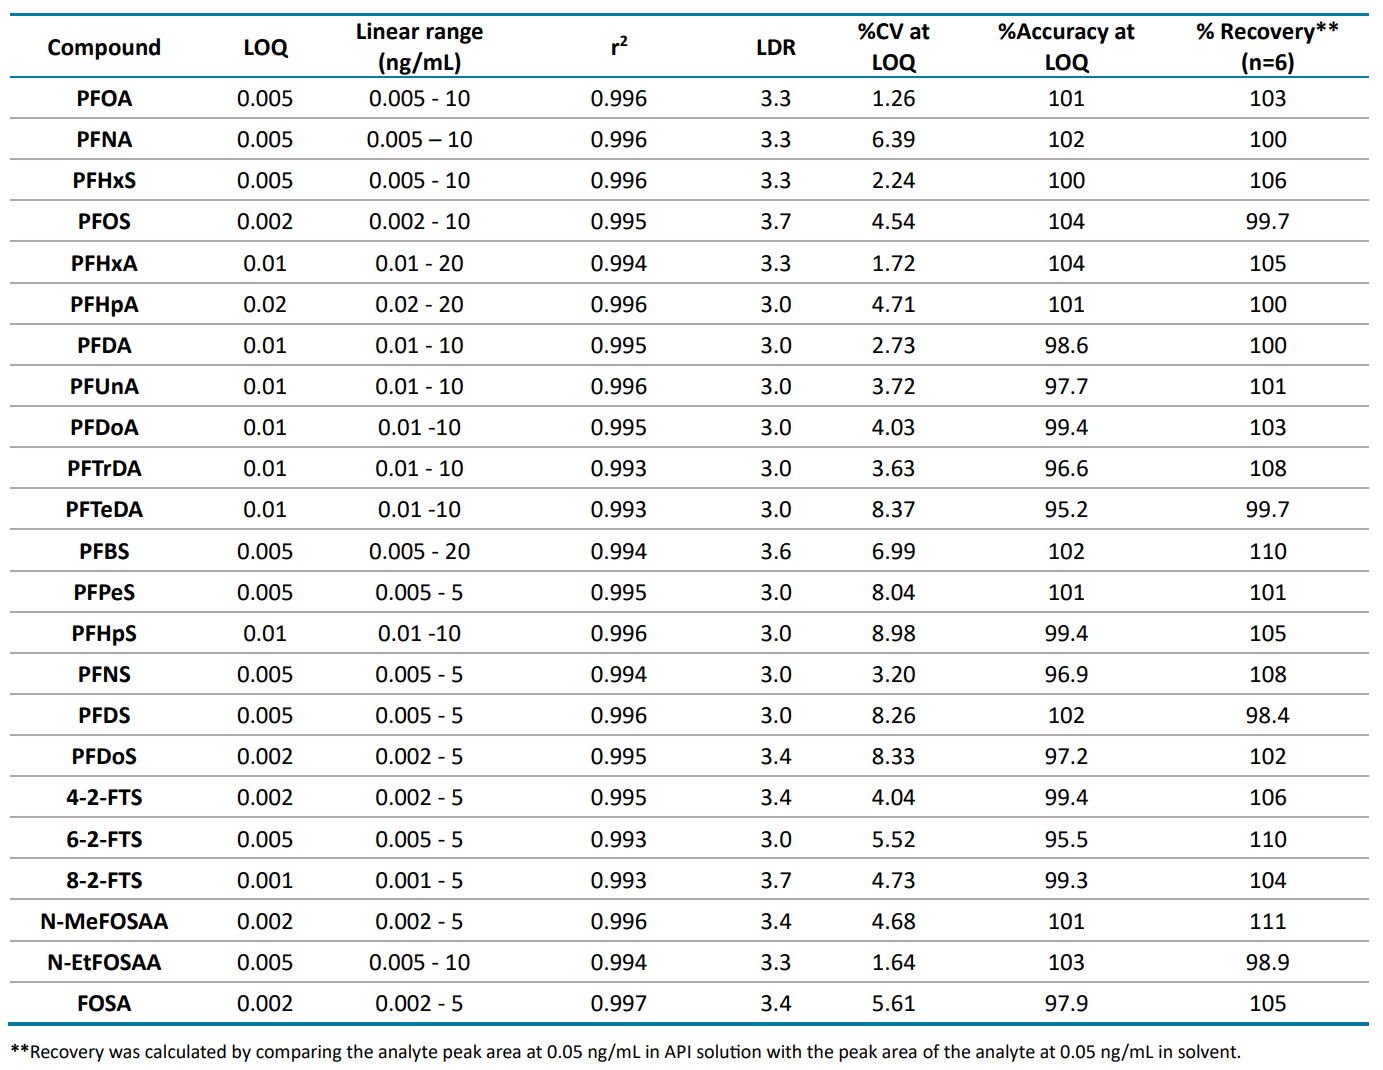
Table 5 summarizes quantitation performance for the 23 PFAS compounds. LOQs ≤0.02 ng/mL were achieved with LDRs spanning a ≥3 orders of magnitude. Linearity was achieved with an r2 of ≥0.993. The assay accuracy was within ±5% with %CV <9% for 23 PFAS compounds at the LOQ level.
Recovery was evaluated by comparing the peak area of each PFAS compound at 0.05 ng/mL in API solution against the peak area of each PFAS compound at 0.05 ng/mL in solvent (Table 5). Testing was performed using 6 replicates for all 23 PFAS compounds. Good assay recovery was achieved within ±11% variability
Figure 4: Calibration curves and quantitative performance of PFOA, PFNA, PHFxS and PFOS on the SCIEX 7500+ system. The area ratio between PFAS and its respective internal standard was used to generate calibration curves. Each concentration level was run in triplicate. Linearity was achieved between the ranges denoted on the graph. Linearity was spanned an LDR of >3 orders of magnitude with an r2 >0.995 on the SCIEX 7500+ system (left). Exceptional reprocudibility and accuracy were achived for all PFAS analyzed (right).
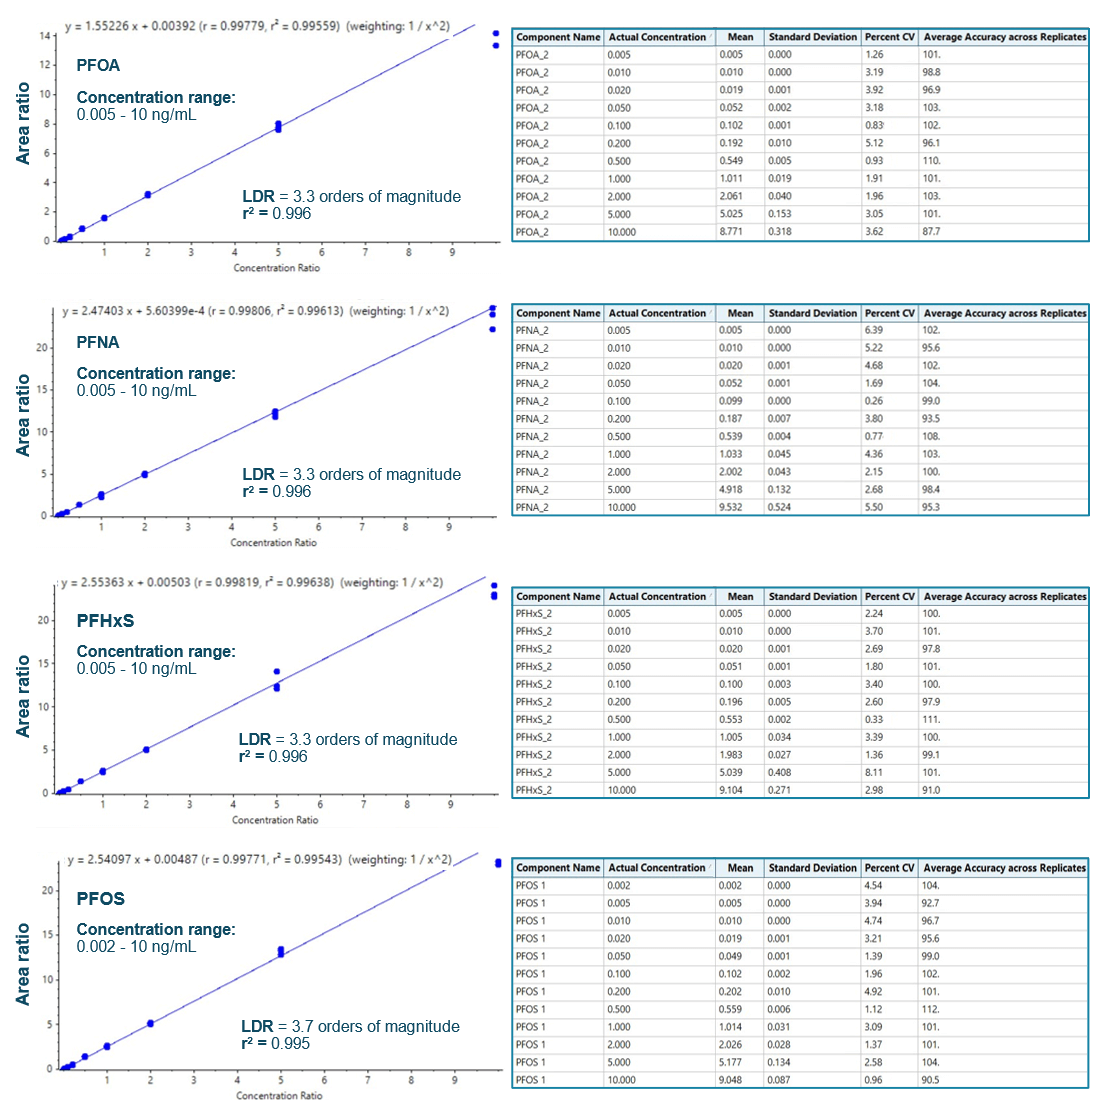
Figure 5: Representative XICs of 4 PFAS in API solution at blank and 0.05 ng/mL levels. No PFAS compounds were detected in the API blank
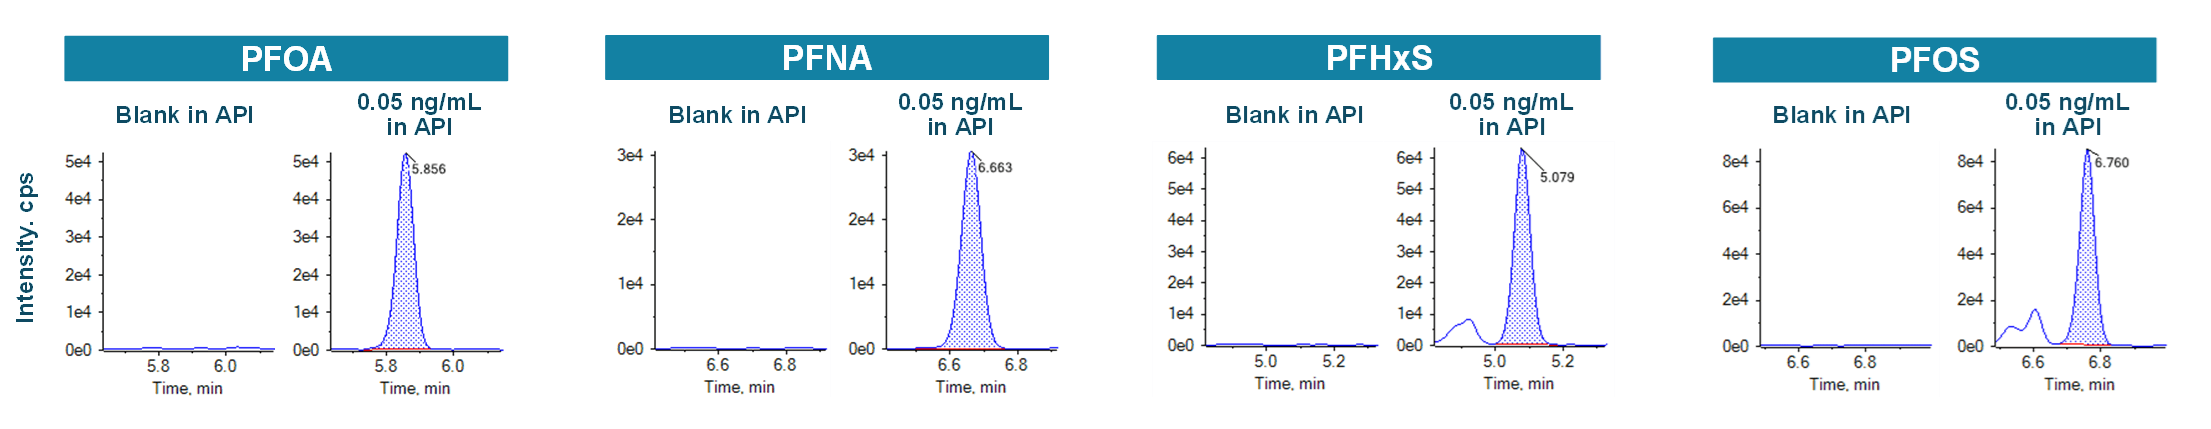
Table 5: Quantitation performance and recovery of the assayed 23 PFAS compounds.
Conclusion
- Good baseline separation was achieved between 23 analyzed PFAS and analyzed API
- Low ng/mL levels of LOQs were achieved for 23 PFAS compounds analyzed on the SCIEX 7500+ system. No PFAS compounds were detected in the unspiked API test solution.
- Good quantitative performance was achieved with an r2 of ≥0.993 for all PFAS and LDR spanning ≥3 orders of magnitude achieved on the SCIEX 7500+ system
- Good assay recovery within ±11% variability was achieved for all PFAS tested
References
- Redefine bioanalysis with enhanced robustness on the SCIEX 7500+ system. SCIEX technical note, MKT-31350-A.
- ATSDR’s Minimal Risk Levels (MRLs) and Environmental Media Evaluation Guides (EMEGs) for PFAS