Abstract
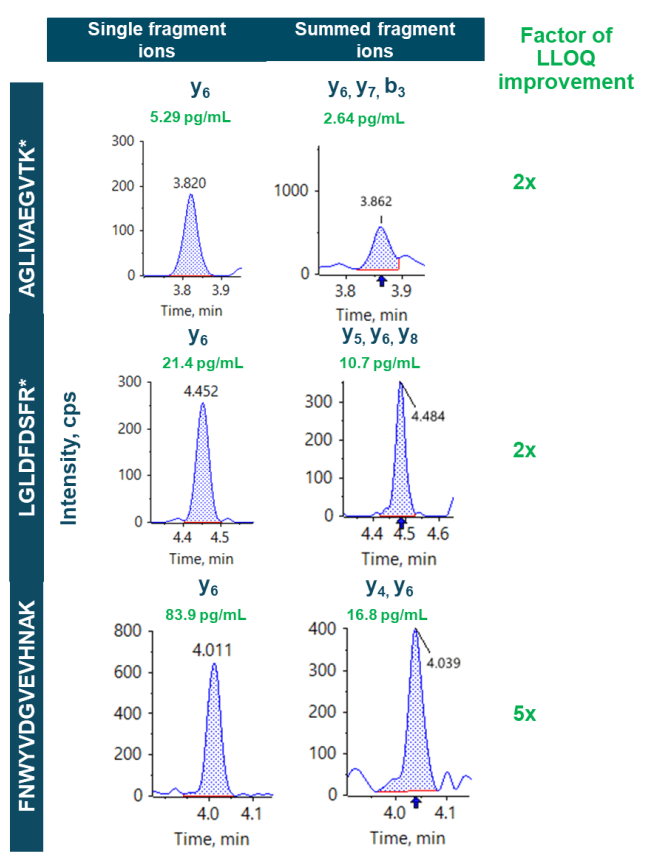
This technical note describes a sensitive quantitation method for signature peptides in rat plasma using a microflow LC coupled to the ZenoTOF 7600 system. Streamlined method development was performed by collecting fragment ion information over a wide MS/MS range for each peptide. Multiple highly abundant fragment ions were summed, resulting in a 2- to 5-fold improvement in the lower limit of quantitation (LLOQ, Figure 1). The LLOQs observed ranged from 2.64 pg/mL to 16.8 pg/mL. The broad linear dynamic range (LDR) spanned more than orders of magnitude.
Introduction
Quantitation of peptide and protein therapeutics in biological matrices is important for the development of biotherapeutics. Serving as an orthogonal technology to the traditional ligand binding assays (LBAs), LC-MS has been routinely adopted for quantitative measurement of protein levels in bioanalytical laboratories. The triple quadrupole platform offers great sensitivity and quantitative performance and has been a key driver for most bioanalytical methods. However, accurate mass spectrometry has increasingly been adopted for quantitative bioanalysis.1,2 With the inherent advantage of greater selectivity, improved mass resolution and the flexibility of TOF MS/MS data analysis, the ZenoTOF 7600 system provides excellent quantitative performance in multiple dimensions.3 Accurate mass spectrometry platforms, such as traditional time-of-flight (TOF) systems, often lack sensitivity due to a loss of ion transmission between TOF pulses. The Zeno trap controls the ion beam from the collision cell to facilitate greater ion transmission to the TOF accelerator. The Zeno trap boosts the duty cycle to ≥90%, which enhances overall MS/MS sampling efficiency. In this technical note, 3 signature peptides were quantified using a microflow LC method paired with the ZenoTOF 7600 system.

Key features of peptide quantitation using a microflow LC with the ZenoTOF 7600 system
- Low-level quantitation: Achieve sensitive quantitation (LLOQs between 2.64 pg/mL and 16.8 pg/mL) of signature peptides in complex matrices using the Zeno MRMHR method
- Simplify quantitation methods: Streamline quantitation methods by collecting data over a wide MS/MS range for flexible post-acquisition data processing
- Improve quantitative sensitivity: Reach enhanced sensitivity by summing multiple highly abundant fragment ions using TOF MS/MS data and the Zeno trap
- Quantitative performance: Ensure accurate and highly reproducible (%CV <15%) quantitative methods with a LDR spanning ≥4 orders of magnitude using the ZenoTOF 7600 system
- Streamline data management: Easily acquire and process data on a single platform using SCIEX OS software
Methods
Sample preparation: Plasma proteins were precipitated with cold methanol. After centrifugation, the supernatant was discarded. The pellet was solubilized in 200mM ammonium bicarbonate in 10:90 (v/v), methanol/water. Digestion was performed using trypsin. The solution was heated for 1 hour at 60°C and then acidified by the addition of formic acid.4 The digested plasma was diluted by 200x using a solution containing 5% acetonitrile, 1% formic acid and 94% water by volume. Synthesized peptides (Table 1) were spiked into the digested plasma solution and the resulting solution was then serially diluted in matrix. The final injection volume was 10 µL.
Summation of multiple fragment ions
FNWYVDGVEVHNAK, AGLIVAEGVTK* and LGLDFDSFR* were quantified using a microflow LC method on the ZenoTOF 7600 system. In this method, the quantitation of signature peptides was performed using Zeno MRMHR.
The accessibility of TOF MS/MS data can be advantageous as post-acquisition data decisions can be made on which measured fragments can be utilized for MRMHR. For MRMHR, quantitation can be performed using a single fragment ion or by summing multiple dominant fragment ions. When multiple highly abundant fragment ions are generated from the target peptide, summed XICs can further enhance assay sensitivity.
For quantitation using multiple fragments, the most abundant ions were summed for optimal assay sensitivity. Fragment ions y5, y6 and y8 were summed for the peptide LGLDFDSFR*, while fragment ions y4 and y6 were summed for the peptide FNWYVDGVEVHNAK. For peptide AGLIVAEGVTK*, fragment ions y6, y7 and b3 were summed for quantitation.
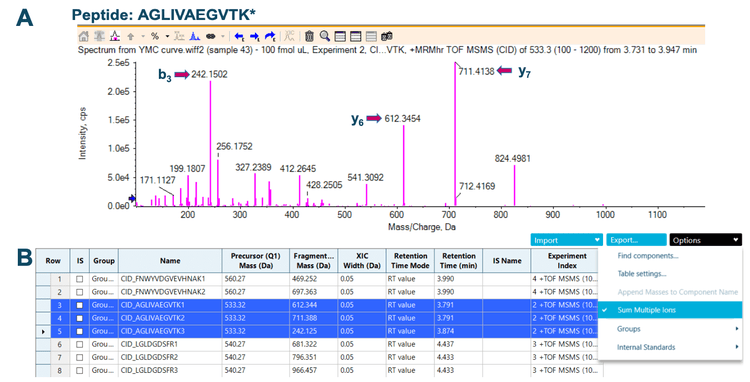
Figure 2 shows the application of SCIEX OS software for the summation of fragment ions. The MS/MS spectrum of m/z 533.3 for peptide AGLIVAEGVTK* was generated using the Explorer module in SCIEX OS software. Highly abundant fragment ions including b3, y6 and y7 were selected for summation. The product ion information was input into the Analytics module in SCIEX OS software and the feature to sum multiple ions was applied to generate a total XIC for quantitation of the peptide AGLIVAEGVTK*.

Quantitative performance for the analysis of signature peptides
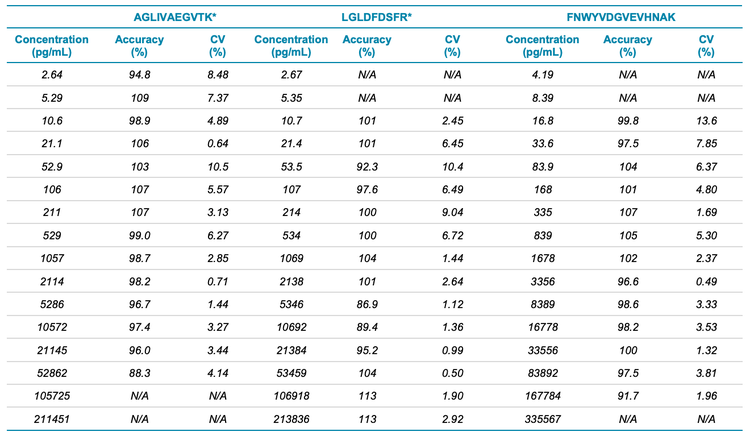
The LLOQ was determined based on the requirements that the %CV of the average concentration must be below 20% and the accuracy must be between 80% and 120%. For concentrations above the LLOQ, the %CV of the mean calculated concentration was required to be below 15% and the accuracy was required to be between 85% and 115%.
Summed fragment ions provided LLOQs of 2.64 pg/mL, 10.7 pg/mL and 16.8 pg/mL for peptides AGLIVAEGVTK*, LGLDFDSFR* and FNWYVDGVEVHNAK, respectively (Figure 3).


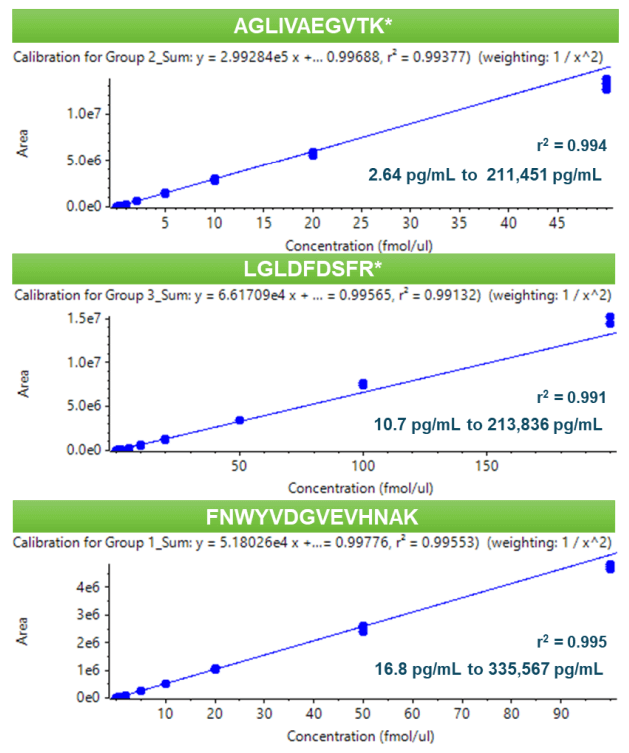
All calibration points were measured in triplicate. An LDR spanning ≥4 orders of magnitude was achieved for all peptides studied with a coefficient of determination (r2 ) of >0.99 (Figure 4). The calculated concentrations of each calibration point were within ±13% of the nominal value and the overall %CV was <14% (Table 5). Accuracy was within ±6% of the nominal concentration at the LLOQ.
This assay demonstrates the ability of a microflow LC method to produce greater sensitivity levels for peptide quantitation compared to a previous study using a high-flow LC solution.4 The LLOQs were improved 2.5- to 5-fold with the application of a microflow LC providing enhanced sampling efficiency for peptide analysis.

Conclusion
- Low levels of quantitation (LLOQs between 2.64 pg/mL and 16.8 pg/mL) for signature peptides were achieved using a Zeno MRMHR method on the ZenoTOF 7600 system
- Easy method development for peptide quantitation allowed the collection of fragment ion information over a wide MS/MS range for more efficient post-acquisition data processing
- Summation of multiple fragment ions provided a 2- to 5-fold enhancement in LLOQ with the availability of TOF MS/MS data and analysis using the Zeno trap
- Streamlined data acquisition and processing were performed using SCIEX OS software, in which users can efficiently integrate and evaluate quantitative data using features such as the summation of multiple fragment ions
- Microflow LC provided greater sensitivity for peptide quantitation compared to a previously reported high-flow method. 4 A 2.5- to 5-fold improvement in LLOQ was observed given the greater gas phase ion production that microflow LCs afford.
References
- Mike-Qingtao Huang, Zhongping (John) Lin, Naidong Weng (2013). Applications of high-resolution MS in bioanalysis. Bioanalysis 5(10):1269-1276.
- Yuan-Qing Xia, Jim Lau, Timothy Olah, Mohammed Jemal (2011). Targeted quantitative bioanalysis in plasma using liquid chromatography/high‐resolution accurate mass spectrometry: an evaluation of global selectivity as a function of mass resolving power and extraction window, with comparison of centroid and profile modes. Rapid Communications in Mass Spectrometry 25(19):2863-2878.
- Enhanced sensitivity for peptide quantitation in a complex matrix using high-resolution LC-MS/MS. SCIEX technical note, RUO-MKT-02-13324-A.
- Sensitive signature peptide quantification in a complex matrix using accurate mass spectrometry. SCIEX technical note, RUO-MKT-02-14193-A.


