Abstract
The speed and quality of fluorescence-based high-throughput screening (HTS) methods have become critical problems in the drug discovery process, yet these methods remain common due to their sensitivity, ease of use and adaptability to HTS formats. The use of labeled compounds increases the cost per sample and the detected response can be affected by fluorescent quenchers, colored compounds and form aggregates. These pan-assay interference compound (PAIN) effects are problematic, as they produce false positive results and are difficult to predict. Alternative approaches to fluorescence assays for high-throughput sample analysis are being implemented, such as mass spectrometry, which utilizes label-free detection of the analyte using the mass-to-charge ratio.1 However, the traditional LC-MS analysis of 384 samples requires hours, compared to the seconds needed for a plate reader, and typically necessitates different buffer requirements. The Echo® MS+ system with the ZenoTOF 7600+ system presents an alternative approach for analyzing small molecules and intact proteins and can solve some of the challenges faced by traditional techniques in biologically relevant buffers (Figure 1).
Key features
- Rapid determination of optimal assay buffers: Quickly view results to visually determine the optimal buffer for the analyte(s) of interest. This method enables the analysis of 88 samples in 8 different buffers in less than 8 minutes.
- Rapid determination of assay lower limit of quantitation (LLOQ): Analyze concentration curves for the analyte(s) of interest in as little as 1 second per sample
- Wide peak ejection mode: Increase the number of scans across each peak by 3.6× using wide peak mode (70 nL at 10 Hz) compared to a standard acoustic ejection (2.5 nL at 400 Hz)
- Optimization of proteins, peptides and small molecules: The versatility of the ZenoTOF 7600+ system is now combined with the speed of the Echo® MS+ system to deliver high-resolution data for all types of analytes
- Full workflow automation: Perform sample dilutions and serial dilutions with a 96-multichannel pipetting head module and a span-8 pod combined in the Biomek i7 series liquid handler
- Streamlined data management: Acquire data in batches or individually and process data in SCIEX OS software using the Analytics and Explorer modules
Introduction
Depending on the buffers and surfactants used in HTS assays, the mass spectrometer response will vary as different components of buffers contribute to ionization efficiency.1,2 To assess potential ionization efficiency, samples would typically be prepared at increasing concentrations in a range of buffers and injected, adding a significant amount of time to develop a suitable assay using standard lower throughput systems. Determining the LLOQ is also a time-consuming process that requires making numerous dilutions of the compound of interest after the optimal buffer has been determined.
This technical note describes an automated, high-throughput approach for simultaneously determining the optimal assay buffer and LLOQ in a range of common HTS buffers. Sample preparation and serial dilution in 8 different buffers were carried out using a Beckman Coulter® Biomek i7 liquid handling platform. The Echo® MS+ system coupled with the ZenoTOF 7600+ system performed the sample analysis.
Dextromethorphan was selected as a model compound (271.4 g/mol). In addition, a medium-sized, xenobiotic, thyroglobulin peptide VIFDANAPVAVR (1270.7 g/mol) and the ubiquitin protein (8.5 kDa) were used to highlight the versatility of the system for a range of compound types and molecular masses. Pre-defined workflows in SCIEX OS software allow the user to choose a small molecule, peptide, intact protein or glycopeptide workflow to obtain the best quality data. The pre-defined workflows allowed for subtle adjustments when analyzing the 3 different analyte types.
The system can process 384- or 1536-well plates at rates of up to 1 sample per second and users can opt to run in wide peak mode to obtain more scans of the samples in a batch. In wide peak mode, the user-defined amount of sample is constantly ejected over a user-defined time. For example, 100 nL of sample can be ejected at 10 Hz for 6.5 seconds. Wide peak mode ejections are like syringe infusions but can be automated and used for high-throughput batch analysis.
In conjunction with the Biomek i7 series liquid handler, we were able to determine the optimal and suboptimal buffers and LLOQs for dextromethorphan, a thyroglobulin peptide and ubiquitin in 8 different buffer types in approximately 26 minutes.
Methods
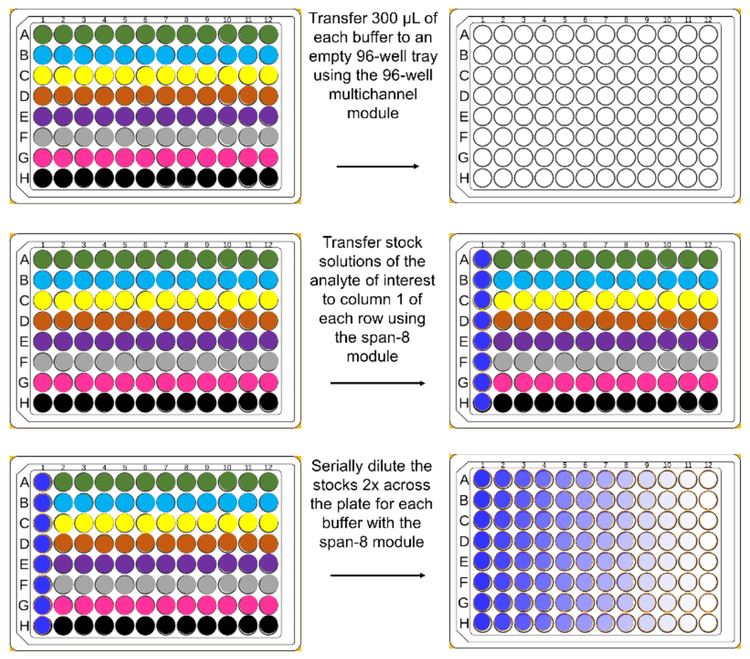
Sample preparation: A total of 8 different buffers (Table 1) were transferred to a 96-well plate and a serial dilution of the analyte of interest was performed by the Biomek i7 series liquid handler (Figure 2). For dextromethorphan and thyroglobulin peptide, stock concentrations of 10,000 ng/mL were placed on the board of the Biomek i7 series liquid handler for dilution to 2,000 ng/mL. The 2,000 ng/mL samples were then serially diluted to 0.977 ng/mL by the Biomek i7 series liquid handler. For ubiquitin, a 1,000 µg/mL sample was serially diluted by the Biomek i7 series liquid handler.

Concentrations of dextromethorphan and the thyroglobulin peptide in the plate wells ranged from 0.813 ng/mL to 833 ng/mL across 11 different columns. A column containing 1,666 ng/mL of dextromethorphan and the thyroglobulin peptide was not analyzed due to saturation at that concentration. Concentrations of ubiquitin ranged from 406 ng/mL to 417 µg/mL across 11 different columns.
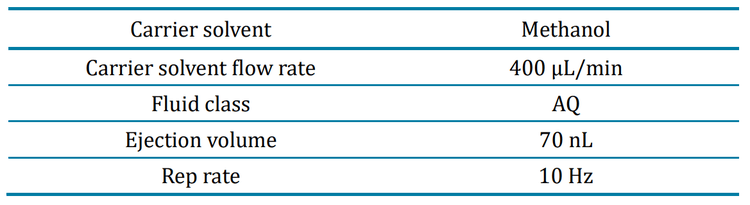
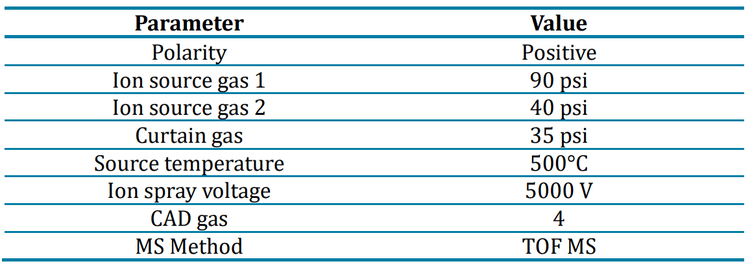
Acoustic ejection (dextromethorphan and thyroglobulin): Methanol, with no modifier to influence the buffer performance, was chosen as the carrier solvent for the dextromethorphan and thyroglobulin experiments (Table 2). A reference acoustic ejection method was performed in standard peak mode and was also analyzed for comparison purposes.

Buffer influence on ionization
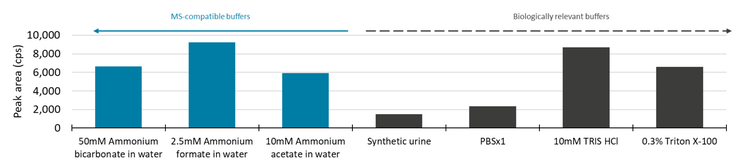
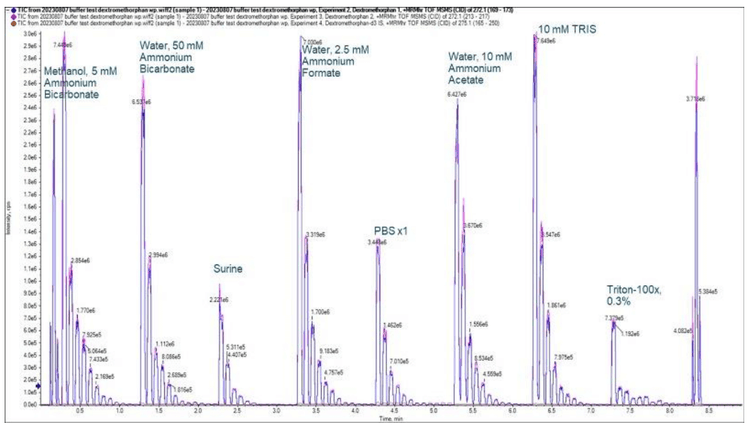
Upon visual analysis using the Explorer module in SCIEX OS software, it was observed that each different buffer produced a unique response for the 2 dextromethorphan transitions. It was discovered that 2.5mM ammonium formate in water was the buffer in which dextromethorphan produced the highest instrument response at a concentration of 0.813 ng/mL. The negative control buffer, 5mM ammonium bicarbonate in methanol, produced the weakest instrument performance with dextromethorphan at 0.813 ng/mL due to ejection incompatibility with this fluid class (Figure 1).
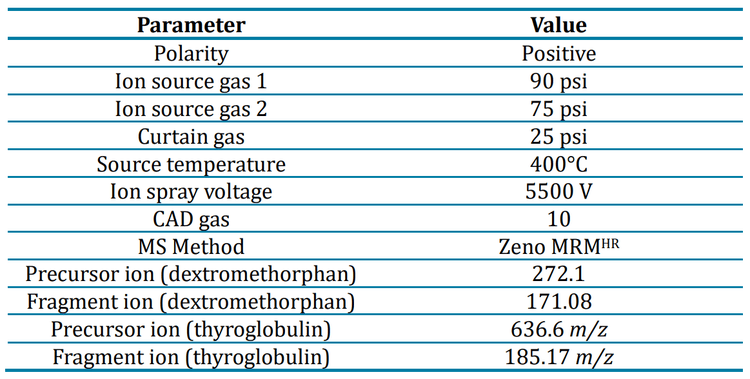
The concentration curve was visualized and an estimation of the LLOQ was determined to select which biologically relevant buffer was acceptable for the MS analysis. We analyzed a narrow product ion range with the Zeno MRMHR scan to limit mass interference with the peaks observed for dextromethorphan and dextromethorphan-d3. Although each buffer yielded differing instrument responses for dextromethorphan, a peak was produced at 0.813 ng/mL in each buffer using the wide peak acoustic ejection method. In standard peak mode, a signal for dextromethorphan was not observed in some of the buffers at 0.813 ng/mL.
The rapid nature of the Echo® MS+ system coupled with the ZenoTOF 7600+ system was leveraged to quickly screen for optimal buffers in less than 8 minutes. The Zeno MRMHR scan, operating with a narrow product ion range, yielded concentration curves even in biological buffers that typically challenge mass spectrometry analyses. A difference in instrument response between buffers was observed. However, each buffer appeared compatible with the Echo® MS+ system with the ZenoTOF 7600+ system operated in wide peak mode with the Zeno MRMHR scan (Figure 3).
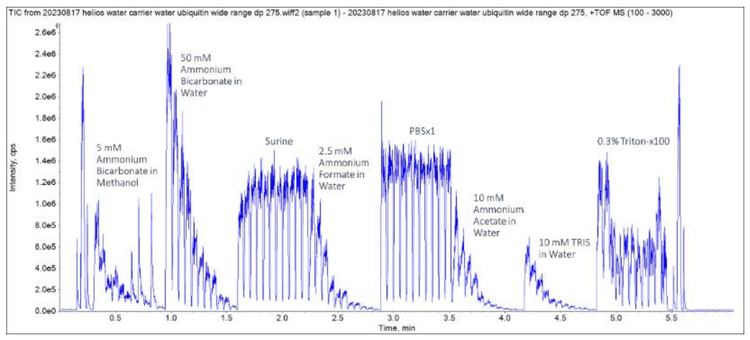
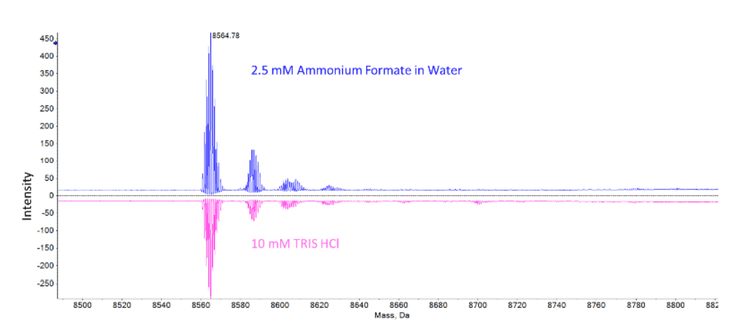
Close examination of the ubiquitin TOF MS peaks revealed that differing levels of protein signal depended on the buffer used (Figure 5).
Ubiquitin deconvolution was performed with an input range of 800 to 3000 m/z and with an isotope resolution of 30,000. At 814 ng/mL (95.8nM) of ubiquitin, reconstructed peaks were found above the baseline for ubiquitin in both the MS-compatible buffer of 2.5mM ammonium formate in water and the biological buffer of 10mM TRIS HCl (Figure 6). The intensity of the reconstructed ubiquitin was about 1.5 times lower in the 10mM TRIS HCl buffer but the suppression effects were overcome enough to produce a quantifiable signal.
Zeno MRMHR calibration curve
For method development, it is suggested that users identify candidate buffers first, then make serial dilutions of their analyte in the selected buffers. Analysis via the TOF MS scan is suitable for small molecules, peptides and proteins. However, the Zeno MRMHR scan provides a more sensitive and specific result and is best suited for small molecules and peptides.
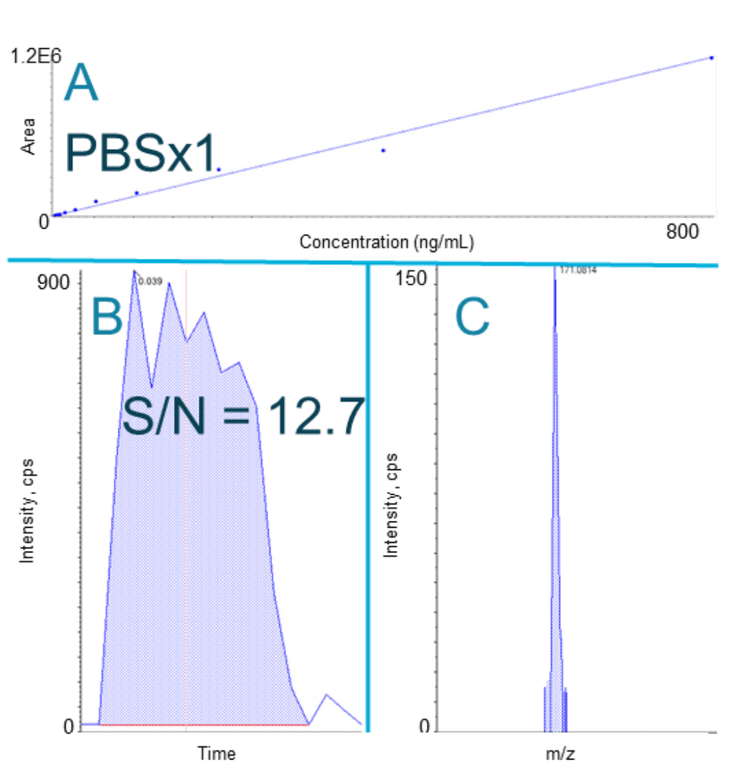
High-resolution quantitation with Zeno MRMHR greatly increased the specificity of analysis due to the selection of a high-resolution product ion.3 A high-resolution product ion, 171.0823 Da, was chosen for dextromethorphan quantitation. With a high-resolution product ion selected, quantitation was possible in all buffers, regardless of the degree of ion suppression.
Conclusion
- The 11-point serial dilution in 8 different buffers was performed on the Biomek i7 series liquid handler in 19 minutes
- Wide peak mode Zeno MRMHR scans for 88 samples were completed in less than 8 minutes
- Zeno MRMHR allowed for quantitation with a highly specific product ion which significantly reduced background noise across all buffers tested
- Zeno MRMHR quantitation showed a linear dynamic range spanning 3 orders of magnitude
- A mass reconstruction workflow can be used to quantify peptides and proteins in SCIEX OS software
References
- Guo, Y.; Forbush, M.; Covey, T.R.; Ghislain, L.; Liu, C. HighThroughput Analysis from Complex Matrices: Acoustic Ejection Mass Spectrometry from Phase-Separated Fluid Samples. Metabolites 2021, 11, 789.
- Zhang, H.; Liu, C.; Hua, W.; Ghislain L.P.; Liu, J.; Aschenbrenner, L.; Noell, S.; Dirico, K.J.; Lanyon, L.F.; Steppan, C.M.; West, M.; Arnold, D.W.; Covey T.R.; Datwani, S.S.; Troutman, M.D. Acoustic Ejection Mass Spectrometry for High-Throughput Analysis. Analytical Chemistry 2021, 93 (31), 10850-10861
- Di Lorenzo, R.A.; Rajski, L.; Stahl-Zeng, J.; Causon, J. Highly Sensitive Quantification and Selective Identification of Pesticides in Food with Zeno MRMHR. SCIEX technical note, RUO-MKT-02-13902-B