Methods
Sample preparation: All samples were extracted according to the standard QuEChERS citrate protocol using a Phenomenex roQ QuEChERS EN Method kit. Briefly, 10 g of homogenized food product and 10 mL of LC-MS grade acetonitrile were combined in a 50 mL centrifuge tube and shaken for one minute. To separate aqueous and acetonitrile layers, 4 g MgSO4, 1 g NaCl, 1 g trisodium citrate dihydrate and 0.5 g disodium hydrogencitrate sesquihydrate was added. The sample was shaken for an additional 1 minute and centrifuged for 5 min at 4000 rpm. A 5 mL aliquot of the acetonitrile layer was combined with 750 mg MgSO4 and 125 mg PSA in a 15 mL centrifuge tube for clean-up. The extract was shaken for 30 seconds and centrifuged for 5 min at 4000 rpm. A 200 µL aliquot of cleaned‑up extract was added to an LC vial diluted with 800 µL of mobile phase A for sample analysis for an overall 5x dilution factor.
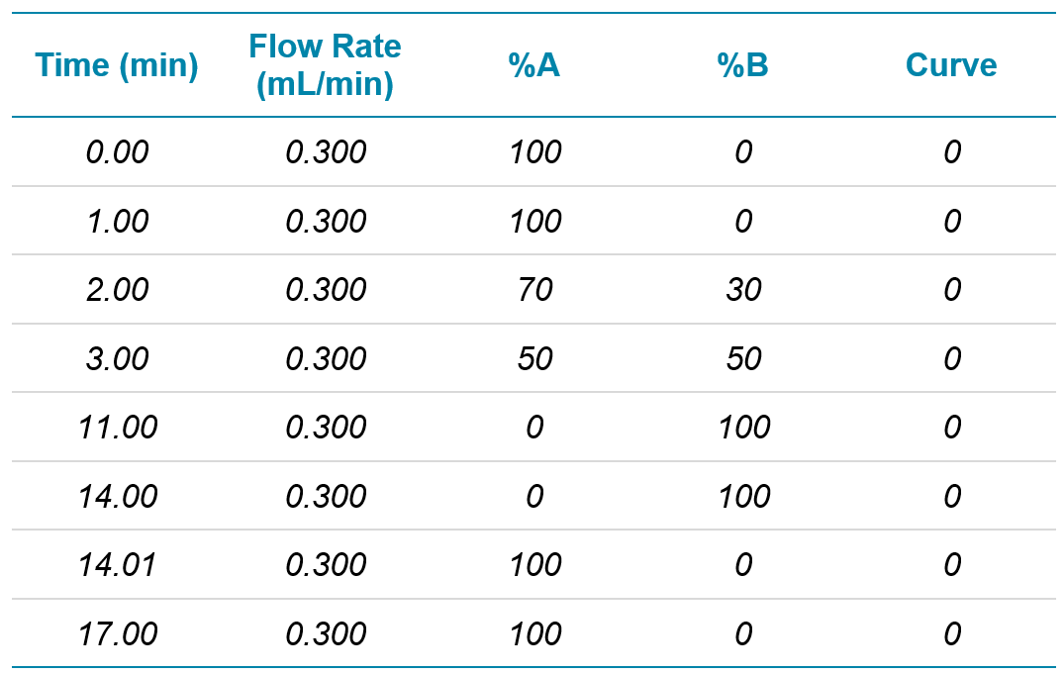
Chromatography: Analytes were separated on a polar-embedded reverse phase C8 column (2.1 x 150 mm, 1.8 µm) using a SCIEX ExionLC AD system. Separation was performed at a flow rate of 300 µL/min with a column temperature of 35ºC and an autosampler sample storage temperature of 5ºC. Mobile phase solvents were (A) 98:2 water/methanol and (B) 2:98 water/methanol, both with 0.1% formic acid and 5 mM ammonium formate. The gradient program can be seen in Table 1. Total runtime was 17 minutes.
Mass spectrometry: All compounds were analyzed using a SCIEX ZenoTOF 7600 system with scheduled Zeno MRMHR for optimal sensitivity. Source conditions can be observed in Table 2. Accurate mass precursor ions were scanned from 100-950 Da with an accumulation time of 100 ms, a declustering potential (DP) of 80 V and a collision energy (CE) of 10 V. Zeno MRMHR acquisition was retention time scheduled with a tolerance of ± 20 seconds. MS/MS data were acquired with DP = 80 V and compound optimized CE. Accumulation times for each compound were varied (minimum 10 ms) to maintain a total cycle time of 600 ms across the acquisition. Each MS/MS was acquired down to 50 Da to ensure all fragments were captured for identification.
Data processing: All data were processed with SCIEX OS software 2.0.1 using the Analytics module and MQ4 integration algorithm. The monoisotopic mass and two accurate mass fragments were extracted for each analyte with a 20 mDa window, with 1-point gaussian smoothing applied. Retention time thresholds for peak identification were set to ± 15 s. Quantitative and qualitative thresholds were set according to SANTE/12682/2019. Briefly, positive identifications were determined such that two fully overlapping extracted ion chromatograms had mass error < 5 ppm (< 1 mDa for masses below 200 Da) and S/N > 3 (or 5 points of consecutive signal in the absence of noise). Additionally, ion ratio thresholds were set according to the nominal mass requirement of ± 30% relative deviation from standards. Quantitatively, LOQs were set at the lowest standard giving average accuracy and precision within ± 20% across the n=6 replicates. Along with the SANTE guidelines, flagging rules were set for library match and theoretical isotope ratio match for easy filtering in SCIEX OS software using the conditions in Figure 2.
Sensitivity enhancement with Zeno MS/MS
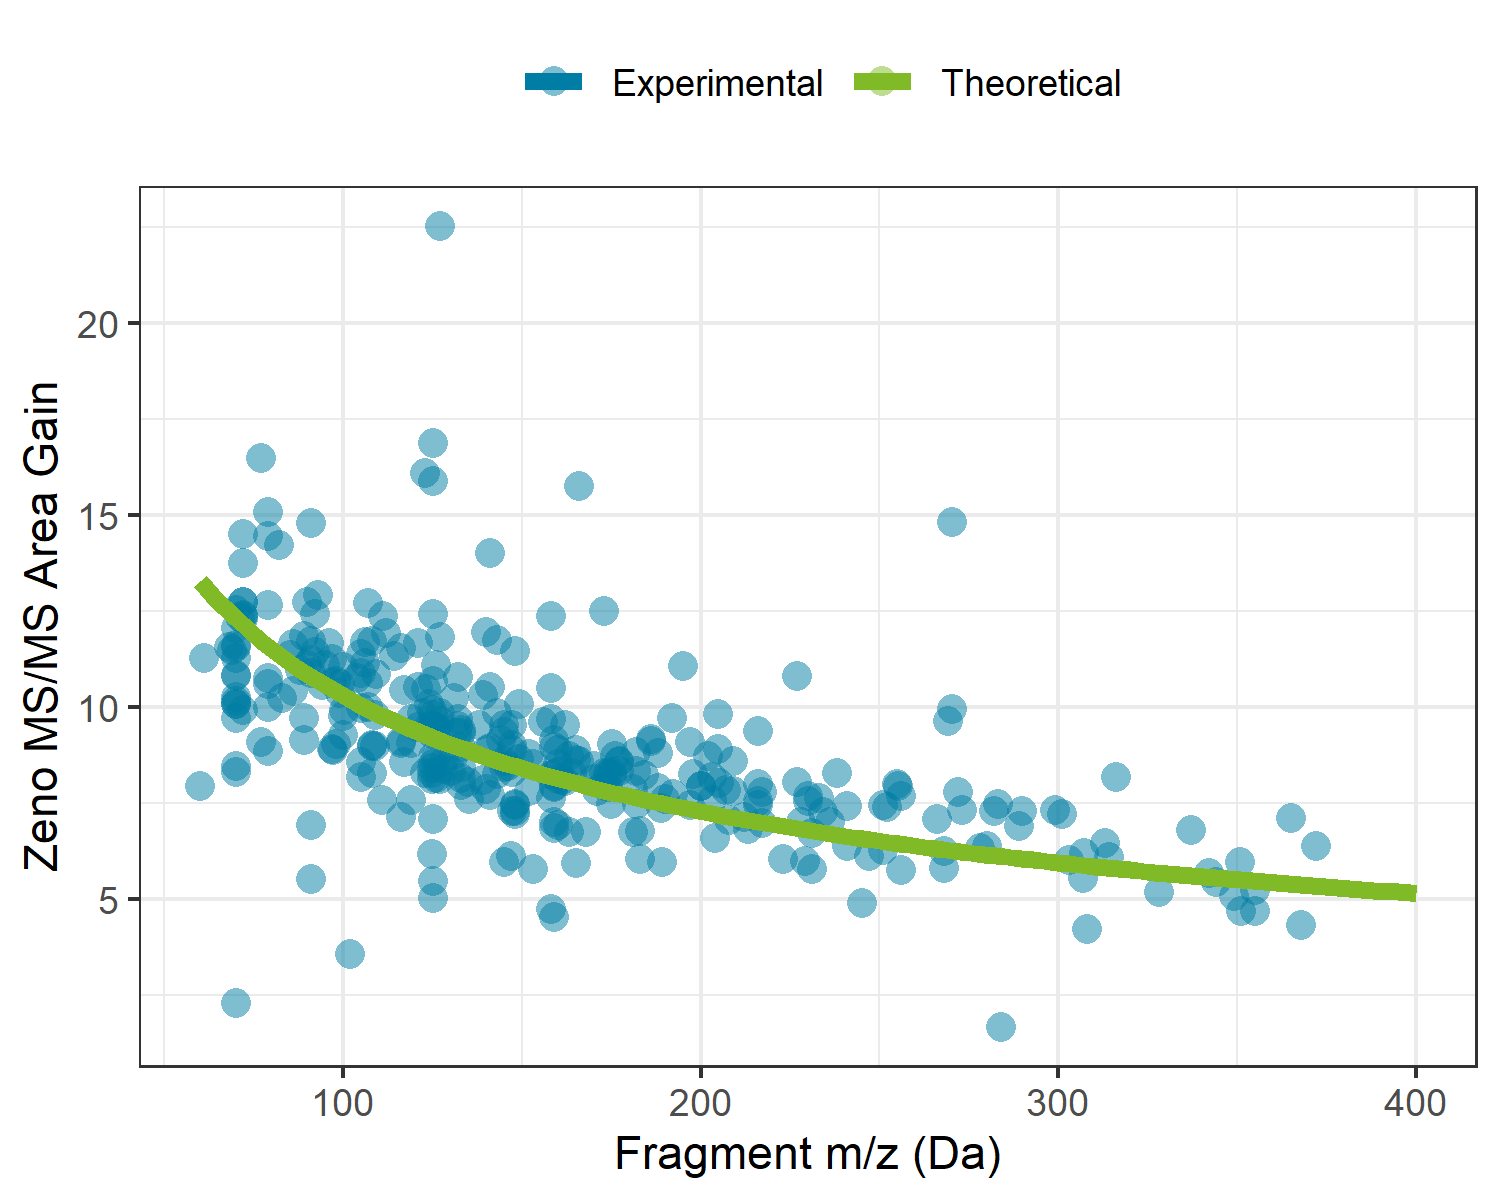
The use of the Zeno trap on the ZenoTOF 7600 system allows for >90% of duty cycle related losses to be recovered during MS/MS experiments across the entire mass range. With traditional orthogonal injection QTOF mass spectrometers, ion losses occur as a result of mating a continuous ion beam coming from the quadrupole ion guides with the pulsed nature of the TOF accelerator. To overcome this on the ZenoTOF 7600 system, a Zeno trap was added at the end of the Q2 collision cell assembly, where an ordered release of ions based on their potential energy allows for all ions to arrive at the TOF accelerator at the same time and location. For this reason, the sensitivity enhancements are both dependent on the upper limit of the MS/MS scan range and the mass of the fragment ion. Figure 1 shows the experimental gains experienced during this analysis overlaid with the theoretical gains based on the fragment masses and scan parameters used in this experiment. Here we can see that enabling the Zeno trap yields a minimum of 5x intensity gain, with gains up to 13x as fragment masses decrease.
With Zeno MS/MS, it is frequently the case that extracted ion chromatograms (XICs) show greater intensity compared to XICs from the precursor ion traces, as observed in Figure 3. This is a result of comparing an MS/MS spectrum with >90% duty cycle to an MS spectrum with a typical duty cycle of 5-25%. Improvements can also be observed in MS/MS spectral quality for greater confidence during library confirmation. Since duty cycle improvements are only a function of scan range and fragment mass, these gains are observed across all molecule types, independent of chemistry and ionization efficiency. Further, since the selectivity afforded by accurate mass MS/MS analysis often results in little to no chemical noise, the gains in signal-to-noise approach the gains observed in raw signal (Figure 4).
LLOQ assessment in olive oil
To assess the in-matrix quantitative performance of the ZenoTOF 7600 system, n=6 replicates of a matrix matched curve was constructed in QuEChERS extracted olive oil ranging from 0.10 µg/kg to 0.10 mg/kg. Incorporating the 5x dilution during sample preparation, in-vial concentrations ranged from 0.02 to 20 ng/mL. The curve was assessed for linearity, accuracy and precision, mass accuracy and ion ratios according to SANTE/12862/2019 guidelines. Figure 5 shows the distribution of in-matrix LLOQs determined for the quantified pesticides. It can be observed that nearly all quantified pesticides have an LLOQ below 0.001 mg/kg, with the majority with LLOQs falling between 0.0002 and 0.0005 mg/kg. Also, all quantified pesticides showed LLOQs at or below 0.005 mg/kg, meaning that the ZenoTOF 7600 system has enough sensitivity to meet nearly any global pesticide residue regulation, as most maximum residue limits are set as low as 0.010 mg/kg. Additionally, the use of accurate mass fragment ions for quantification cuts through nearly all noise and interferences, simplifying peak detection and integration to eliminate the need for manual peak review.
At the calculated LLOQs, the quality of qualitative information acquired remains consistent. Figure 6 highlights three example pesticides at their respective LLOQs. In each case, the fragment XICs (left, filled blue traces) show ample S/N for detection and improved S/N over the precursor XICs (pink traces). The ion ratio thresholds, adopted from the SANTE nominal mass requirement of ± 30%, are maintained at these low concentrations. With the additional sensitivity, mass error on fragments can also be maintained due to the improved ion statistics during detection, as well as the generation of clear and unambiguous MS/MS spectra for library confirmations, even in dirty matrices.
Comparison of organic and non-organic produce using Zeno MRMHR
The developed quantitative method was also applied to a variety of fruits and vegetables in order to compare the relative pesticide burden between produce that was traditionally farmed and produce purchased from an organic grocer. The twelve fruits and vegetables chosen were from the Environmental Working Group’s “Dirty Dozen” list, an annual list of produce on which pesticides are most frequently detected.
Comparing the sum total of pesticides detected for each specific food, traditionally farmed produce showed a larger total pesticide burden, with the exception of celery, grapes and potatoes. For these exceptions, the organic produce showed a larger total pesticide concentration (Figure 7). For the non-organic produce, pears, peaches and nectarines showed the largest total concentration, whereas potatoes showed the largest sum concentration for the organic produce and for produce overall. Sum total concentrations ranged from less than 0.001 mg/kg to greater than 7 mg/kg. Comparing the aggregate concentration distribution for each pesticide hit between all organic and non-organic produce, the organic produce showed a slightly lower average concentration, as seen in Figure 8.
Looking at the individual pesticide hits in Figure 9, a few key observations can be made. First, the most contaminated food, organic potatoes, was a result of a single hit: chlorpropham, a germination inhibitor commonly applied to potato crops. Second, when the same pesticide was detected in both organic and non-organic produce, the concentration was higher in the organic produce, with the exception of pyrimethanil in pears. Third, although concentrations were detected as high as mg/kg levels, each hit was below the maximum residue levels set by Health Canada, as all produce was purchased in Canada. Overall, the differences between the organic and non-organic produce were not as delineated as most advertisements and product packaging for organic products claim. The levels detected are far below any concentration that may trigger acute or chronic health effects.

 Click to enlarge
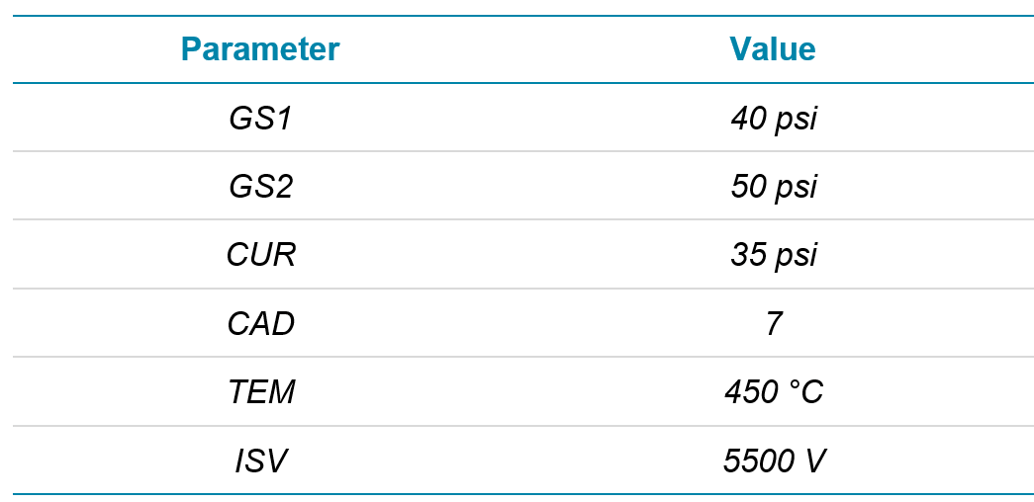 Click to enlarge
 Click to enlarge
 Click to enlarge
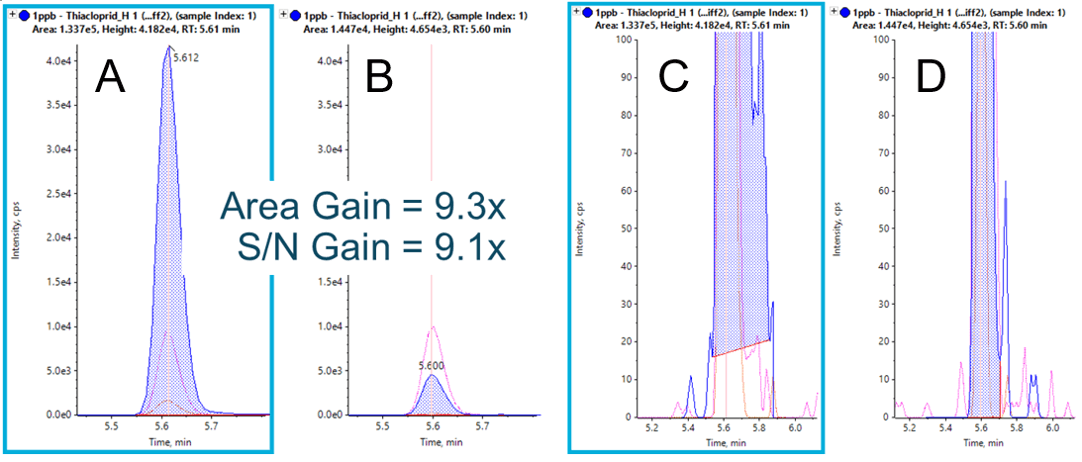 Click to enlarge
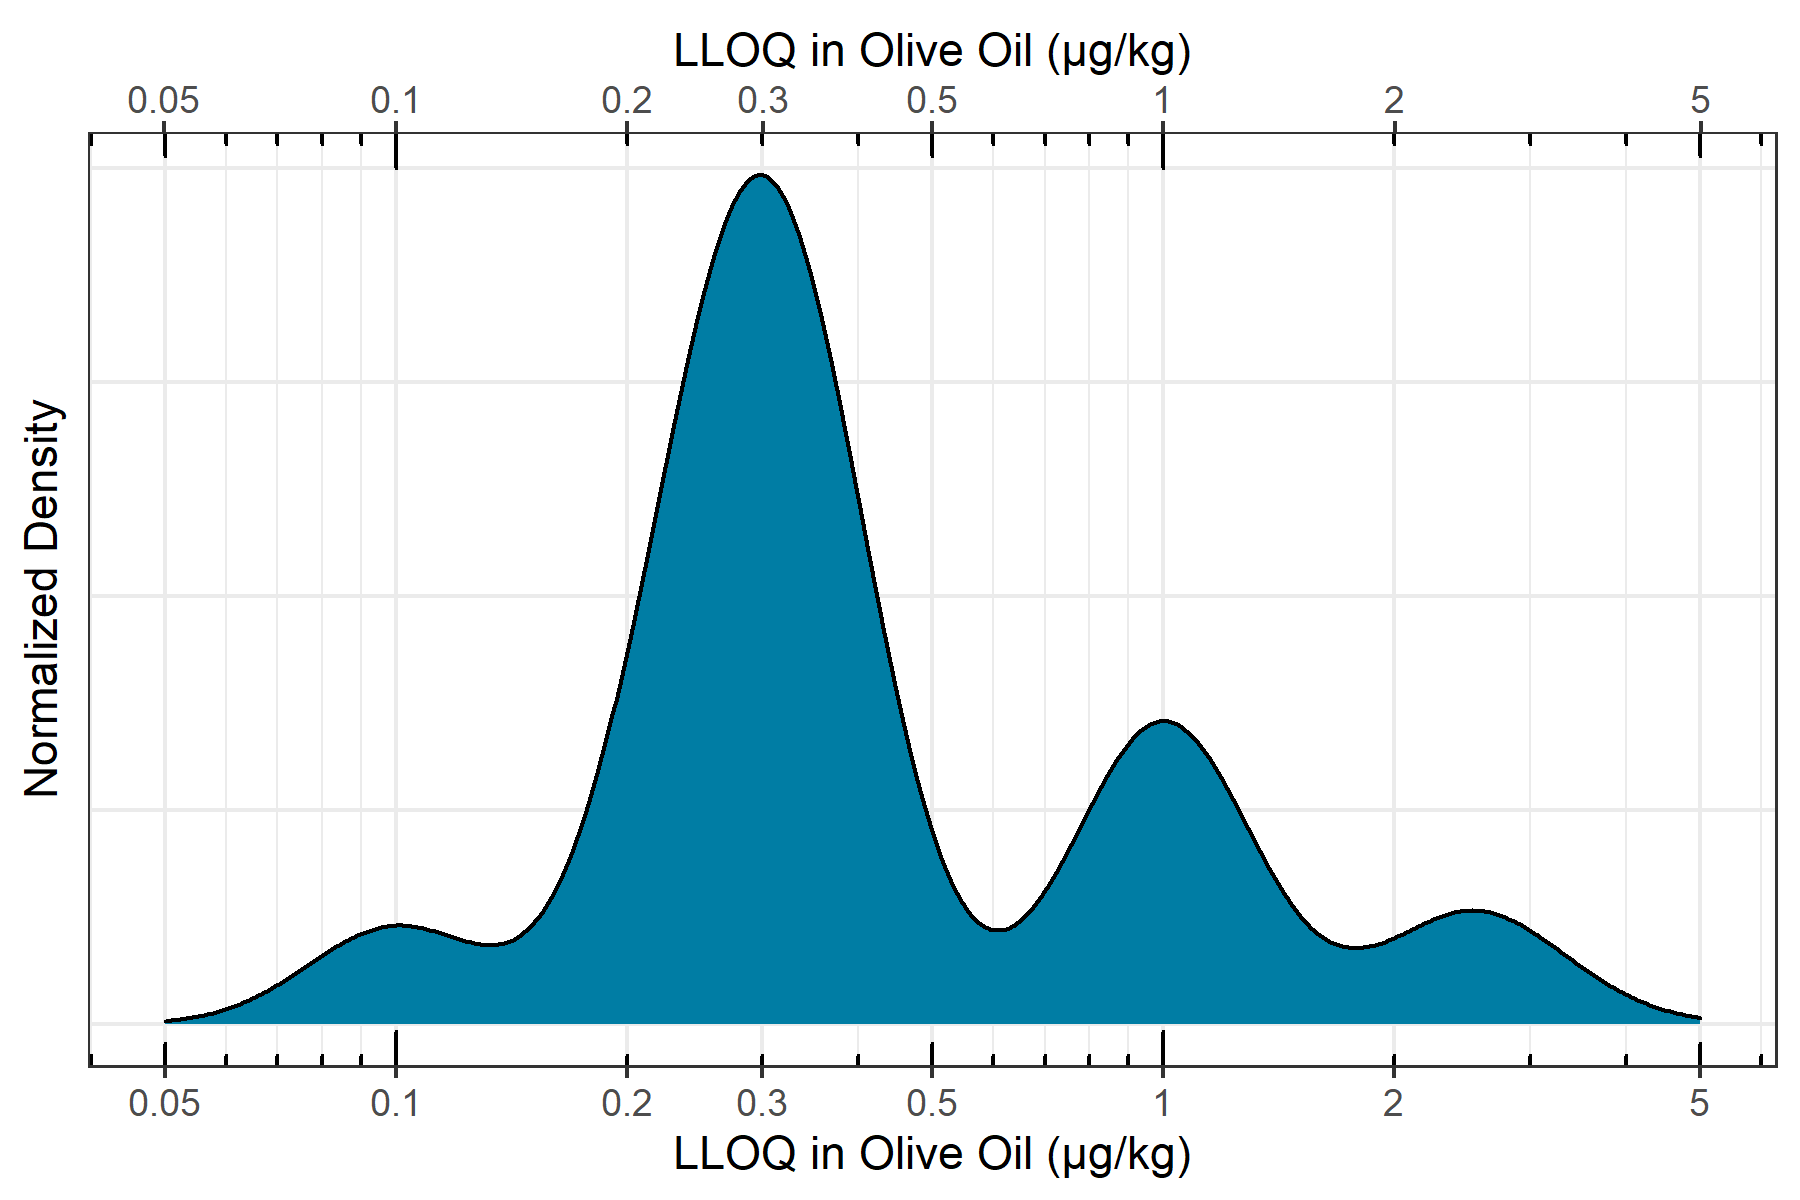 Click to enlarge
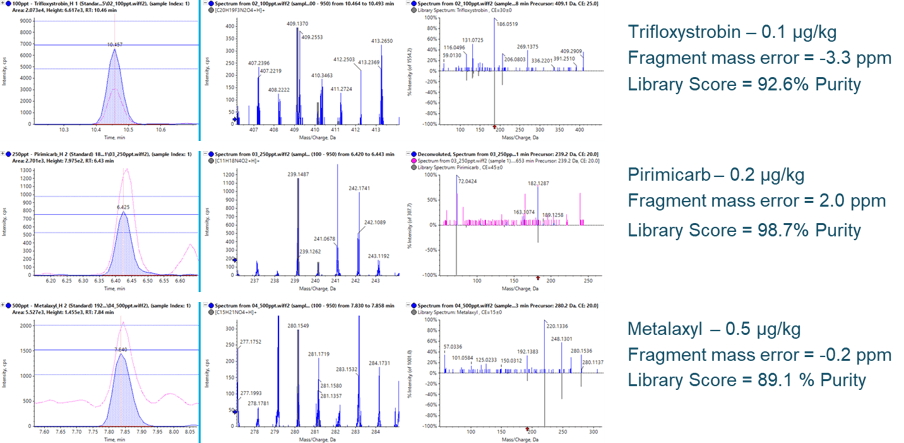 Click to enlarge
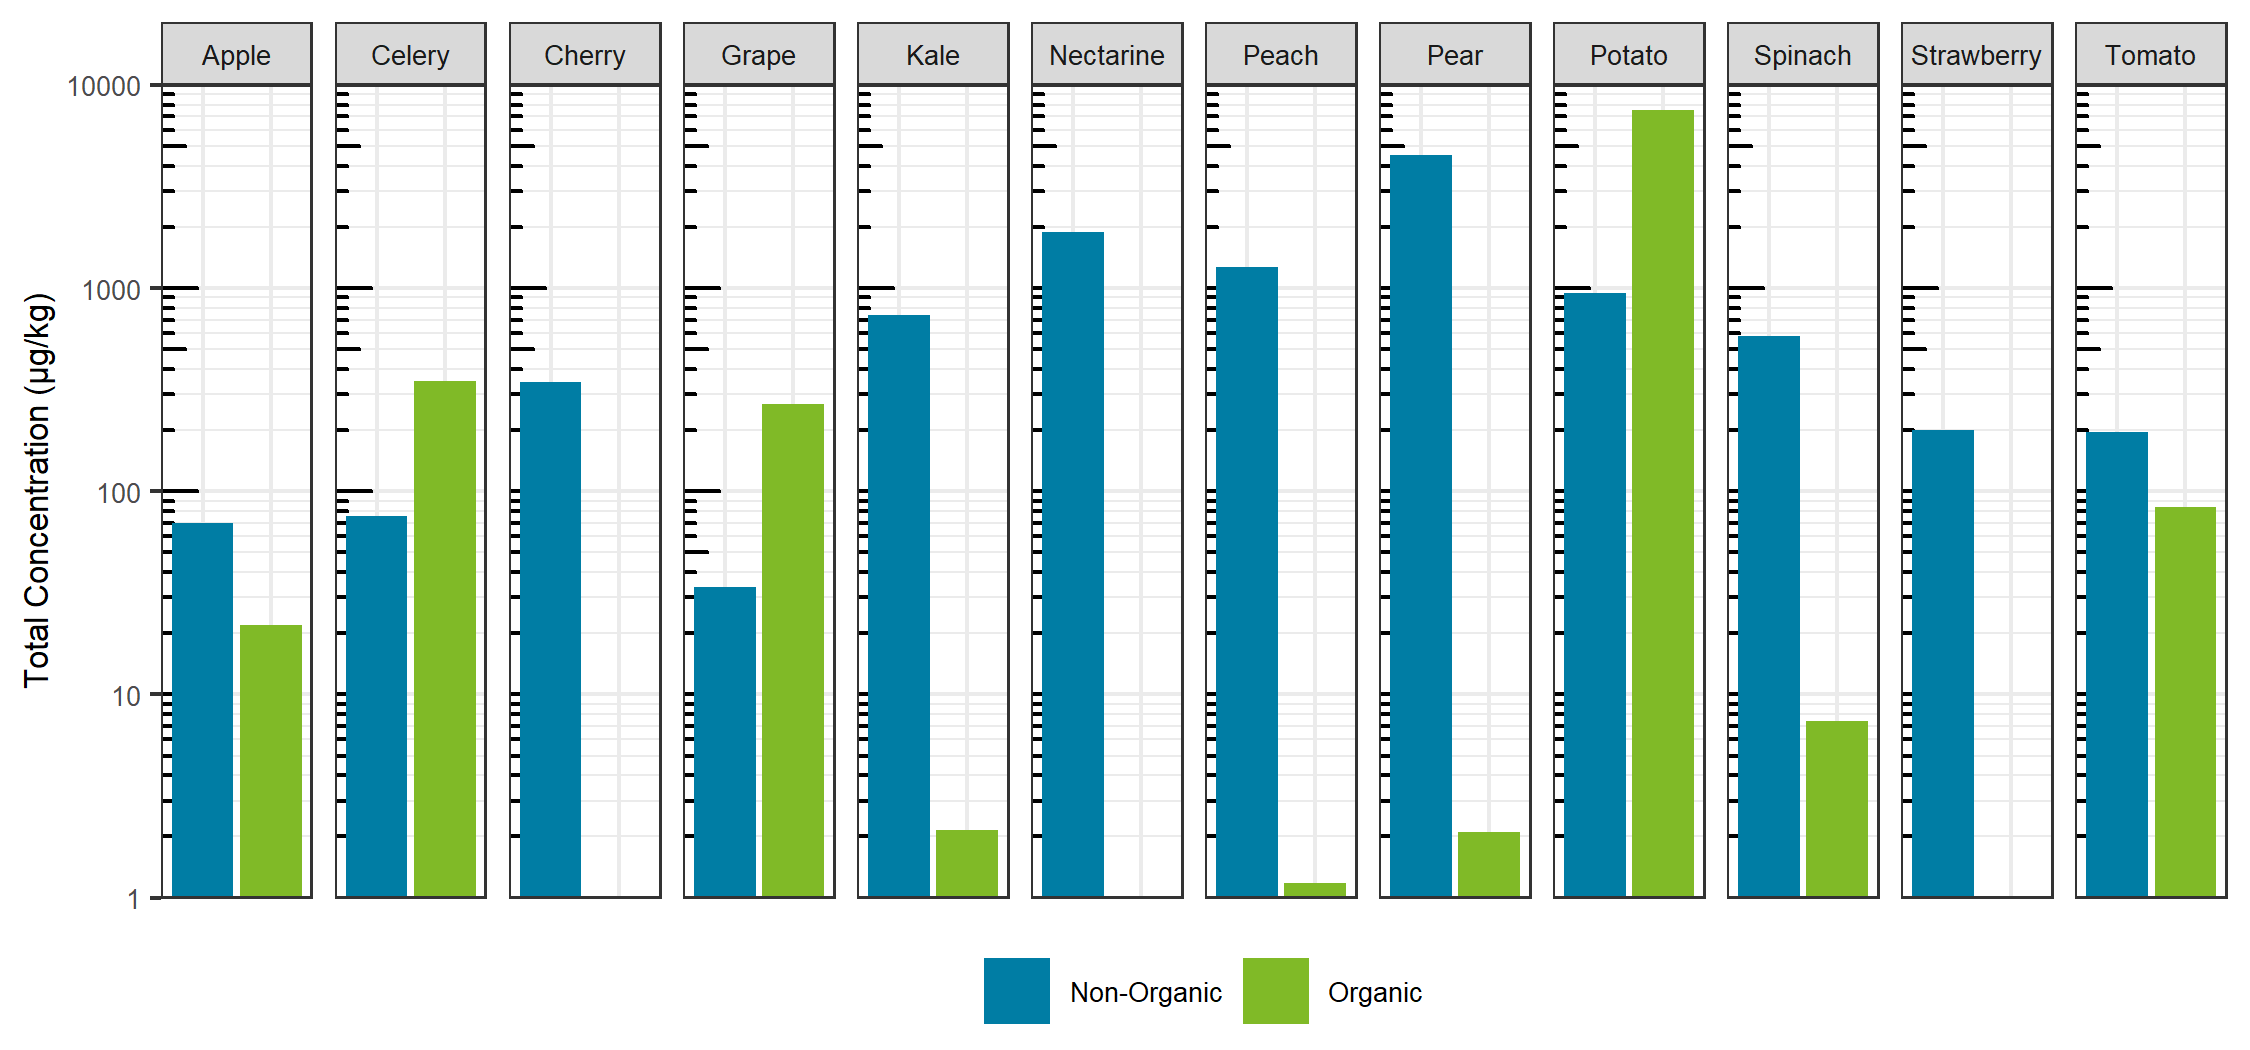 Click to enlarge
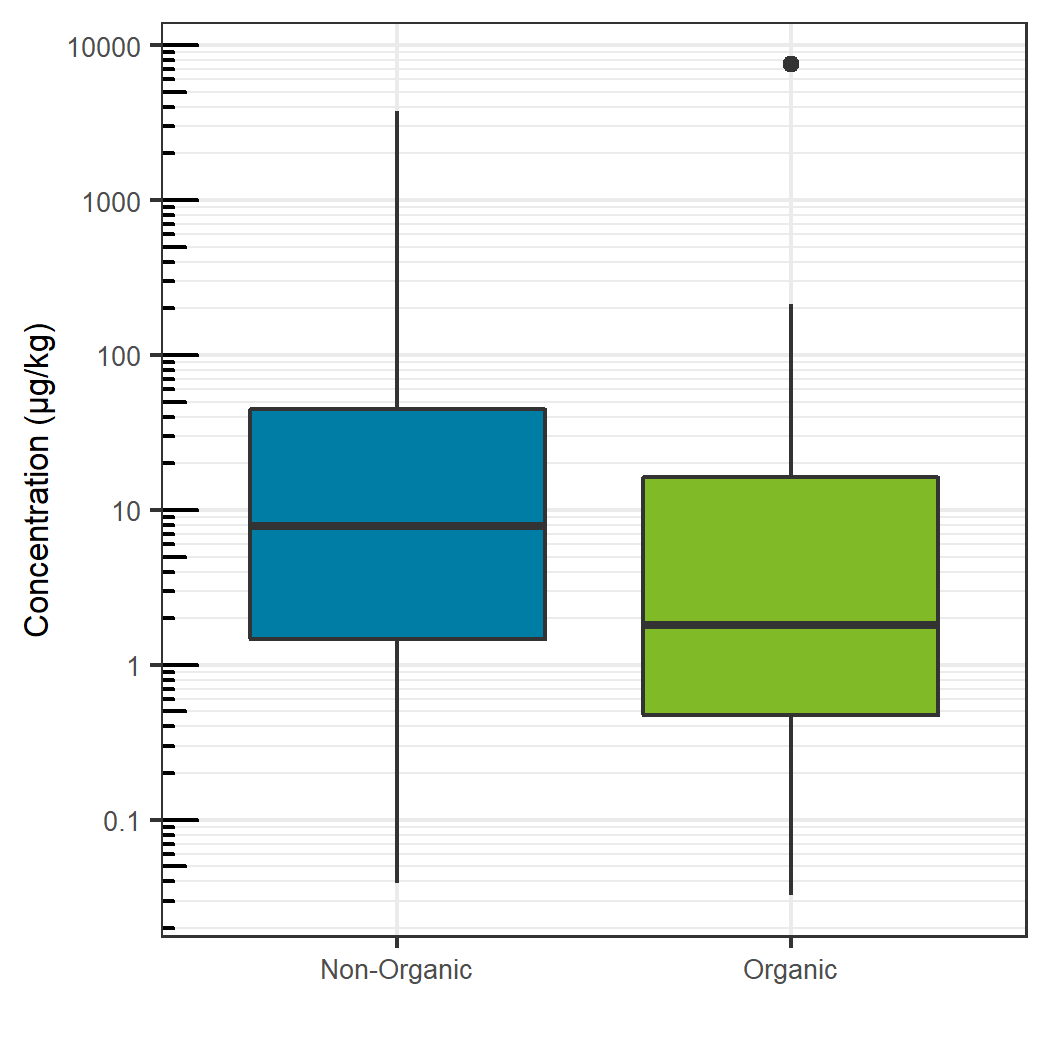 Click to enlarge
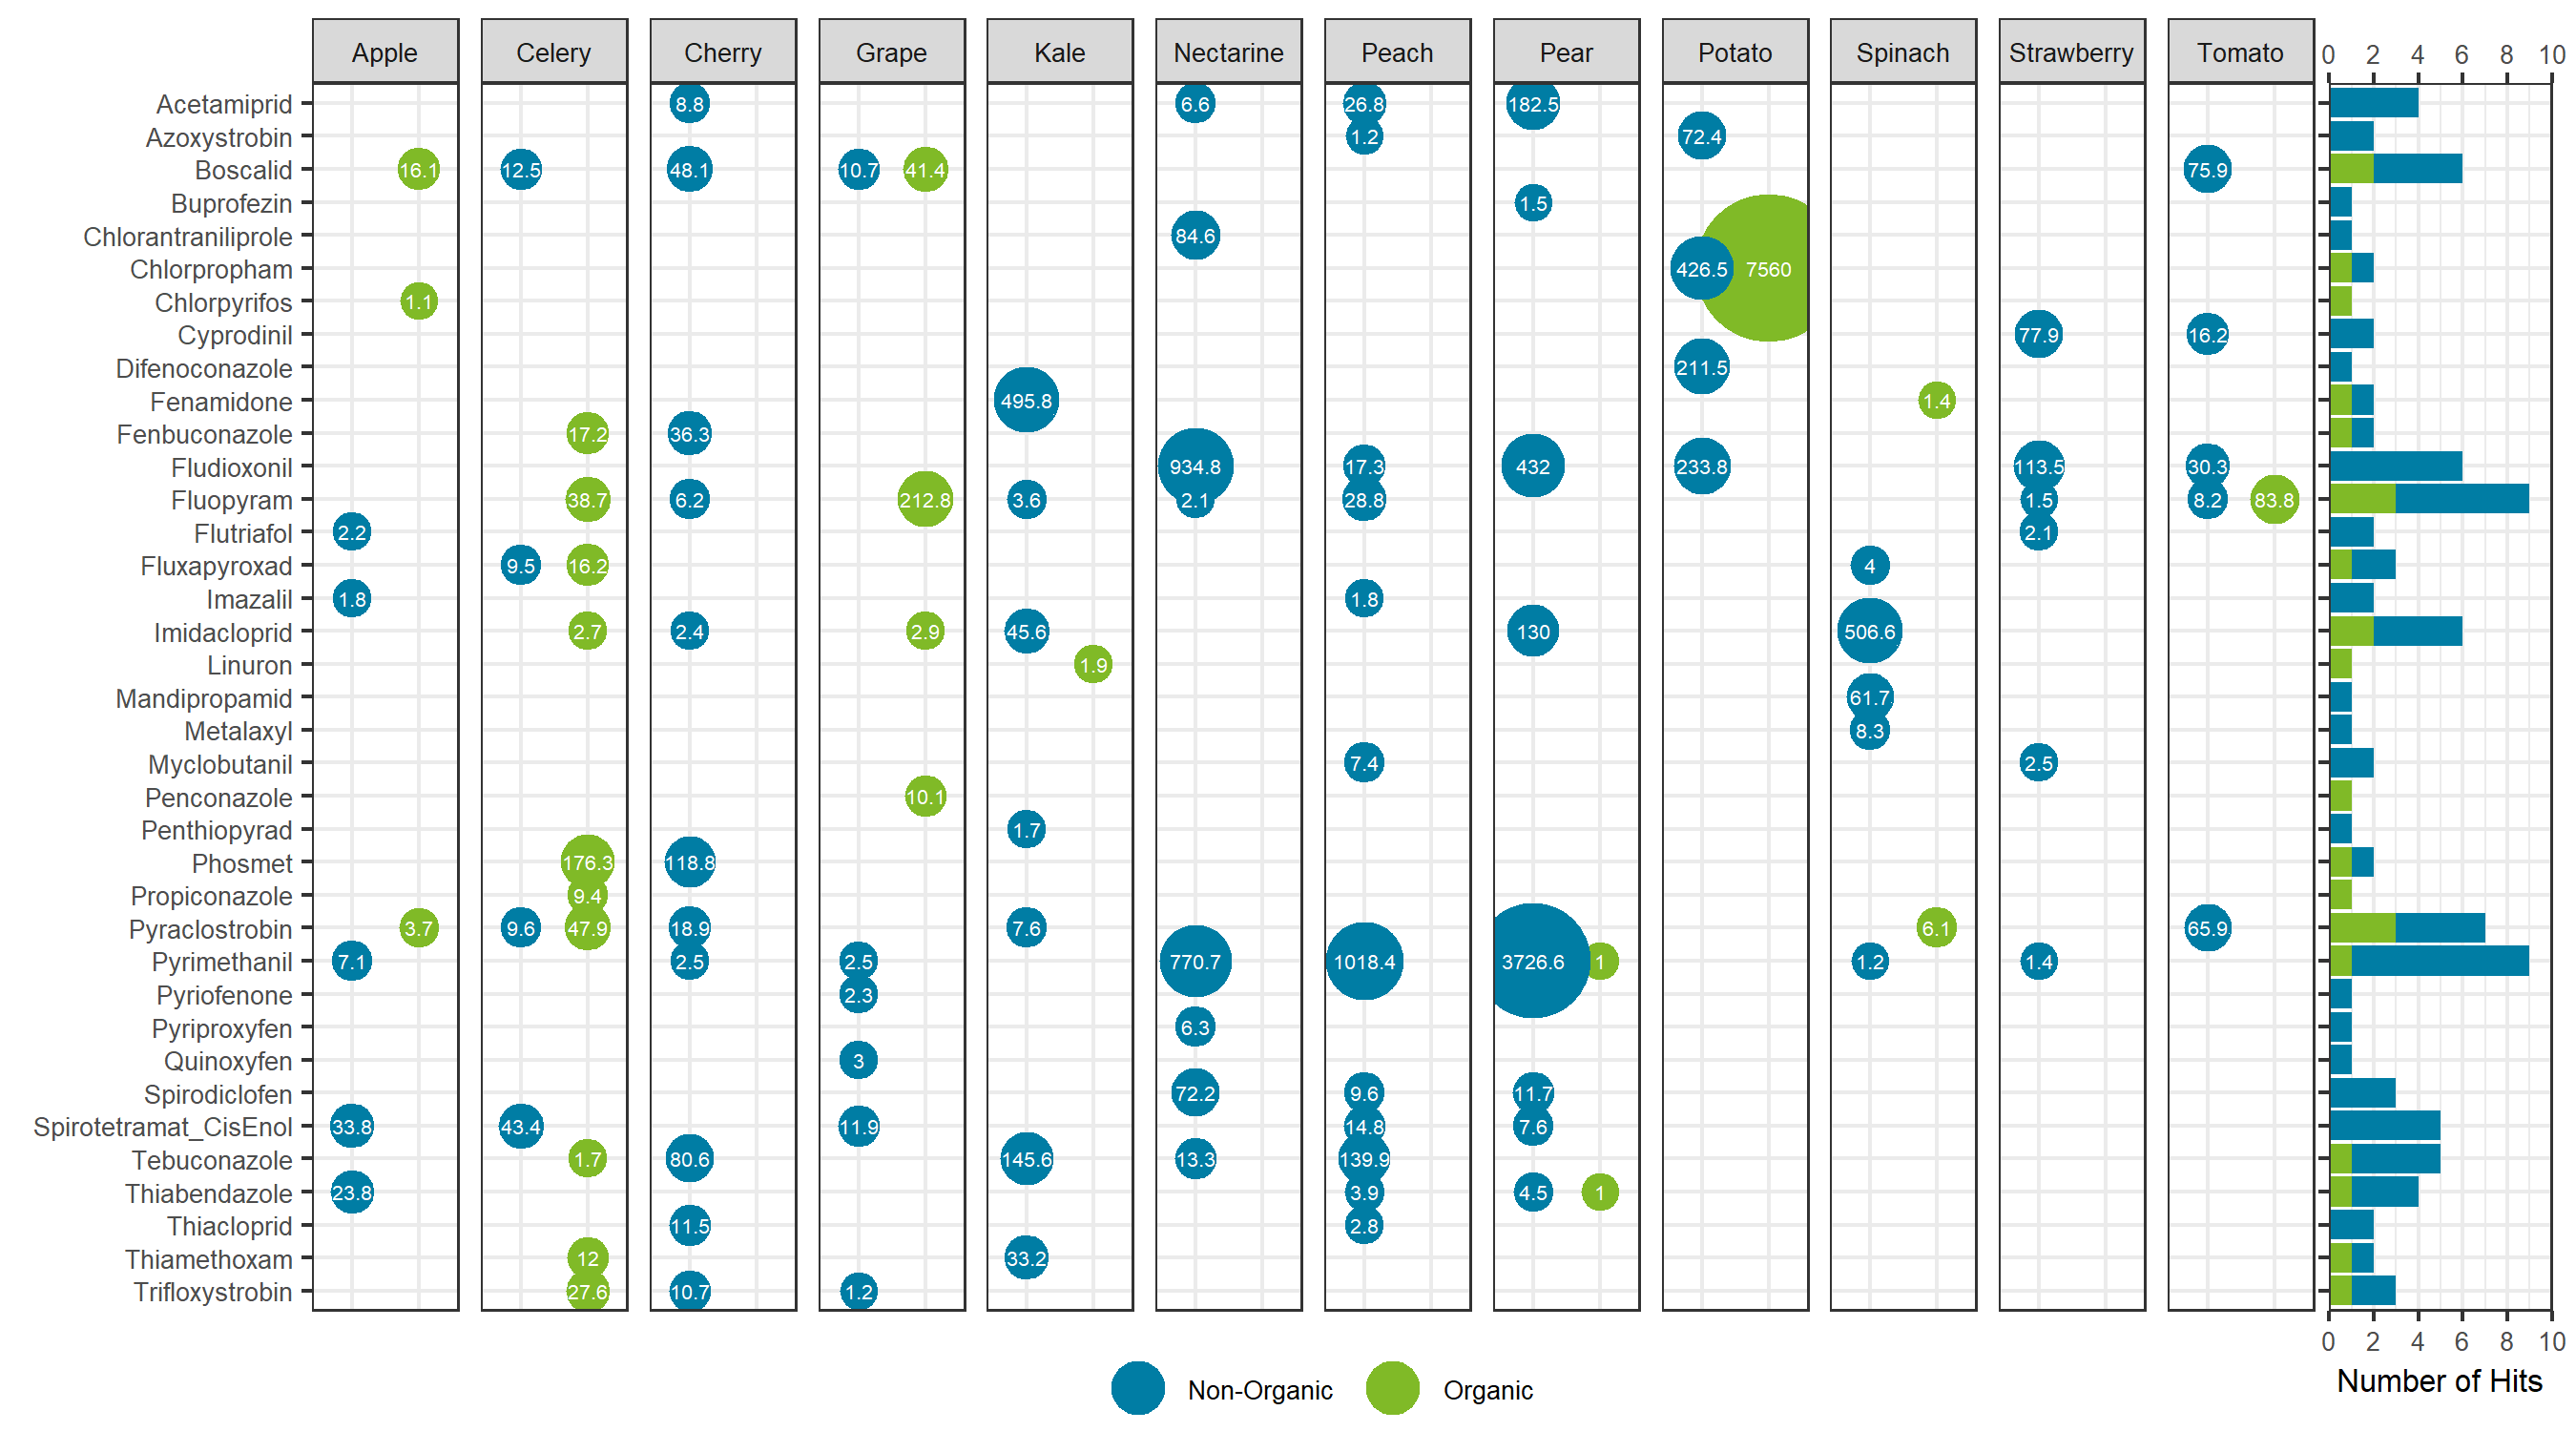 Click to enlarge