Multiple approaches for routine early-stage bioanalytical quantification
Using the Zeno trap for high sensitivity on the ZenoTOF 7600 system
Rolf Kern
SCIEX, USA
Abstract
In early stage bioanalytical labs, the diversity of compounds assessed and the high volume of samples to be analyzed can mean that spending a lot of time optimizing quantification methods is a luxury a routine lab cannot afford. Therefore having analytical tools the can provide flexibility of workflows is desirable. Here a number of quantification workflows on the ZenoTOF 7600 system have been compared for their sensitivity, selective and ease of implementation.
Introduction
Triple-quadrupole mass spectrometers have been the pharmaceutical industry’s dominant platform for the quantification of small molecules in complex matrices. They have been commercially available for many years, are affordable, are highly sensitive and are able to quantify over a wide dynamic range, which makes them a fit-for-purpose tool for this universally important application. Recently, there has been increasing interest in the application of accurate mass systems for these workflows. However, the sensitivity of these platforms is often insufficient for meeting most routine needs. With the introduction of the ZenoTOF 7600 system, the sensitivity gains enabled using the Zeno trap1 bring accurate mass quantification to a level where routine use for early-stage bioanalytical work is now feasible.
MRMHR methods, which closely parallel triple quadrupole MRM methods, will generally be the most sensitive approaches for routine quantification. But a distinct advantage of quadrupole time-of-flight (TOF) systems is the flexibility to generate good quantitative data using different types of methods. Here, quantitative data will be shown for 2 model small molecule compounds in protein-precipitated rat plasma (Figure 1). Generic sample prep and chromatography is used to mimic the routine nature of an early-stage discovery bioanalytical laboratory, where scientists may not always have time to optimize conditions for each new molecule that requires analysis. In addition to MRMHR, sensitivity and linearity are shown and discussed for alternative mass spectrometry methods—including TOF MS, Zeno SIM, Zeno MRMHR and Zeno EAD MRMHR—to show how the flexibility of the platform can be used to approach quantification when different workflow needs arise.
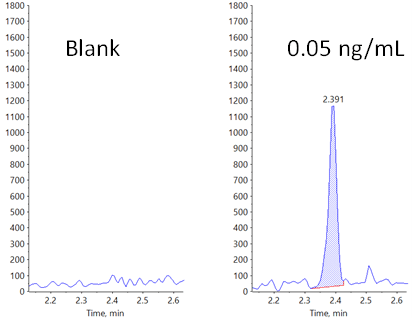
Figure 1. Lower limit of quantification (LLOQ) for carbamazepine in rat plasma. Extracted ion chromatograms (XICs) obtained at the LLOQ for carbamazepine using the Zeno MRMHR workflow. Plasma blank is shown on the left, and the standard in plasma at 0.05 ng/mL is shown on the right.
Key features of the ZenoTOF 7600 system for routine bioanalytical quantification
- Zeno trap technology prevents the duty-cycle-related ion losses that occur when merging the continuous transmission of quadrupole separation with the pulse-based transmission of a time-of-flight detector, which enables a 4 to 25x sensitivity improvement for MS/MS workflows.1
- The system has greater than 5 orders of inter-scan linear dynamic range and 4 orders of intra-scan linear dynamic range in both MS and MS/MS modes.
- Reagent-free, quantitative, high-efficiency electron activated dissociation (EAD) fragmentation offers alternative fragmentation for both small and large molecule workflows.
Methods
Sample preparation: A generic acetonitrile-based protein precipitation was used to generate the standard curve for this study. A larger than typical plasma volume of 200 µL was prepared to allow for several repeat injections using different analytical methods.
Small Molecule Pharma QC mix (SCIEX, P/N 5056817), which is a mixture of several compounds in methanol at 200 µg/mL, was diluted to 5 µg/mL in methanol. Using this as the highest concentration, working standards were serially diluted to 1 ng/mL in methanol. Next, 10 µL of each working standard solution was added to 200 µL aliquots of K2EDTA rat plasma (BioIVT) in 2 mL Eppendorf tubes, which were then briefly vortexed to homogenize, and 10 µL of 200 ng/mL d10 carbamazepine (Sigma) was added as an internal standard. To precipitate plasma proteins, 600 µL of acetonitrile was added, and then to pellet the precipitate, vortex mixing and centrifugation was performed at 15,000 rpm for 15 min. The supernatant was transferred to clean Eppendorf tubes, and samples were evaporated to near dryness under N2. Samples were reconstituted with 200 µL 5% methanol in water and transferred to 2 mL HPLC vials fitted with 250 mL inserts for analysis.
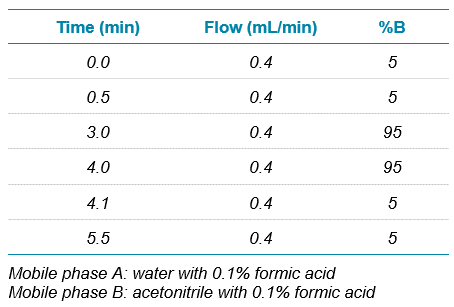
Chromatography: A generic, non-optimized short HPLC gradient was used for analysis, which was run on a SCIEX ExionLC AD system with a Phenomenex Kinetex C18, 2.6 µm particle, 50 x 3 mm column (P/N 00B-4462-Y0). A 5 µL injection volume was used, and the LC gradient is shown in Table 1.
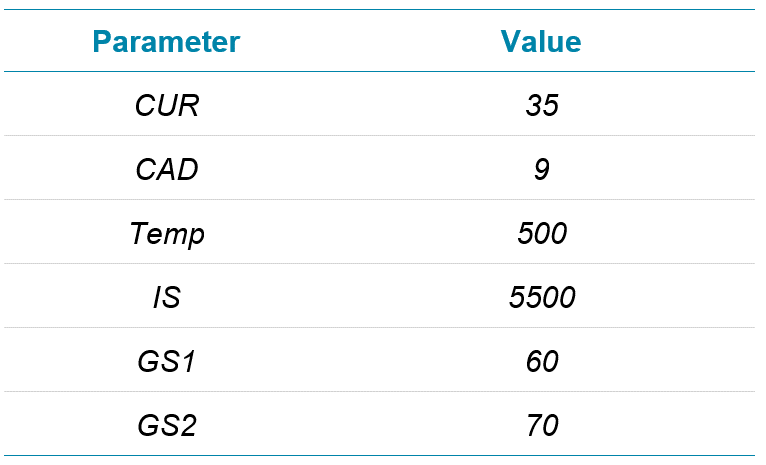
Mass spectrometry: For this study, 4 methods—TOF MS, Zeno SIM, Zeno MRMHR and Zeno EAD MRMHR—were used on the ZenoTOF 7600 system, the details of which are shared along with a discussion of the data generated for each. To make data comparisons between them as relevant as possible, they will be discussed in 2 groups: TOF MS is compared with Zeno SIM and with Zeno MRMHR, and then Zeno MRMHR is compared with Zeno EAD MRMHR. The source settings, listed in Table 2, were common to all methods.
Data processing: All data were acquired and processed in SCIEX OS software 2.0.
Table 1. HPLC gradient.
Table 2. Source settings used on the ZenoTOF 7600 system.
Quantification workflows
The goal of this project was to investigate different approaches for the routine analysis of bioanalytical samples in an early-stage small molecule pharmaceutical research environment. The flexibility of the ZenoTOF 7600 system gives users access to multiple types of methods that can be used for quantification.
TOF MS: With this method, Q1 is operated in pass-through mode and no energy is applied through Q2 to ensure no fragmentation. The full mass range is then analyzed in the TOF analyzer. This is the simplest type of acquisition and requires no method development, but it does not allow for the sensitivity gains afforded by the Zeno trap or provide the added specificity enabled when specific fragments of a precursor ion are analyzed.
Zeno SIM: This method uses Q1 isolation to select the parent m/z of interest and operates Q2 at a low collision energy, effectively setting it to pass-through mode with no fragmentation. However, because this is technically an MS/MS mode, the Zeno trap can be used for added sensitivity. The method does not require optimization of the collision energy, but like TOF MS, it does not provide the added specificity of analyzing fragment ions.
Zeno MRMHR: This is generally regarded as the most sensitive and selective acquisition mode for quantification on the ZenoTOF 7600 system. A parent mass is isolated in Q1 and fragmented in Q2, and the products are analyzed in the TOF analyzer. Here, the added sensitivity of the Zeno trap can be leveraged while taking advantage of the added specificity of analyzing fragment ions. For optimal sensitivity, the collision energy should be tuned on a per-compound basis.
Zeno EAD MRMHR: This method is a close analogue to Zeno MRMHR, but with fragmentation occurring in the EAD cell and not in the Q2 collision cell. This method also uses the Zeno trap for added sensitivity and uses the orthogonal fragmentation mechanism (EAD) rather than the traditional collisional induced dissociation (CID) used with Zeno MRMHR. In most small molecule quantitative examples, this will be less sensitive than Zeno MRMHR, but could prove useful for difficult-to-fragment molecules. For optimal sensitivity, the EAD filament current and voltage should be tuned on a per-compound basis.
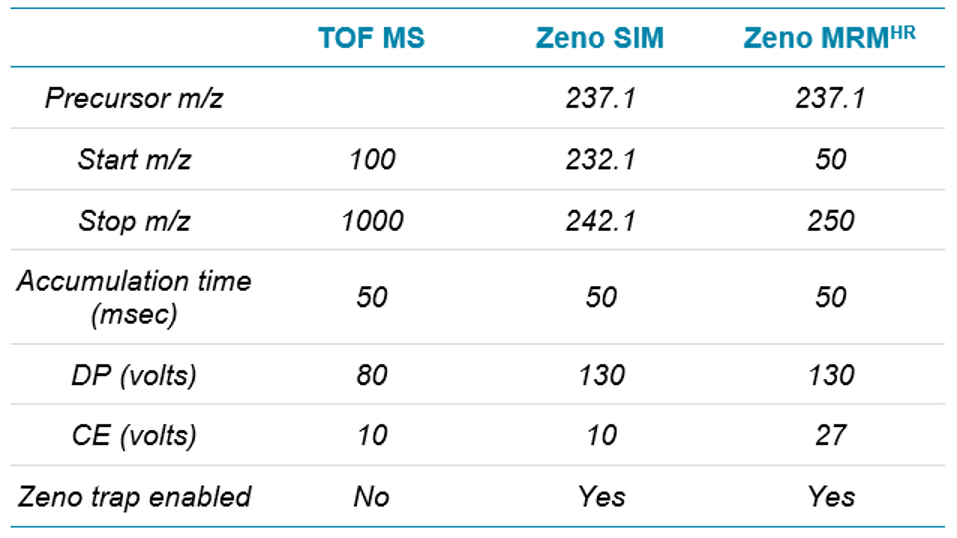
Table 3. MS and MS/MS values for carbamazepine. TOF MS values are common for both Zeno SIM and Zeno MRMHR methods.
Comparing TOF MS, Zeno SIM and Zeno MRMHR
This section discusses the 3 methods most likely to be used for routine quantification. Because the TOF MS scan is a part of all ZenoTOF 7600 system acquisition methods, 2 separate methods were run for this comparison: a Zeno MRMHR method and a Zeno SIM method. Data for carbamazepine are used for the comparison. Compound-specific values are shown in Table 3.
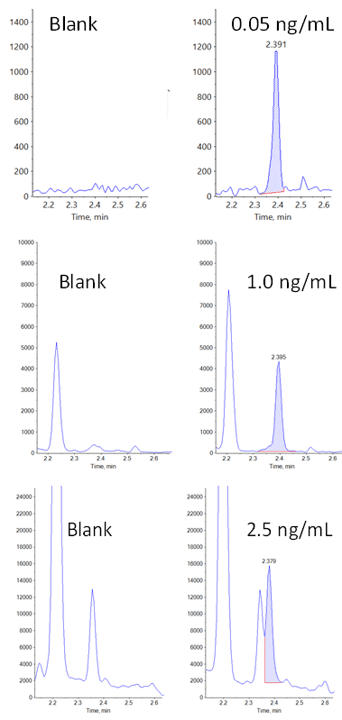
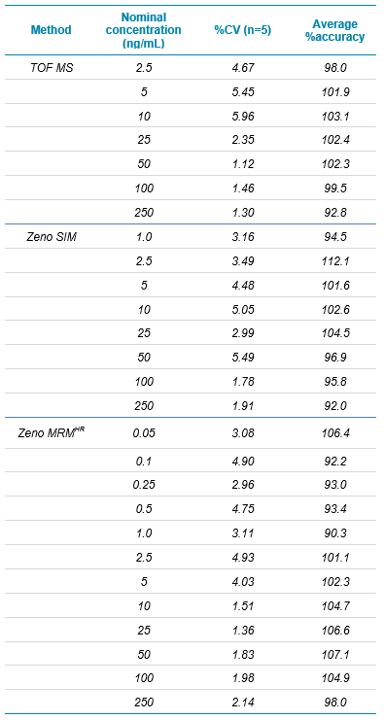
As would be expected for a typical small molecule analyte, the Zeno MRMHR method showed the highest level of sensitivity, with good signal to noise and reproducibility at the lowest prepared calibration point (Figure 2 and Table 4). The Zeno SIM analysis showed a small improvement over the TOF MS analysis, along with an unexpected improvement in specificity due to the significant reduction of an isobaric peak that is not completely baseline resolved from the analyte of interest in the TOF MS method. It is possible this represents a labile, higher molecular weight species that fragments to the parent m/z of the analyte of interest in Q2 even at the low collision energy, but is filtered out by the narrow m/z selection of Q1 in the Zeno SIM method. Regardless, this represents a real-world problem that can be encountered in fast-paced environments that allow for little to no method optimization. As previously mentioned, the Zeno SIM method is a no-tune, no-optimization method that can provide improved assay quality over a typical no-tune accurate mass method.
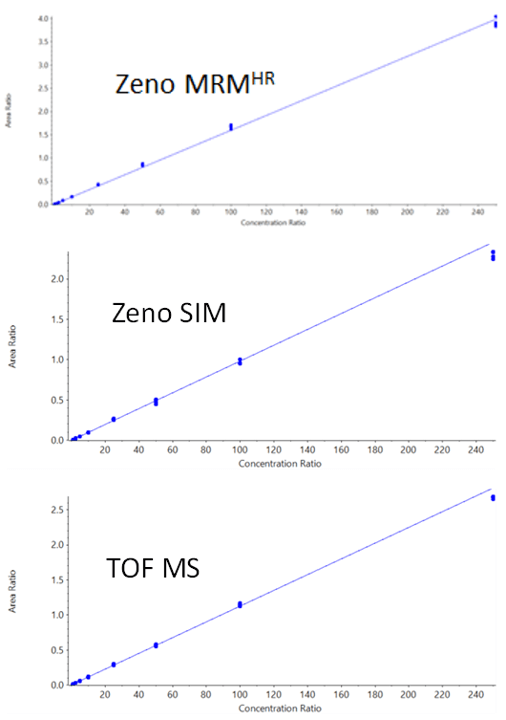
Calibration curves were linear over the range tested (0.05 ng/mL to 250 ng/mL) and are shown in Figure 3. Calibration curve data are summarized in Table 4. It should be noted that the TOF MS experiment is present in both the Zeno SIM method and the Zeno MRMHR method. The data were evaluated for each case and, as expected, were virtually identical in both cases (duplicate data not shown).
Figure 2. XICs for carbamazepine in plasma blank and at the LLOQ. Here, the 3 workflows are compared for sensitivity and specificity at the LLOQ. The Zeno MRMHR workflow (top) monitoring the fragment ion 194.096 with XIC width of ±0.0025 provided the cleanest blank and highest sensitivity. The Zeno SIM workflow (middle) provided the next highest sensitivity followed by the TOF MS workflow (bottom), which showed the poorest sensitivity due to an isobaric interferant with the precursor mass.
Figure 3. Carbamazepine calibration curves. Good linearity and reproducibility (5 technical replicates) were observed from the LLOQ to the high concentration of 250 ng/mL.
Table 4. Calibration curve data for carbamazepine. All values were calculated using a 1/x2 linear regression.
Comparing Zeno EAD MRMHR and Zeno MRMHR
EAD has typically been used as a very powerful qualitative tool, with the ability to generate much richer fragmentation spectra than standard CID.2 While the EAD cell is an ion trap, which can impose a limit on quantitative linear dynamic range, it can still produce a linear response over a useful quantitative range. Erythromycin, which is a larger small molecule that exhibits a singly charged parent (MW 733.9) with a rich fragmentation pattern, will be used as an example compound for the comparison of Zeno EAD MRMHR and Zeno MRMHR quantification.
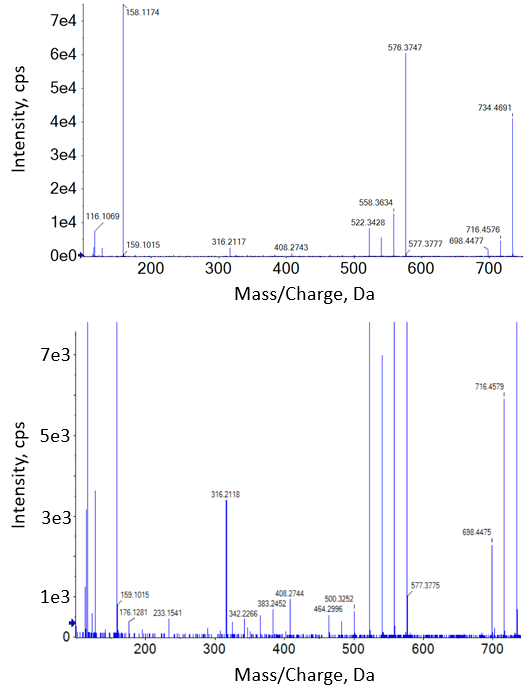
It’s useful to understand the differences in spectra produced by CID and EAD when considering fragment-based quantification. Figure 4 and Figure 5 show MS/MS spectra from the 100 ng/mL standards for erythromycin from each method. The CID spectra show a typical small molecule fragmentation pattern, with some precursor remaining and a few well-defined fragments that would be good candidates for use in quantification (Figure 4). A closer look at the spectra at the noise level shows 37 total fragments significantly above noise level.
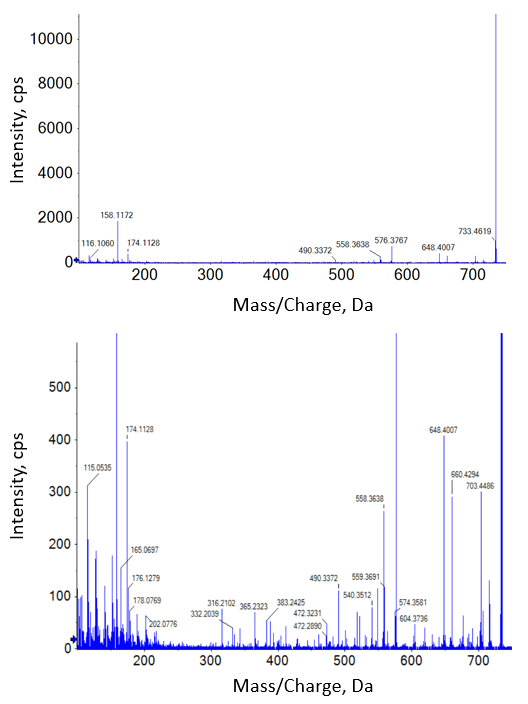
The EAD spectra in Figure 5 show a different relative abundance of fragments, including the presence of significantly more precursor. It should be noted that most fragments observed in CID are also seen in EAD. A closer examination of the EAD spectra reveals many more significant fragments (275 fragments above 3x noise level) than are seen in CID. The combination of a greater amount of unfragmented precursor and many more total fragments generated is a reason to expect a lower quantitative response for a single fragment from a typical, easily fragmented small molecule such as this. Compounds that do not show good CID fragmentation—for example, cyclic molecules such as oxytocin (publication pending)—can show improved results using Zeno EAD MRMHR over CID-based MS/MS such as Zeno MRMHR.
Figure 4. CID spectra of erythromycin. The CID MS/MS spectrum for erythromycin (m/z 734.5) at 100 ng/mL (top) shows a number of good fragment ions for quantification. The same spectrum but with the y-axis zoomed in (bottom) shows 37 fragments above 3x noise level. |
Figure 5. EAD spectra of erythromycin. The EAD MS/MS spectrum for erythromycin (m/z 734.5) at 100 ng/mL (top) shows a rich fragmentation pattern for molecular characterization. The same spectrum but with the y-axis zoomed in (bottom) shows 275 fragments above 3x noise level.
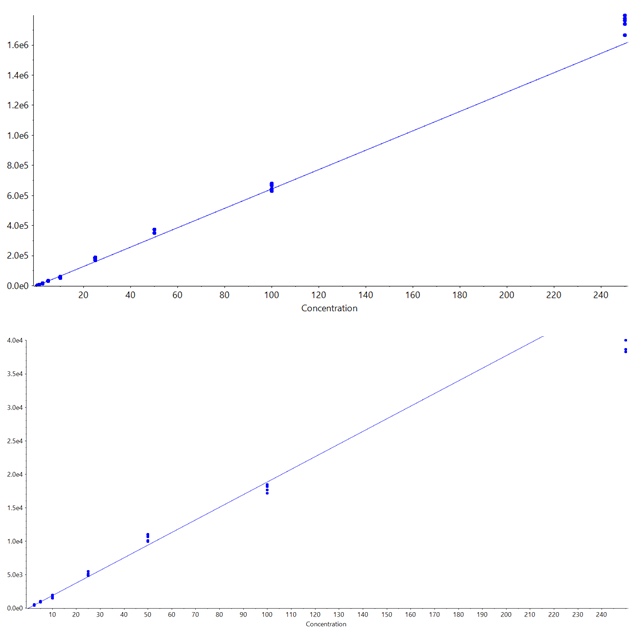
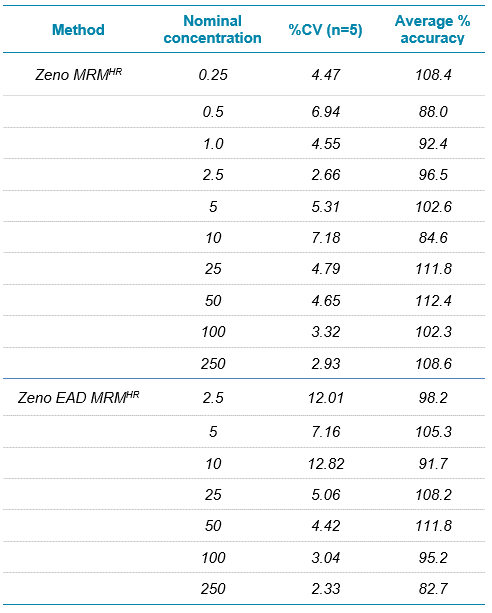
The parameters used for both the Zeno EAD MRMHR and Zeno MRMHR methods are shown in Table 5. As expected, Zeno MRMHR is more sensitive than Zeno EAD MRMHR for this compound. Zeno MRMHR has a higher linear dynamic range of up to 250 ng/mL (Figure 6, top). While the Zeno EAD MRMHR calibration curve appears to show a leveling off of signal at around 100 ng/mL, the data at the high point are still within typically accepted accuracy values for a research environment (Figure 6, bottom). Figure 7 shows the blank-to-LLOQ comparisons for the 2 methods. Calibration curve data are summarized for these 2 methods in Table 6.
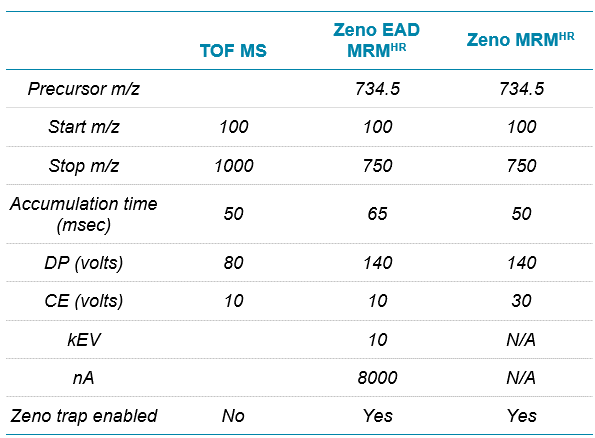
Table 5. MS and MS/MS values for erythromycin. TOF MS values are common for both the Zeno EAD MRMHR and Zeno MRMHR methods. The 158.117 m/z fragment was used for quantification for both the Zeno EAD MRMHR and Zeno MRMHR workflows.
Figure 6. Erythromycin calibration curves. Calibration curves for the Zeno MRMHR (top) and Zeno EAD MRMHR (bottom) workflows. Acceptable linearity and reproducibility (5 technical replicates) were observed from the LLOQ to a high point of 250 ng/mL for both methods, with each using m/z 158.117, ±0.0025 as the quantification fragment.
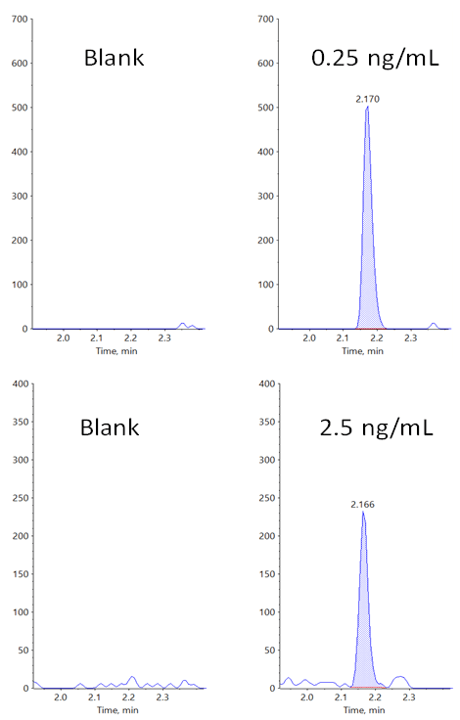
Figure 7. XICs for erythromycin in plasma blank and at the LLOQ. The Zeno MRMHR workflow (top) provided very good specificity and sensitivity. While good specificity is obtained with the Zeno EAD MRMHR workflow (bottom), showing very low noise levels, the LLOQ is 10x less than with CID. Fragment m/z 158.117, ±0.0025 was used for generation of the XICs for quantification for both methods. |
Table 6. Calibration data for erythromycin. All values were calculated using a 1/x2 linear regression.
Conclusions
The ZenoTOF 7600 system is a highly sensitive accurate mass platform that is well suited for use in a routine, early-stage bioanalytical laboratory setting. While Zeno MRMHR will be the approach of choice for most small molecule applications with higher sensitivity requirements, in situations where compound throughput limits method optimization time, a Zeno SIM approach can produce higher quality quantitative data than a typical accurate mass approach, with reduced MS development time. For compounds that do not produce good quantitative fragments under CID, and where Zeno SIM is not selective enough, Zeno EAD MRMHR is a viable, quantitative option that was not previously available to bioanalytical scientists.
References
- Qualitative flexibility combined with quantitative power. SCIEX technical note, RUO-MKT-02-13053-A.
- Orthogonal fragmentation mechanism enables new levels of metabolite characterization. SCIEX technical note, RUO-MKT-02-13348-A.
 Click to enlarge
 Click to enlarge
 Click to enlarge
 Click to enlarge
 Click to enlarge
 Click to enlarge
 Click to enlarge
 Click to enlarge
 Click to enlarge
 Click to enlarge
 Click to enlarge
 Click to enlarge
 Click to enlarge