Abstract
Evaluation of a drug candidate’s permeability and transporter activity is key step in the drug discovery pipeline. However, comprehensive assessment of a single compound’s activity requires multiple timepoints, bidirectional transport assessment, use of multiple transporters, etc. In this study, a multi-compound transporter study was analyzed using the Echo MS system, collected up to 300 different data points including samples, standards and blanks, in a total time of about 13 mins per plate. This provided a >50fold increase in study turnaround time vs. using a fast LC-MS/MS approach.

Introduction
Two key ADME (absorption, distribution, metabolism and excretion) properties used to predict the in-vivo performance of a drug candidate are its ability to permeate a cell membrane and its potential to act as a substrate for transmembrane transporter proteins. One of the most widely distributed membrane proteins responsible for the transport of xenobiotics across cellular membranes is the permeability glycoprotein 1 (Pgp). The LLC-PK (porcine kidney monolayer) cell line can be engineered to overexpress variants of Pgp, such as murine-derived Mdr1a. Cell membranes grown from these enriched or non-enriched sources can then be used to assess a drug candidate’s ability to act as a substrate for this transporter protein.
Evaluation of a drug candidate’s permeability and transporter activity is a complex process that requires analysis of many samples to assess a single compound’s activity. Biological replicates are prepared in separate wells to ensure that viable membranes are acquired for the experiment. The apical-to-basolateral and basolateral-to-apical (A→B and B→A) permeability of each sample is measured at multiple time points and these measurements are compared between membranes with native and overexpressed Pgp. This workflow often results in 60 or more samples that need to be collected, analyzed and quantified by LC-MS/MS to assess the permeability and transporter activity of a single compound. Considering that multiple compounds are generally run for an assay, the LC-MS analysis time can become a significant bottleneck.
In this study, the Echo MS system was used to analyze samples generated from a multi-compound transporter study. Data were acquired simultaneously for up to 4 compounds in a 384-well plate, requiring as many as 300 total ejections for samples, standards and blanks. This analysis was accomplished in approximately 13 minutes for a single 384-well plate. An analysis time of 2 seconds per sample was used to ensure adequate baseline resolution for each sample. When compared to the short LC-MS/MS analysis time of 3 minutes per sample, the time savings equal approximately 15 hours per plate using the Echo MS system as an analytical platform.
Key Features of the Echo MS system for ADME analysis
- Electrospray-based MS analysis provides broad compound coverage for diverse chemistries which is essential for ADME groups
- MRM analysis provides robust quantification, even with very fast dwell times
- Ultra-fast analysis time of 1 to 2 seconds per sample can dramatically increase study throughput compared to LC-MS/MS-based techniques
Methods
Sample preparation: Samples were generously provided by a collaborator in 96-well plate format. The following is a brief description of their generation. LLC-PK cell membranes were grown in Millipore 24-transwell plates, with a membrane surface area of 0.7 cm2. These LLC-PK cells either expressed native Pgp (MOCK membranes) or were engineered to overexpress Mdr1a (Mdr1a membranes). Apical well volumes of 400 µL and basolateral volumes of 800 µL were used, with an initial donor side concentration of 2 µM of the test compound.
Permeability was compared between MOCK and Mdr1a membranes with samples taken at 30, 60 and 90 minutes after compound delivery. All compounds were run in triplicate for both membrane types and in both apical-to-basolateral (A→B) and basolateral-to-apical (B→A) directions. Calibration curves for each compound were constructed for nominal concentrations of 0.002, 0.02, 0.2, 1 and 2 µM. Dextromethorphan was added as an internal standard to all samples and standards post-collection at an unstated concentration. A total of 11 compounds were analyzed for this study.
The samples were transferred in 50 µL aliquots from the 96-well plates that they were received in to 384-well plates (Beckman Sciences 384PP 2.0 Microplate) using a 12-channel pipette. Plates were set up with no more than 4 analytes in a single plate, such that each plate could be analyzed in 1 pass to maximize sample throughput. The final sample plates were centrifuged at 3000 rpm for 5 minutes to ensure there were no bubbles in the samples. The sample plates were then shaken on a plate shaker at 1350 rpm for 1 minute to ensure that a stable meniscus formed on the sample surfaces. Plates were stored at room temperature with an adhesive cover until analysis on the Echo MS system.
Acoustic ejection method: The same acoustic ejection method and carrier solvent were used for all analyses. A 2.5 nL droplet sample size was used with the AQ fluid class. Pure methanol was used as the carrier solvent and run at 420 µL per minute. Sample ejections were run at 1 sample every 2 seconds to ensure adequate time for baseline resolution between peaks.
Mass spectrometry: Samples were analyzed using the Echo MS system on the SCIEX Triple Quad 6500+ mass spectrometer using MRM analysis. Methods consisted of 4 MRMs plus an internal standard with dwell times of 15 ms, resulting in cycles of 100 ms. Compound specific parameters were optimized for each analyte using infusion optimization. Table 1 lists the source settings used for all methods and Table 2 lists MRM values for an example method.


Data processing: All sample data were integrated and quantified in the Analytics module of SCIEX OS software, using the summation algorithm. The summation algorithm is most appropriate for data collected on the Echo MS system because it does not rely on identifying local minimums around a retention time to establish start and stop points for peak integration. Instead, the summation algorithm integrates peak areas above a baseline between specified start and stop times. This approach is consistent and once the parameters are appropriately set, peak integration rarely requires modification, which is advantageous when handling the large number of samples that can be analyzed by an Echo MS system. MRM peak areas for each compound and condition were exported for further analysis.
Permeability values were calculated using Microsoft Excel. While it is beyond the scope of this document to describe in-depth the calculations involved in describing permeability and transporter activity, what was used for this study is briefly described below.

Where Papp is the apparent permeability, is the rate of concentration change of the analyte of interest in the acceptor well, A is the surface area of the membrane and C is the initial concentration of the donor well. These values were calculated using average values for each timepoint (n=3) for each experimental design (for example, A→B, Mdr1a membrane).
Using the A→B and B→A series for each cell line, an efflux ratio was calculated.


Results
The compounds analyzed in this study are listed in Table 3 with the lower limit of quantification (LLOQ), efflux ratio (Er), net efflux ratio (Ner) and % recovery values for each. This study was conducted in positive ion mode. Therefore, salicylic acid and digoxin, which are typically analyzed in negative ion mode, had poor sensitivity and low permeability. Efflux ratios were not calculated for these compounds. Additional method development could improve compound detection and further improve the LLOQ of these compounds.
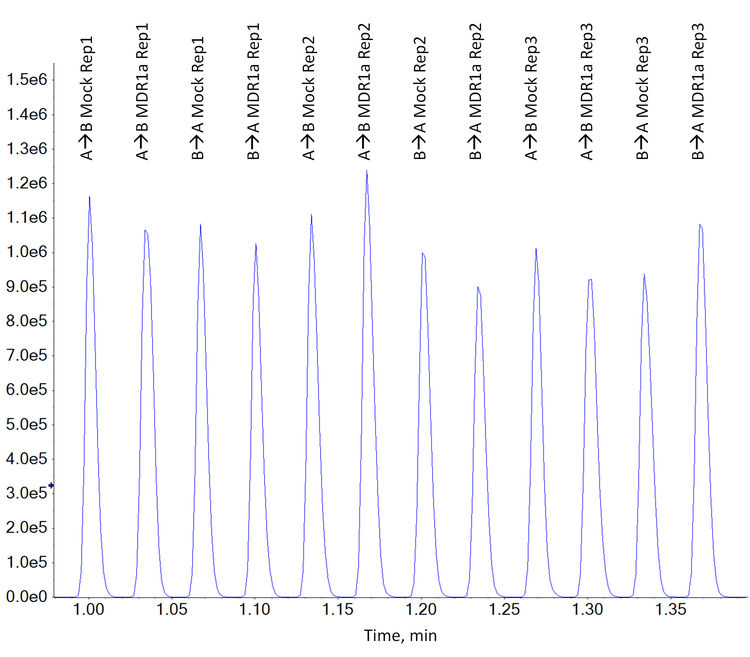
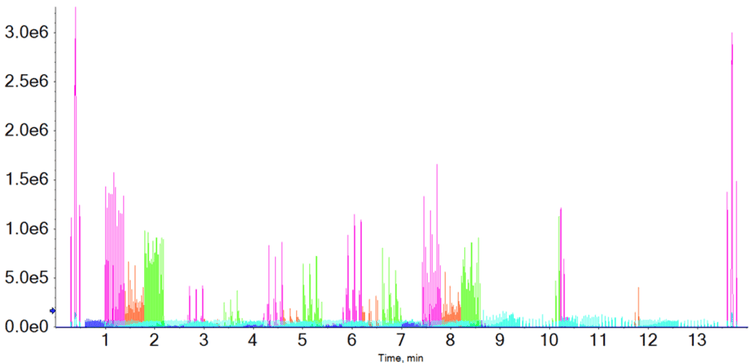
Figure 2 shows an example of the raw data acquired by the Echo MS system for a combined sample plate that monitored 4 analytes and an internal standard.
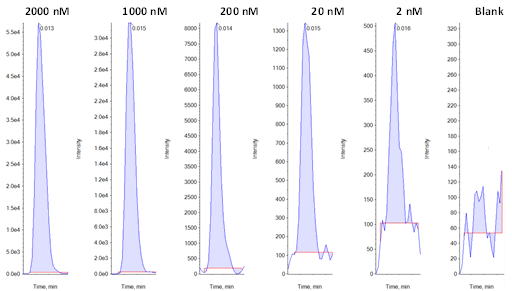
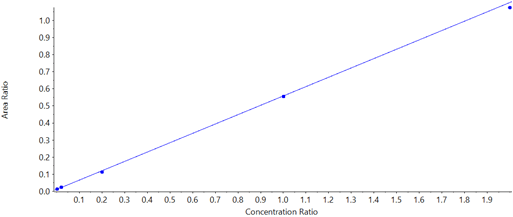
An Er value greater than 2 often indicates that a compound acts as a substrate for the transporter of interest and is therefore actively transported across the membrane. Ner values greater than 1 indicate that the overexpressed transporter is responsible for more of the observed efflux than the native transporter. Example calibration data for lamotrigine (the least sensitive compound in the example analysis) are shown in Figure 3 and the calibration curve generated for this compound is plotted in Figure 4.
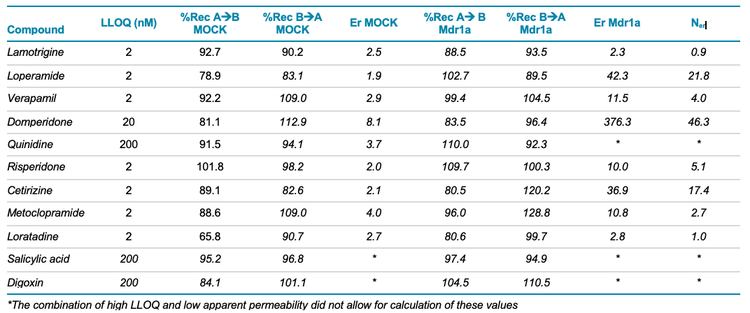
Quinidine is a known Pgp inhibitor and therefore was not expected to be transported across the membrane. An Er value could be calculated for the native, but not Mdr1a enriched membrane. Quinidine had to be present in relatively high concentrations to be accurately quantified (Table 3, LLOQ). This observation might complicate the interpretation of these results.
Overall, the assay recoveries were within an acceptable range, indicating that the compounds were stable and did show significant nonspecific binding to the sample wells. One notable exception is loratadine, which, for unknown reasons, was poorly recovered from the A→B condition.
The time savings enabled by using the Echo MS system for sample analysis are significant. Characterizing the active transport of a single analyte required the analysis of more than 60 samples across 2 experimental designs and different sample sources with controls. Using a comparable 3-min LC method, this type of analysis would require approximately 3 hours to run. Using the Echo MS system, this can be accomplished in 2 minutes.
Further assay optimization options
For 3 of the compounds analyzed, this generic assay was not sensitive enough to determine the efflux ratios. For cases such as these, sensitivity could be further optimized, for example, by analyzing some compounds in negative ion mode. Due to the diverse nature of compounds an ADME group is likely to work with, refinement would best be approached in a generic way to preserve the platform nature of the assay. Increasing the droplet count from 1 to 10 could have a net effect of a 10-fold increase in assay sensitivity.1 Alternately, for negative ionizing compounds, a more appropriate carrier solvent with a modifier could be employed.
Conclusions
Overall, the Echo MS system has been shown to be a viable platform for the high throughput analysis of transporter activity samples. In this study, Ner values calculated from data collected on the Echo MS system successfully distinguished between compounds known to be Pgp substrates, such as domperidone2, and those known not to interact with Pgp, such as loratadine3. This method was sensitive enough to reliably measure transport most compounds (8/11 compounds tested), even when using a generic assay strategy. This method was highly reproducible and accurate between experimental replicates, as demonstrated by the calibration curves for each compound.
The time saved by using the Echo MS system over a conventional LC-MS/MS analysis is significant. Short LC-MS/MS analyses typically require 3 minutes per sample, whereas the Echo MS system can analyze a sample in 2 seconds. As a result, assays run on the Echo MS system can be performed in minutes, instead of hours. The high-throughput nature of this method therefore significantly shortens time to results.
References
- Rapid MS/MS analysis with acoustic ejection mass spectrometry (AEMS). SCIEX technical note, RUO-MKT-02-11385-A.
- Bamburowicz-Klimkowska, M et al. (2007) Impact of the changes in P-glycoprotein activity on domperidone pharmacokinetics in rat plasma. Pharmacological reports, 59. 752-6.
- Wang EJ et al. (2001) Evaluation of the interaction of loratadine and desloratadine with P-glycoprotein. Drug Metab Dispos. 29(8): 1080-1083.