Advancing biotherapeutic characterization and development using an enhanced icIEF-UV/MS workflow with improved sensitivity
Scott Mack, Jingwen Ding, Haichuan Liu, Maggie Ostrowski and Zoe Zhang
SCIEX USA
Abstract
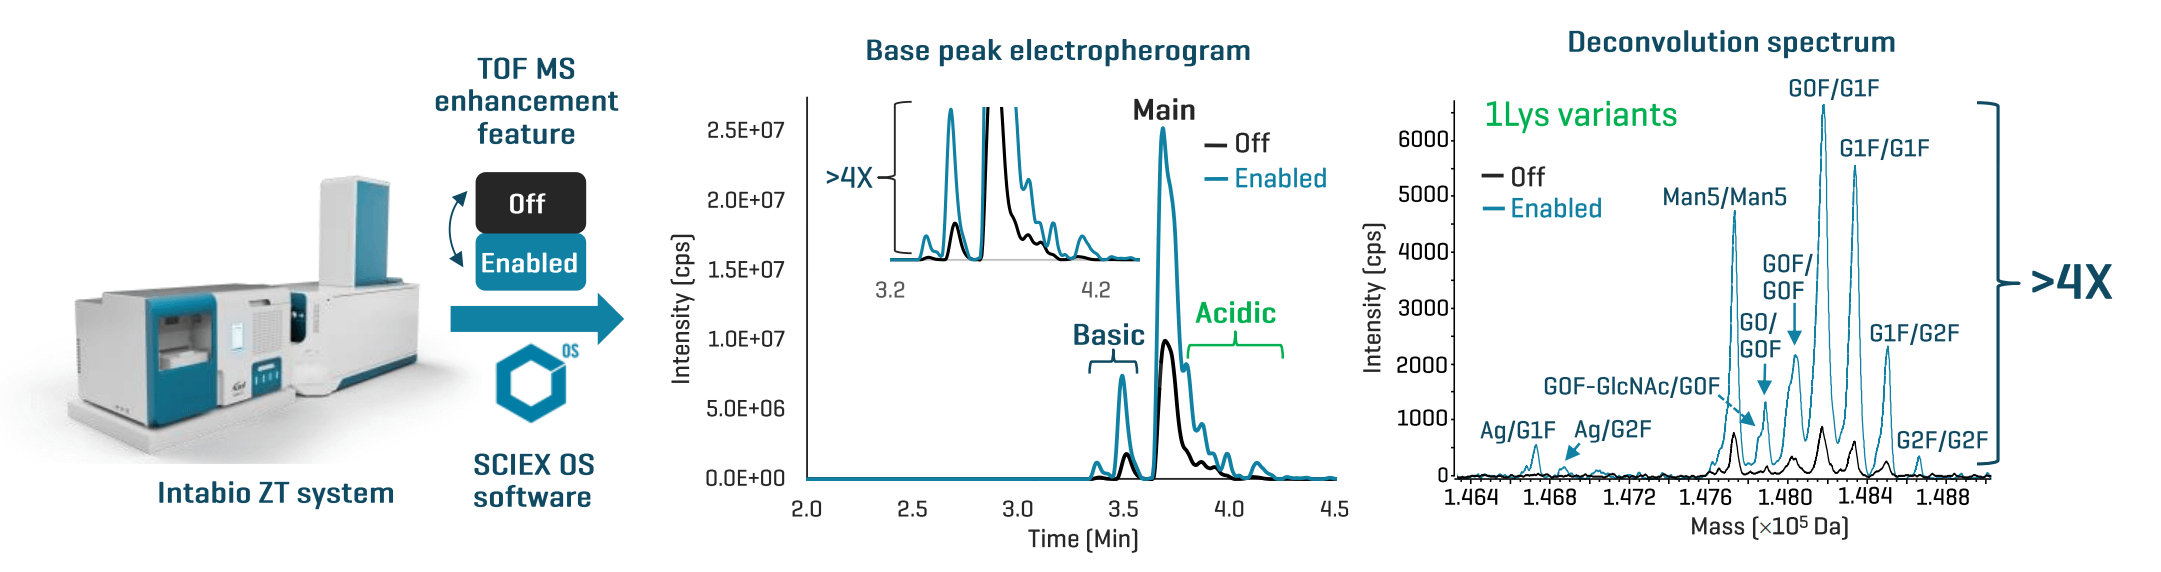
This technical note describes a TOF MS enhancement feature for imaged capillary isoelectric focusing (icIEF)-UV/MS that increases the MS sensitivity for low-abundant proteoforms by >4 folds, enabling sensitive detection and confident identification of these challenging species in biotherapeutics (Figure 1). The enhanced icIEF-UV/MS workflow expands the boundary and depth of proteoform analysis to accelerate biotherapeutic characterization and development while ensuring the highest standard for product quality.
icIEF-UV/MS is a fully integrated solution for high-resolution charge separation, sensitive UV detection and confident MS identification of biotherapeutic proteoforms. This platform workflow is utilized for rapid intact protein analysis to detect product quality attributes (PQAs), including charge variants, post-translational modifications (PTMs) and product-related impurities.1-3 This streamlined workflow enables rapid proteoform analysis to accelerate quality and impurity assessment and inform in-depth biotherapeutic characterization using LC-MS approaches on the same MS platform.1-6
Comprehensive PQA characterization is vital to the quality and impurity assessment of biotherapeutics, ensuring their safety and efficacy throughout the development cycle.7 Traditionally, multiple instrument platforms are required for the separation, detection and identification of biotherapeutic proteoforms. Fractionation using icIEF, followed by off-line MS analysis is labor-intensive, often taking days to weeks to complete. For low-abundant species that require further investigation, multiple rounds of fractionation are necessary to obtain enough material for the analysis. This lengthens the turnaround time to obtain answers for key decision-making during drug development. The icIEF-UV/MS workflow addresses this challenge by coupling icIEF-UV, for high-resolution charge separation, with accurate mass measurement for proteoform identification in a fully integrated configuration.1-3 The increase in TOF MS sensitivity described in this technical note further expands the capabilities of icIEF-UV/MS for the detection and monitoring of low-abundant proteoforms that might introduce potential immunogenicity concerns.
Key features of the enhanced icIEF-UV/MS workflow for biotherapeutic characterization
- Enhanced sensitivity for low abundant proteoforms: >4X increase in TOF MS sensitivity allows detection and confident identification of these challenging species.
- Rapid analysis: icIEF-UV/MS offers high-resolution separation, sensitive detection and confident identification for rapid monitoring of biotherapeutic proteoforms without the need for off-line fractionation, reducing the time to obtain answers from weeks to hours.
- Easy method creation: The TOF MS enhancement feature is easy to enable in a ZenoTOF MS method, exclusively for icIEF-UV/MS analysis.
- Single-MS solution: The ease of alternating icIEF-UV/MS and LC-MS analysis on a single MS platform4-6 enables quick access to these powerful techniques whenever needed.
- Routine implementation: The streamlined icIEF-UV/MS workflow can be implemented for routine quality and impurity assessment of biotherapeutics by users with different levels of MS expertise
Figure 1. Advancing biotherapeutic characterization using an enhanced icIEF-UV/MS workflow. Enabling a TOF MS enhancement feature for icIEF-UV/MS analysis within SCIEX OS software v3.4.5 led to >4X increase in MS signal intensity for low-abundant charge variants in biotherapeutics, leading to the detection and identification of new proteoforms, such as the aglycosylated (Ag) 1Lys variants of trastuzumab (see the deconvolution spectrum).
Introduction
Biotherapeutics are highly heterogeneous molecules because of various post-translational modifications (PTMs), degradation products, aggregates and charge variants.1 Comprehensive and rapid charge heterogeneity analysis is important for formulation and stability studies, critical quality attribute (CQA) assessment and quality control of biotherapeutics.7
Traditionally, charge variants are separated by icIEF, followed by fraction collection for LC-MS analysis off-line. This strategy is time-consuming (days to weeks) and typically involves the efforts of multiple analytical groups. The icIEF-UV/MS workflow offered by the Intabio ZT system provides on-line MS analysis of charge variants separated by icIEF, reducing the time to obtain comprehensive charge heterogeneity analysis from weeks to hours.1-3 Previous technical notes have demonstrated the combined capabilities of icIEF-UV/MS and LC-MS for rapid charge heterogeneity analysis and comprehensive biotherapeutic characterization on a single MS platform.4-6 In this work, a TOF MS enhancement feature was enabled for the icIEF-UV/MS analysis. This feature significantly improves the detection of low-abundant proteoforms in biotherapeutics, including those that might raise immunogenicity concerns, ensuring the drug’s quality and safety.
Methods
Sample preparation: NISTmAb (RM 8671, NIST) and trastuzumab were desalted and then mixed with the master mix solution containing arginine, pharmalyte 5 to 8 (Cytiva), pharmalyte 8 to 10.5 and 6.0 µg/mL peptide pI markers. The solution was vortexed and degassed by centrifugation prior to intact mass analysis using icIEF-UV/MS.
icIEF-UV/MS: mAb samples were separated with an Intabio cartridge (SCIEX) installed on the Intabio ZT system (SCIEX). UV absorbance measurements were collected at 1 Hz during the focusing and mobilization steps. The samples were introduced into the ZenoTOF 7600 system by a metered 3 µL/min flow of chemical mobilizer. TOF MS data were acquired using a ZenoTOF MS method within SCIEX OS software v3.4.5 (Figure 2). The key ZenoTOF MS parameters are shown in Table 1.
Figure 2. ZenoTOF MS method for icIEF-UV/MS analysis. The TOF MS enhancement feature is enabled exclusively for icIEF-UV/MS analysis of low-abundant charge variants in a ZenoTOF MS method within SCIEX OS software v3.4.5.
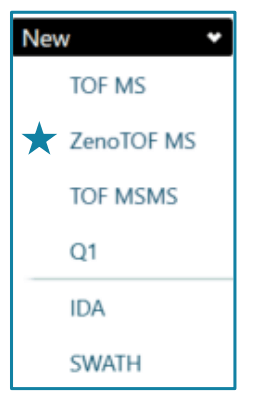
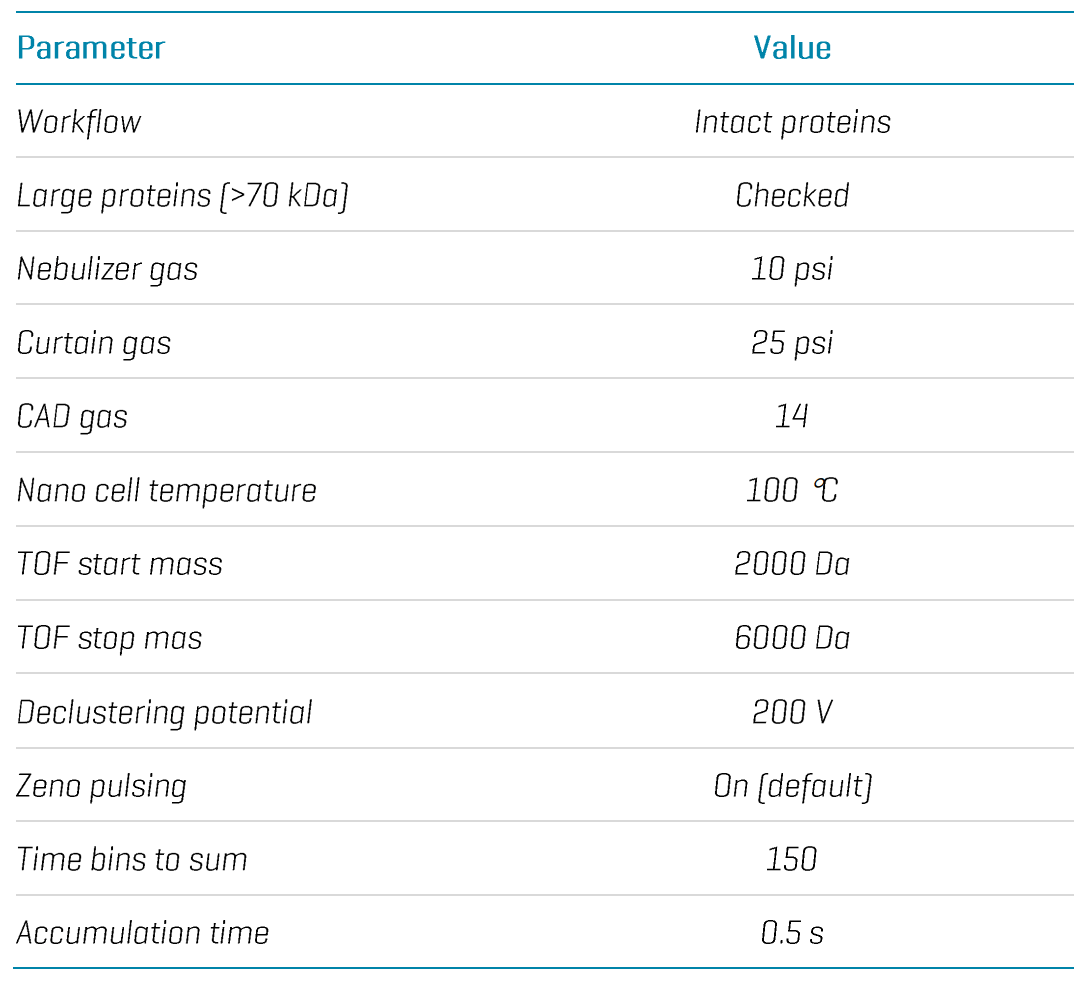
Table 1. Key ZenoTOF MS parameters.
Data analysis: UV traces and mass spectra from icIEF-UV/MS analysis were interpreted using Biologics Explorer software v5.0 (SCIEX). Each peak in the charge profile was integrated using the Intabio software to determine its peak area and percentage composition. Intact masses of the main peak and charge variants were determined from the deconvolution of the corresponding mass spectra.
Enhanced TOF MS measurement for icIEF-UV/MS
The icIEF-UV/MS workflow offers single platform separation, detection and identification of charge variants in a single assay for rapid proteoform analysis of biotherapeutics.1-3 To extend the capabilities of icIEF-UV/MS for detection and identification of low-abundant proteoforms or impurities with even greater confidence, a TOF MS enhancement feature was enabled in a ZenoTOF MS method within SCIEX OS software v3.4.5 (Figure 2).
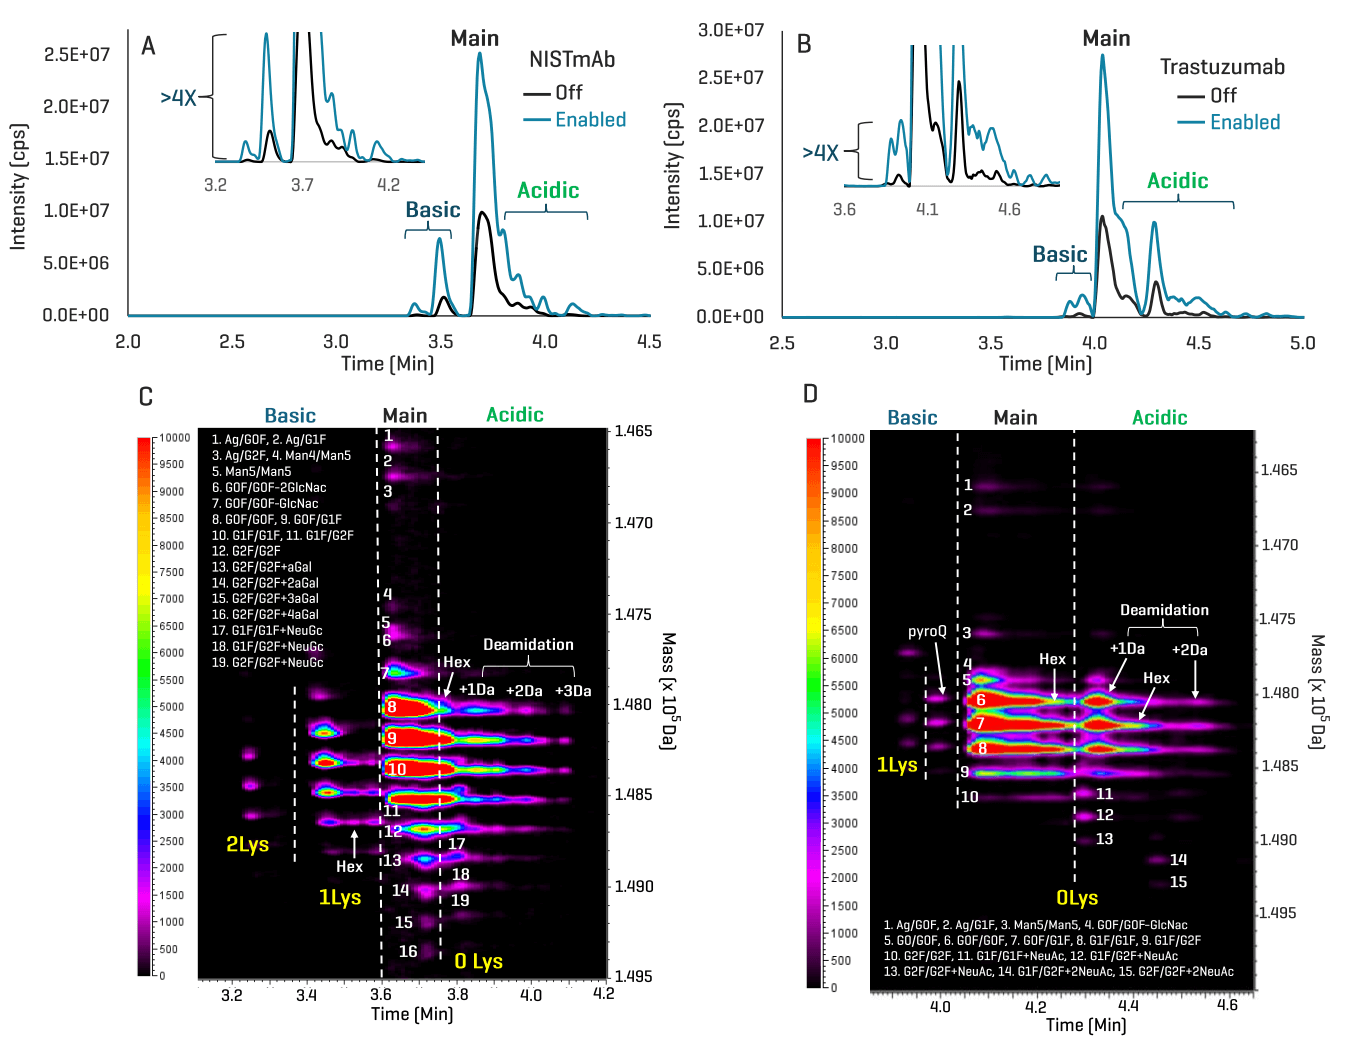
Figures 3A and 3B show the base peak electropherograms (BPEs) of NISTmAb and trastuzumab acquired without the enhancement feature (Off) or with the feature enabled (Enabled). The comparison of the data acquired in the Off and Enabled modes reveals that the enhancement feature provided >4X increase in signal intensity for the low-abundant charge variants (insets in Figures 3A and 3B). The significant gain in TOF MS sensitivity led to increased confidence in the detection and identification of proteoforms at very low levels. In addition, this improvement led to the discovery of low-abundant species that were below the detection limit in the Off data, as will be described in the following section. The ion maps from Biologics Explorer software offer an excellent visualization of various proteoforms detected and identified in the icIEF-UV/MS data of NISTmAb and trastuzumab acquired in the Enabled mode (Figures 3C and 3D).
Figure 3. Enhanced icIEF-UV/MS analysis of biotherapeutics. The base peak electropherograms (BPEs) from icIEF-UV/MS analysis of NISTmAb (A) and trastuzumab (B) in the Off and Enabled modes are compared in an overlaid format, with insets showing the zoom-in views of the low-abundant proteoforms. The comparison of the data from the Off and Enabled modes shows that enabling the TOF MS enhancement feature within SCIEX OS software v3.4.5 provided a >4X increase in signal intensity for the low-abundant charge variants (insets in A and B). This sensitivity gain led to increased confidence in the identification of low-abundant charge variants and the detection of new proteoforms, as will be described below. The ion maps from Biologics Explorer software provide excellent visualization of the charge variants identified in the enhanced icIEF-UV/MS data (C and D). (0-2)Lys: proteoforms with 0-2 lysine residues at the C-terminus. Hex: glycation. DeAm: deamidation.
Improved detection of low-abundant charge variants using enhanced icIEF-UV/MS
The enhanced icIEF-UV/MS workflow provides valuable information to facilitate product quality and impurity assessments, accelerating the development of biotherapeutics. A change from the expected charge variant profile might indicate potential changes to the manufacturing process, leading to unexpected mutations or translational errors.
Therefore, it is essential to monitor the charge variants throughout the entire development process.
Figure 4 shows the improved detection of 2 low-abundant basic variants B1 and B2 in NISTmAb. High sensitivity is required for the detection and identification of the low-abundant proteoforms within these 2 variant peaks. The 2 peaks were barely detected or not present in the BPE acquired without TOF MS enhancement (Off trace in Figure 4A). The gain in TOF MS sensitivity provided by the enhanced icIEF-UV/MS workflow led to >4X increase in MS signal for more confident identification of the proteoforms under B1 and B2 (Enabled trace in Figure 4A). Figure 4B shows the major 2Lys-containing glycoforms identified in the Off and Enabled deconvolution spectra of the basic peak B1. Compared to the Off data (Off trace in Figure 4B), the enhanced icIEF-UV/MS workflow detected and identified additional 2Lys-containing glycoforms, including Man5/Man5, G0F-GlcNAc/G0F and G2F/G2F (Enabled trace in Figure 4B). The comparison of the Enabled deconvolution spectra of the basic peaks B1 and B2 revealed the presence of glycated 2Lys variants under B2 (Figure 4C). The relative abundances of fucose-containing glycoforms (e.g. G1F/G1F) are higher for B2 (green trace in Figure 4C) vs. B1 (blue trace in Figure 4C), indicating the presence of glycated variants for B2, which explains a slight pI shift to the acidic region for B2 compared to B1 (Figure 4A).
Figure 4. Detection and identification of low-abundant Lys variants in NISTmAb using the enhanced icIEF-UV/MS workflow. The enhancement of TOF MS sensitivity for icIEF-UV/MS analysis led to improved detection of low-abundant basic variants B1 and B2 in the BPE (A). The deconvolution spectra of the B1 peak detected in the Off and Enabled data (A) show that TOF MS enhancement resulted in the detection and identification of new 2Lys-containing glycoforms, including Man5/Man5, G0F-GlcNAc/G0F and G2F/G2F (B). The gain in TOF MS sensitivity also led to the detection of an additional basic peak B2 in the BPE (A). The presence of glycated species in this basic peak led to a slight pI shift to the acidic region compared to the basic peak B1 (A) and the change in the relative abundances of the 2Lys-containing glycoforms (C). To facilitate comparison, the intensities of 2Lys-containing glycoforms were normalized to that of G0F/G1F in the respective deconvolution spectrum of B1 and B2 peaks (C). The relative abundance of G0F/G0F is higher for the B1 peak (blue trace in C) than for the B2 peak (green trace in C), while the opposite is true for G1F/G1F, indicating the presence of glycated species for the B2 peak. Peak assignments for additional glycated 2Lys species detected for the B2 peak are labeled in green and shown in parentheses (C).
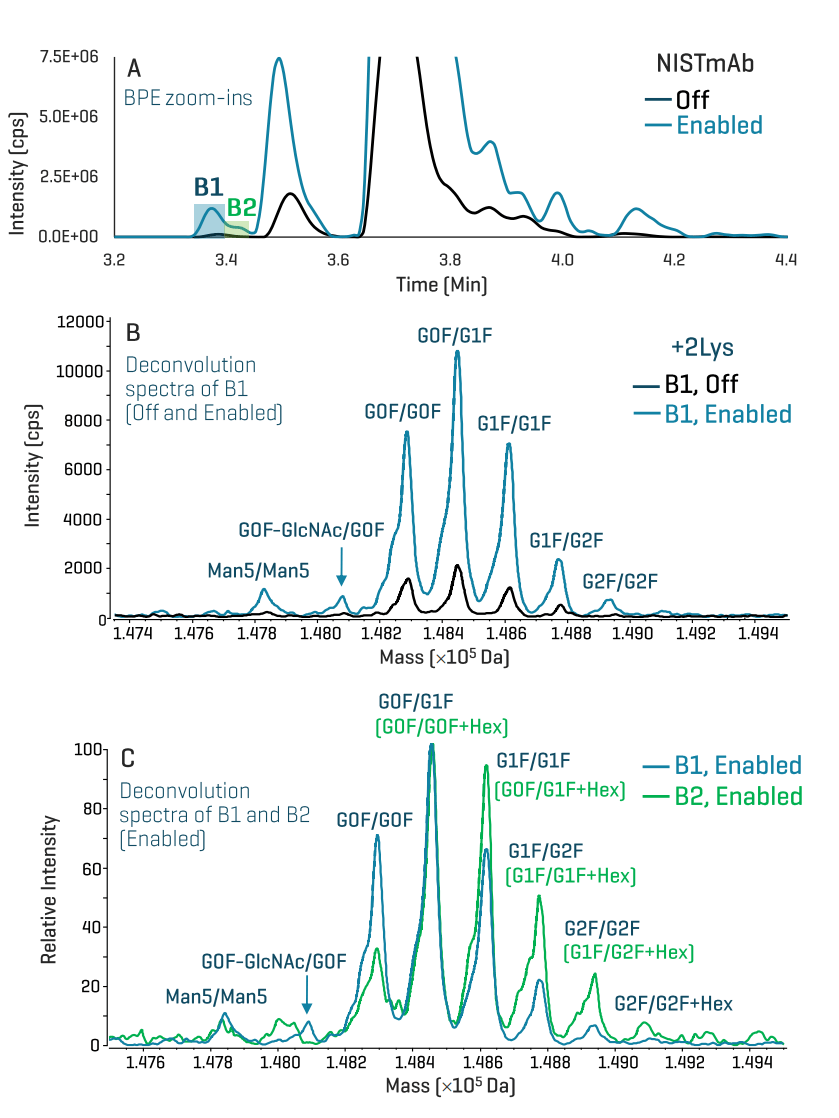
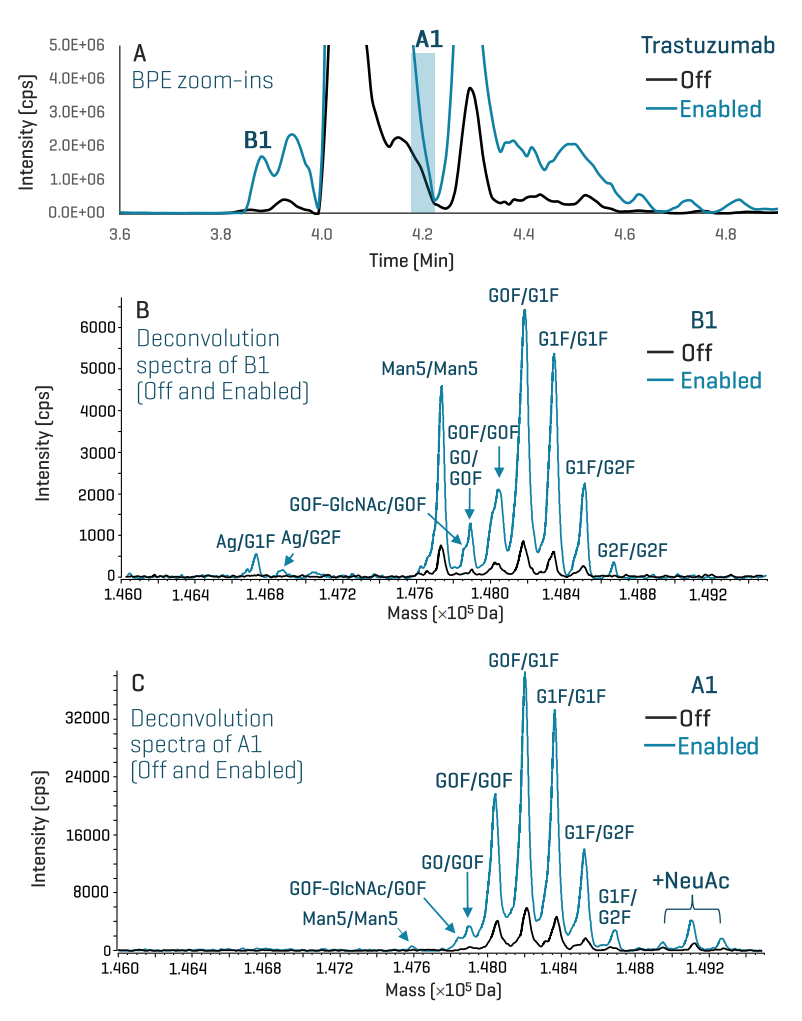
Figure 5 shows the improved detection of the low-abundant 1Lys and 1NeuAc proteoforms of trastuzumab using the enhanced icIEF-UV/MS workflow. This enhanced workflow provided >4X increase in MS signal for major 1Lys-containing proteoforms and also the identification of new 1Lys species, including Ag/G1F, Ag/G2F and G2F/G2F (Figure 5B).
Glycosylation is a known CQA for biotherapeutic development.7 Sialylated glycoforms are associated with protein stability and binding efficiency. The abundance of sialylated species in biotherapeutics is generally low, which poses an analytical challenge for the detection of these species, particularly at the intact protein level. Using the enhanced icIEF-UV/MS workflow, significant improvement in the detection and identification of sialic acid (NeuAc)-containing glycoforms was achieved (Figure 5C). Detailed characterization of NeuAc species will be performed by switching the system from icIEF-UV/MS to LC-MS as described previously.4-6
In summary, a TOF MS enhancement feature enabled in a ZenoTOF MS method for icIEF-UV/MS led to >4X increase in the detection of low-abundant proteoforms in biotherapeutics. This significant sensitivity improvement expands the capabilities of icIEF-UV/MS for rapid product quality and impurity assessments, increasing confidence in biotherapeutic characterization, reducing immunogenicity concerns and ensuring drug safety. In addition, this enhanced icIEF-UV/MS workflow, coupled with LC-MS workflows available from the same MS system, provides a single-MS solution to rapid proteoform analysis and comprehensive biotherapeutic characterization on a routine basis.4-6
Figure 5. Detection and identification of low-abundant Lys and NeuAc variants in trastuzumab using the enhanced icIEF-UV/MS workflow. TOF MS enhancement provided a sensitivity boost for icIEF-UV/MS to detect and identify low-abundant charge variants in the BPE of trastuzumab (A). The deconvolution data of the basic B1 peak shows that TOF MS enhancement led to the detection and identification of additional glycoforms, such as aglycosylated (Ag) and G2F/G2F (Enabled trace in B), compared to the data acquired without the enhancement (Off trace in B). In addition, the sensitivity gain provided confident identification of sialic acid (NeuAc)-containing glycoforms under the basic peak A1 (Enabled trace in C).
Conclusions
- The enhanced icIEF-UV/MS workflow delivered a >4X increase in MS signal for sensitive detection and confident identification of low-abundant proteoforms
- The sensitivity gain offered by the enhanced icIEF-UV/MS workflow led to the discovery of low-abundant proteoforms that were below the detection limit of the method without the enhancement feature,
- The enhanced icIEF-UV/MS workflow enables the confident identification of low-abundant proteoforms, including those that might raise immunogenicity concerns
- The TOF MS enhancement feature is enabled automatically for icIEF-UV/MS in a ZenoTOF MS method within SCIEX OS software and can be easily implemented by users with different levels of MS experience
References
- Monitoring and characterization of glycation in a biotherapeutics degradation study using icIEF-UV/MS and LC-MS workflows. SCIEX technical note, MKT-33706-A.
- Direct and rapid multi-attribute monitoring of multiple intact monoclonal antibodies with a wide isoelectric-point range of 7.3 to 9.1. SCIEX technical note, MKT-26996-A.
- Charge variant analysis of antibody-drug conjugates using an icIEF-UV/MS workflow. SCIEX technical note, MKT-29837-A.
- Leverage orthogonal technologies: cIEF, icIEF-UV/MS and LC-MS to facilitate biotherapeutics development. SCIEX technical note, MKT-31116-A.
- In-depth charge heterogeneity analysis of antibody-drug conjugates with a streamlined icIEF-UV/MS and EAD-based peptide mapping workflow. SCIEX technical note, MKT-32353-A.
- In-depth charge heterogeneity analysis of antibody-drug conjugates with a streamlined icIEF-UV/MS and EAD-based peptide mapping workflow. SCIEX technical note, MKT-32353-A.
- Anna Robotham and John Kelly. (2020) LC-MS characterization of antibody-based therapeutics: recent highlights and future prospects. Approaches to the Purification, Analysis and Characterization of Antibody-Based Therapeutics. Chapter 1: 1-33.