Using the SCIEX Triple Quad 7500 system, powered by SCIEX OS software
Catherine S. Lane1, Daniel Blake1, Adam Cryar2, Jacob Harris2, Ernestas Sirka2, Markus Ralser3, Ziyue Wang3, Johannes Hartl3, Michael Mülleder4
1SCIEX, Alderley Edge, UK, 2Inoviv, London, UK, 3Institute of Biochemistry, Charité Universitätsmedizin Berlin, Germany, 4Core Facility - High-Throughput Mass Spectrometry, Charité Universitätsmedizin Berlin, Germany
Abstract
Study of the disease caused by the SARS-CoV-2 virus continues, and a key area of research is to investigate disease severity and determine whether specific plasma proteins can enable prediction of potential disease progression in individuals. Here, an assay for a set of putative protein biomarkers related to disease severity has been developed on the SCIEX 7500 system, with the goal of providing a high throughput, robust, simple and scalable quantification assay for various research applications.


Introduction
Multi-faceted research into the nature of the COVID-19 disease caused by the SARS-CoV-2 virus is ongoing, as scientists strive to increase understanding of the disease and stratify and predict the impact it has on everyday life globally. One important area of research is to investigate the severity of the disease and determine whether quantification of specific plasma proteins can measure and predict disease progression in individuals. Such information could allow further research into areas such as disease management and patient prognosis.
Large scale sample analysis would be a key component of future methodologies to achieve this goal. As a result, such technologies would need to show sensitivity, robustness and ease-of-use in their sample processing procedures. The use of full or partial kit-based approaches would be a distinct advantage in this undertaking, coupled with a sensitive and robust detection strategy.
Biomarker identification has long been established on QTOF MS systems. The work presented here leads on from studies carried out on the SCIEX TripleTOF 6600 system (1) that have identified a number of relevant biomarkers for disease stratification. The work undertaken here aims to employ the accurate quantification, sensitivity, robustness, speed, scalability and ease-of-use capabilities of SCIEX triple quadrupole technology to assess a multiplexed panel of 31 plasma proteins as potential biomarkers for COVID-19 disease severity stratification, utilizing technologies from SCIEX, Inoviv and Charité – Universitätsmedizin Berlin. This assay incorporates proteins that are known to function in inflammation (e.g. C-reactive protein), coagulation and vascular dysfunction (e.g. von Willebrand factor), complement cascade (e.g. Complement C1q subcomponent subunit C) and diverse biological processes believed to be altered by COVID-19 (e.g. Cystatin C).
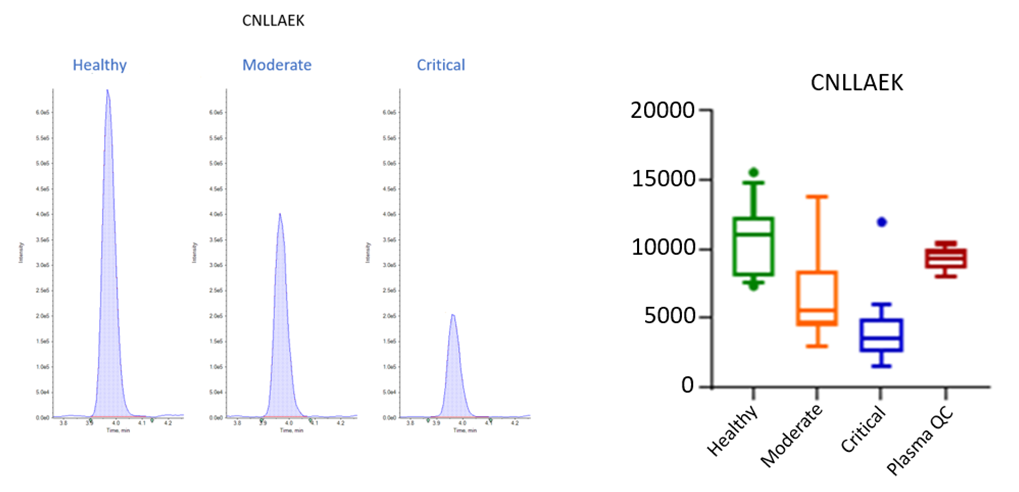
Figure 1 shows how quantification of a plasma protein (Alpha-2-HS-glycoprotein) can reveal dramatic differences between disease states, in this case showing a 3x increase between a healthy state from a critical disease state sample, and also showing marked differences in data sets between groups of analyzed samples.
Figure 1. Example of an individual chromatogram and box plot of multiple sample analyses of a potential plasma peptide biomarker of Covid-19 disease severity.
Key features of the SCIEX 7500 system for the stratification of plasma proteome response to SARS-CoV-2 infection
- Quantitative performance — specific novel technologies of the SCIEX 7500 system allow ultimate sensitivity, linear dynamic range, reproducibility and instrument robustness
- Improvements in sensitivity allow for simplified chromatography, reduced complexity of sample preparation and faster LC runtimes, leading to higher throughput assays.
Methods
Sample preparation: 5 µL sample was processed in a 96-well plate format by a combined method of an initial urea denaturation (using a solution containing isotopically labelled internal standards) / tryptic digestion protocol followed by a C18 solid phase extraction procedure. 0.2 µL of the final extract was injected onto the LC-MS/MS system.
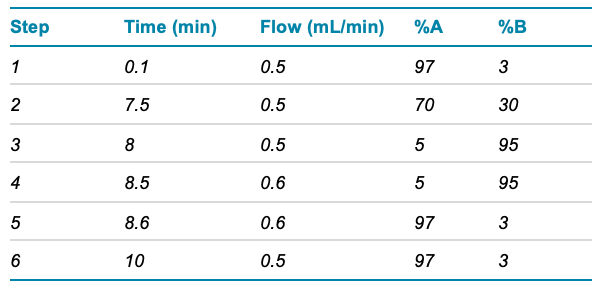
Chromatography: Chromatographic separation was achieved using an ExionLC AD system and a Phenomenex Luna Omega Polar C18 3µm, 100 x 2.1 mm column. A gradient of water and acetonitrile (both containing 0.1% formic acid) was used at a flow rate of 500 μL/min. The total chromatographic run time to allow for elution of all analytes was 10 minutes and the gradient profile is shown in Table 1.
Mass spectrometry: The SCIEX 7500 system was used to analyze the samples, operating in positive electrospray ionization mode. The OptiFlow Pro ion source parameters were retuned as there are some key design differences compared to the earlier Turbo V ion source. Including all endogenous peptides and internal standards, a total of 228 MRM transitions from 52 peptides were monitored, using time scheduling of MRM transitions with parameters generated using the Scheduled MRM Pro algorithm.
Data processing: All data were acquired and processed using SCIEX OS software 2.0.1.
Table 1. UHPLC Gradient
Results
Potentially clinically relevant biomarkers were assessed across five sample types, specifically those from samples with disease state previously reported as healthy, moderate and critical, and from plasma and serum quality control samples.
Statistical analysis: Quantification results of the 52 surrogate tryptic peptides derived from 31 plasma proteins and processed by the proposed method were statistically analyzed to test the performance of the plasma protein panel as a disease severity stratification tool. Figure 2 shows the Principle Component Analysis biplot where clear stratification between disease states can be seen. Analytical performance was varied across the 52 peptides monitored, as was the magnitude of concentration change across disease states, but nevertheless each peptide contributed to the overall stratification to a greater or lesser degree.
In order to simplify the method, a PCA biplot of the top 7 most favorable peptides (based on analytical performance and stratification ability) was generated which still shows significant disease state stratification. (Figure 3).
In addition to PCA, boxplots were generated for individual surrogate peptides that show concentration changes across disease states. Example box plots of 5 potential peptide biomarkers are shown in Figure 4.
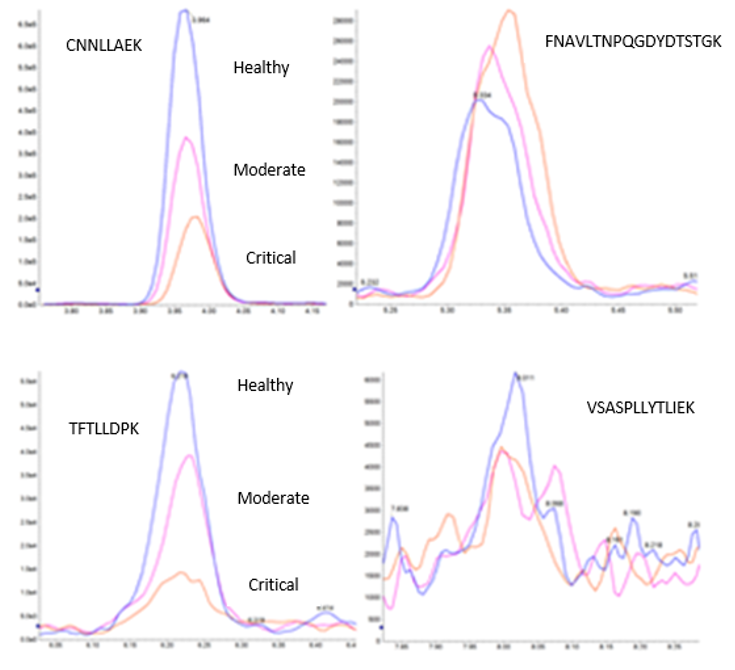
When assessing potential biomarkers, it is still possible for less sensitive peptides to show an acceptable degree of disease state stratification and contribute significantly to the overall stratification model. Box plots generated have demonstrated this, but it is also possible to see this in individual peptide chromatograms. Figure 5 shows four individual peptides with varying degrees of contribution based on both stratification performance and analytical performance, particularly sensitivity.
Figure 2 PCA Biplot of quantification results from all 52 peptides monitored, showing disease state stratification.
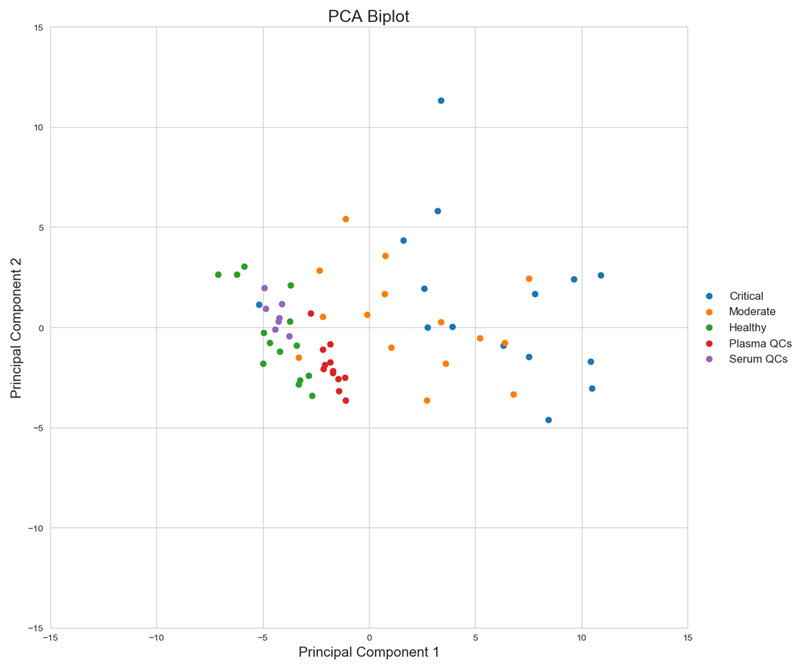
Figure 3. PCA Biplot of quantification results from designated top 7 peptides out of the 52 peptides monitored.
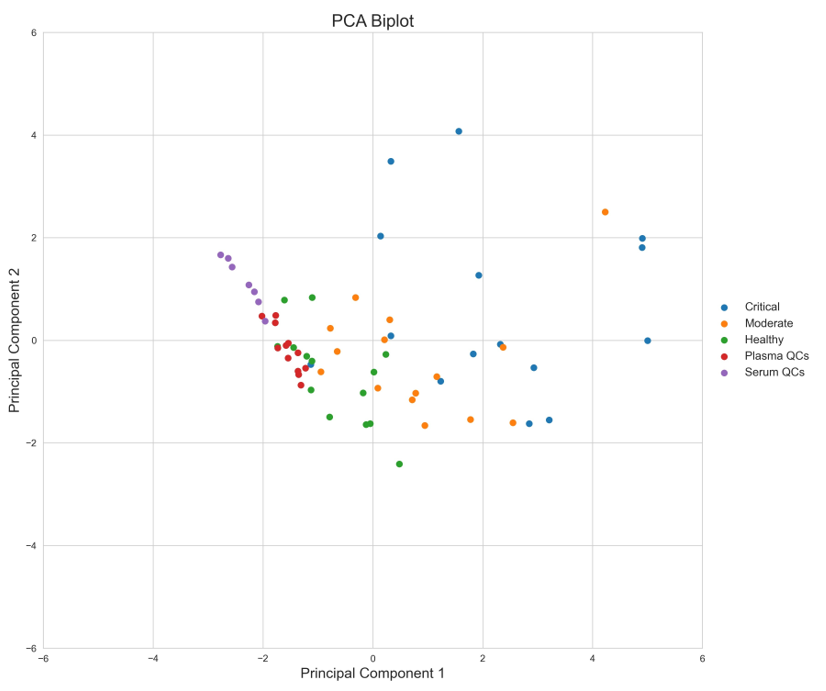
Figure 4. Peptide concentration changes across COVID-19 disease states. Quantified surrogate tryptic peptides correspond to the following plasma proteins: CNNLLAEK - Alpha-2-HS-glycoprotein; GCPDVQASLPDAK and TFTLLDPK - N-acetylmuramoyl-L-alanine amidase; LVLLNAIYLSAK - Plasma protease C1 inhibitor; GYSIFSYATK - C-reactive protein.
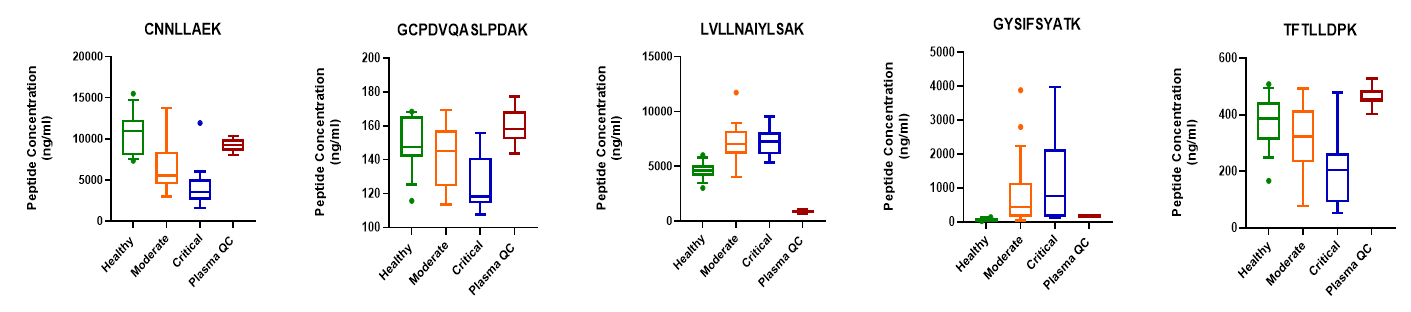
Figure 5. Four key peptide monitored. Individual chromatograms of four of the peptides monitored, showing how both the quantitative changes of a biomarker, but also the analytical performance contribute to the overall quality of the disease stratification test.
Analytical assay performance: In addition to the disease state stratification properties, potential biomarkers were also assessed on their analytical performance. Figure 6 shows the full chromatogram of all light transitions in a sample previously recorded as critical, showing excellent chromatographic performance and separation over a relatively short runtime.
Analytical sensitivity: As part of the assessment of each potential biomarker it was necessary to prove adequate sensitivity to detect sufficiently low concentrations in either the healthy or critical samples, depending on whether up- or down-regulation had occurred. Table 2 shows %CV values for quantification results generated for the top 5 identified biomarkers in all disease states, along with the limits of detection given in amounts on column.
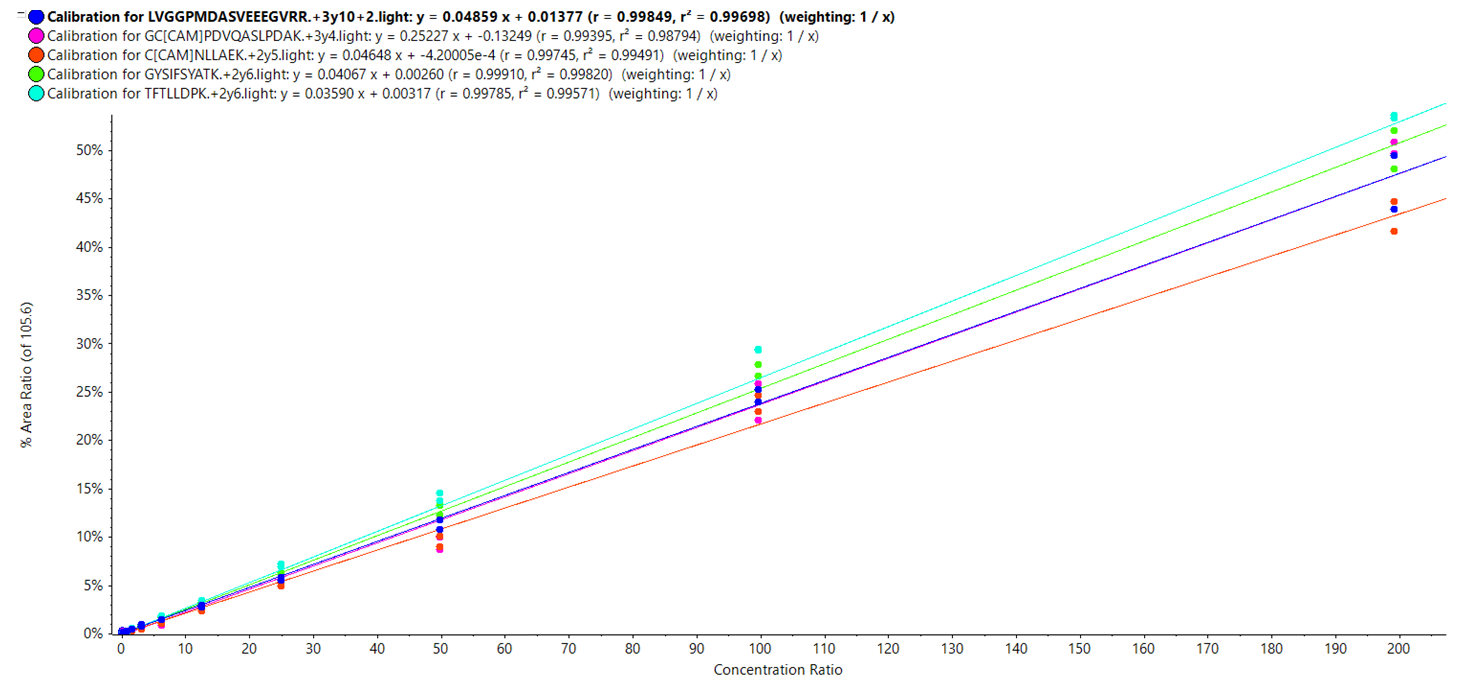
Analytical linearity: As accurate quantification is necessary for a high throughput and robust method; it was necessary to assess the linearity of response for each of the potential biomarkers in question. This was achieved across a calibration curve and examples of curves for the top 5 potential biomarkers are shown in Figure 7. Across the ranges analyzed, all top 5 potential biomarkers displayed a linearity (r2) of ≥ 0.99.
Figure 6. Chromatographic separation of the 52 peptides quantified in the multiplexed assay.
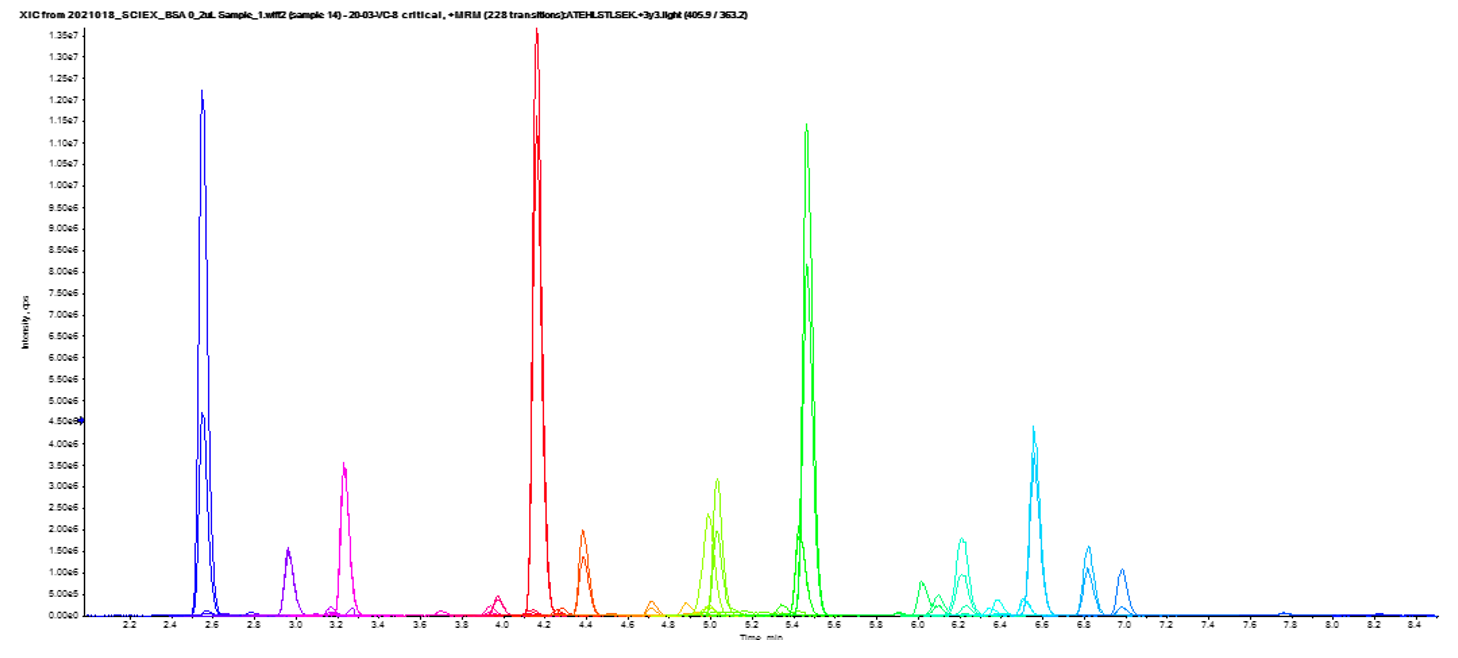
Table 2 Analytical performance & LOD data.
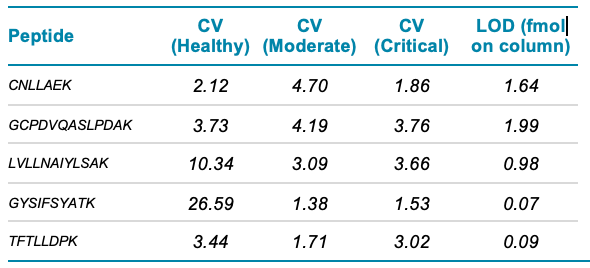
Figure 7. Calibration curves generated for the top 5 potential biomarkers.
Conclusions
Here the results of an investigation into the performance of a number of potential plasma protein biomarkers for the COVID-19 disease severity stratification are presented. The aim was to develop a high throughput, robust, simple and scalable quantification assay that had the potential to be considered for a number of applications. This includes disease severity classification to complement established procedures as well as assessing the treatment efficacy of novel therapies for COVID-19 or stratifying patient populations on clinical trials.
While it is clear that all 52 peptides monitored contribute to the overall disease stratification, a smaller number of the potential biomarkers could still stratify COVID-19 severity (Figures 2 & 3). The following 5 peptides were identified as top performers with respect to disease severity stratification and analytical performance metrics: CNLLAEK (Alpha-2-HS-glycoprotein), GCPDVQASLPDAK (N-acetylmuramoyl-L-alanine amidase), LVLLNAIYLSAK (Plasma protease C1 inhibitor), GYSIFSYATK (C-reactive protein) and TFTLLDPK (N-acetylmuramoyl-L-alanine amidase). Investigation of analytical performance of these 5 peptides shows %CV of <5% in moderate and critical disease state samples, limit of detection of between 1.99 and 0.07 fmol on column, and linearity (r2) of ≥ 0.99.
In a parallel study this panel of potential biomarkers was investigated further in a large and longitudinal cohort of 552 samples from 165 individuals2 where it successfully classified COVID-19 disease severity. There is significant potential to develop the assay further to assess its potential for COVID-19 outcome prediction in a prospectively collected patient cohort or rapidly include additional potential biomarkers should they be discovered. The reagents for the sample preparation and LC-MS/MS set up are available in a standardized kit format3 simplifying assay implementation.
References
- Demichev V et al. (2021) A time-resolved proteomic and prognostic map of COVID-19. Cell Syst. Aug 18;12(8):780-794.
- Wang Z et al. (2021) A multiplex protein panel assay determines disease severity and is prognostic about outcome in COVID-19 patients. MedRxiv Dec 05,2021.
- COVID19 Biomarker Panel (biorbyt).