EPA method 533 for PFAS analysis in drinking water at low parts-per-trillion levels
Using the SCIEX Triple Quad™ 5500+ LC-MS/MS System – QTRAP® Ready
Craig M. Butt1, Karl A. Oetjen1, Thep Phomsopha2
1 SCIEX, USA; 2 Eurofins ETA West Sacramento, USA
Abstract
PFAS drinking water analysis by EPA Method 5331 using the SCIEX 5500+ System. Excellent sensitivity and precision were as shown; the “in-sample” minimum reporting limits were 2 ng/L for all analytes except PFHpA which was 4 ng/L. Novel perfluorinated ether carboxylic and sulfonic acids were detected in 0.50 ng/mL standard, which corresponds to 2 ng/L in sample, significantly below the US EPA drinking water guidelines of 70 ng/L for PFOS and PFOA. Custom built calculations and flagging rules in SCIEX OS Software streamlined data review and report generation.

Introduction
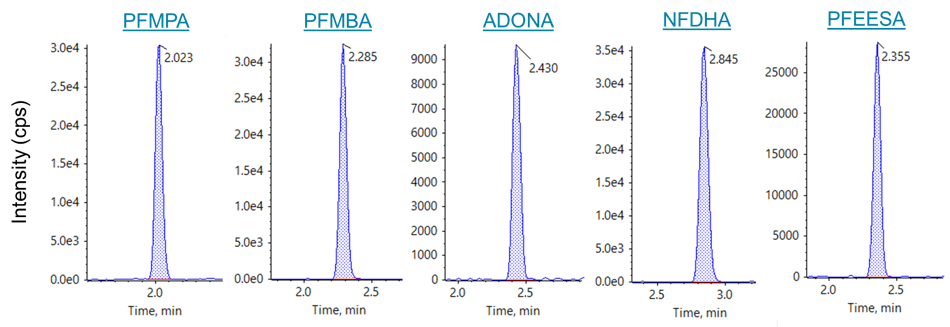
This application note describes PFAS drinking water analysis by EPA Method 5331 using the SCIEX Triple Quad 5500+ LC-MS/MS System – QTRAP Ready. Excellent sensitivity and precision were shown. The “in-sample” minimum reporting limits were 2 ng/L for all analytes except PFHpA (4 ng/L). Figure 1 shows MRM chromatograms for the novel perfluorinated ether carboxylic and sulfonic acids in the 0.50 ng/mL standard, which corresponds to 2 ng/L in sample. These values are significantly below the US EPA drinking water guidelines of 70 ng/L for PFOS and PFOA. Use of the custom built calculations and flagging rules within the SCIEX OS Software were used to streamline data review and report generation.
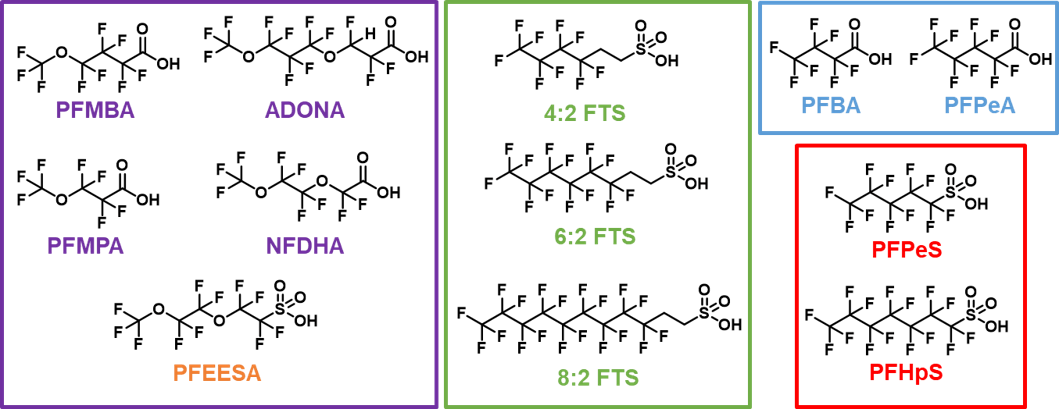
EPA Method 533 builds upon the previously published EPA Methods 537 and 537.1, but with notable differences. Several odd-chain PFSAs, short-chain PFCAs, FTS compounds and novel perfluoroether carboxylates and sulfonates were added, whereas the FOSAA acids (NEtFOSAA, NMeFOSAA) and long-chain PFCAs (PFTA, PFTrDA) were excluded. Structures of the novel compounds are shown in Figure 2. Similar to previous EPA methods, water samples are concentrated using solid-phase extraction (SPE) cartridges, but the choice of cartridge is flexible and the sample volume can vary from 100-250 mL. In addition, Method 533 incorporates the use of stable isotope dilution standards to minimize matrix effects and improve data quality.
Figure 1. MRM chromatograms for novel perfluorinated ether acids. MRM XICs for the novel perfluorinated ether acids are shown from the 0.50 ng/mL in-vial standard (2 ng/L in sample equivalent).
Key features of EPA method 533 on the SCIEX 5500+ System
- Existing methods were adapted to meet challenges of novel PFAS compounds
- Minimum reporting limits of 2 ng/L with excellent linear dynamic range were achieved
- Method showed good peak and chromatographic resolution of all compounds
- Data review and report generation was simplified through use of SCIEX OS Software custom calculations and flagging rules
Figure 2. Chemical structures of novel PFAS analytes added to EPA Method 533.
Methods
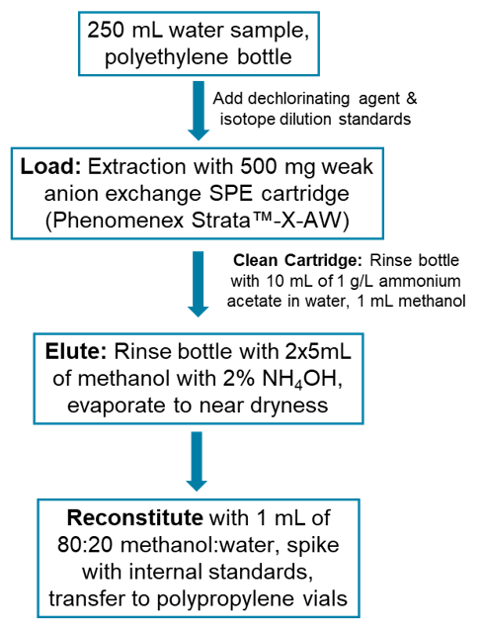
Sample preparation: Methods follow those outlined in the EPA Method 533 document1 and are presented in Figure 3. Briefly, the dichlorination agent and isotope dilution standards (EPA-533ES, Wellington Laboratories, Guelph, ON) were spiked into the 250 mL water samples. Samples were extracted and concentrated using 500 mg Phenomenex Strata™-X-AW SPE cartridges. The final eluent was evaporated to near dryness, reconstituted in 1 mL of 80:20 methanol:water and spiked with the instrument performance standards (EPA-533IS, Wellington Laboratories).
Chromatography: The SCIEX ExionLC™ system was used and chromatographic separation was achieved using gradient conditions with a Phenomenex Gemini C18 column (50 x 2 mm, 3 µm particle size). A delay column was used to separate the instrument PFAS contamination from the analyte peak. The mobile phases were water (A, modified with 20 mM ammonium acetate) and methanol (B) with a flow rate of 0.6 mL/min. The column oven was 40oC and the injection volume was 2 µL.
Mass spectrometry: Analysis was performed on the SCIEX 5500+ System with the Turbo V™ Ion Source using an electrospray ionization (ESI) probe in negative ion mode. Data were collected using the Scheduled MRM™ Algorithm using compound-specific and source and gas optimized parameters.
Data processing: Samples were processed with SCIEX OS Software 2.0 using the Analytics module. One MRM transition per analyte was monitored. Analyte responses were normalized to their respective isotope dilution standards (IDS). IDS recovery was calculated after normalizing the IDS response to the instrument performance standard (IPS). As per the method requirements, calibration curves were forced through the origin. Five replicates of the calibration standards were performed. Minimum reporting levels (MRL) were confirmed following procedures described in Section 9.1.4 of the EPA Method 533 guidelines. Briefly, 7 samples were fortified at the target MRL concentration, extracted and analyzed over 3 days. MRL concentrations were confirmed if the 99% predicted recovery was between 50-100%.
A unique feature of SCIEX OS Software is the ability to perform custom “Calculated Columns” and flagging rules within the Results Table. For example, EPA Method 533 requires that the IDS analyte recovery be between 50-200%, and the IPS be 50-150% of the average area measured during the initial calibration. To calculate these recovery values, a series of custom formulas were developed. Ultimately, the IDS and IPS recovery values were reported directly in the Results Table, and custom flags were created to alert the user to out of range values.
Figure 3. Sample preparation flowchart for EPA method 533.
Chromatography results
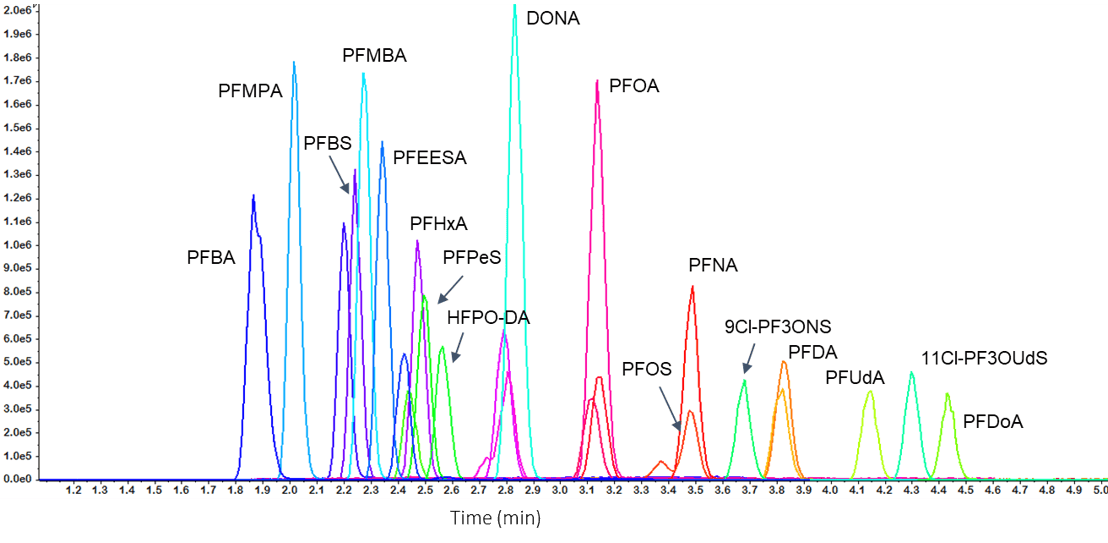
All analytes showed good peak shape with retention times ranging from 1.8 to 4.5 min (Figure 4). The short 8.5 min run time resulted in high sample throughput while maintaining good peak resolution. Poor peak shape was frequently a concern in the previous EPA methods (i.e. 537 and 537.1) for the earlier eluting PFAS compounds. However, for EPA Method 533 the peak symmetry is aided by the comparatively weaker vial composition of 80:20 methanol:water. Further, the peak asymmetry requirement has been eliminated in EPA Method 533.
EPA Method 533 includes 12 additional compounds representing perfluoroether carboxylates and sulfonates, fluorotelomer sulfonates, short-chain perfluorinated carboxylates and odd chain-length perfluorinated sulfonates. All of the novel PFAS compounds were analyzed with a standard PFAS chromatography program, that is, no changes were required to achieve satisfactory retention and peak shape.
Figure 4. Total ion chromatogram (TIC) of the 25 ng/mL standard. |
Sensitivity and linear dynamic range
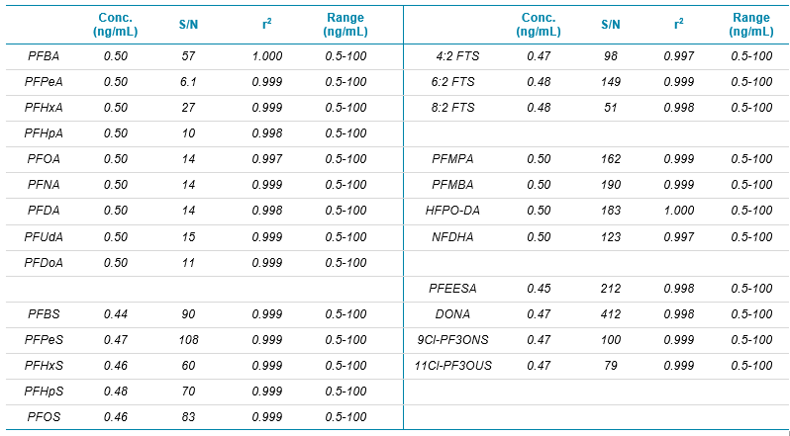
All PFAS compounds showed excellent sensitivity for the 0.50 ng/mL standard (1 pg on-column) which was the lowest calibration standard analyzed. MRM chromatograms for the 0.50 ng/mL standard of the novel EPA Method 533 analytes are presented in Figure 1, and signal-to-noise values are presented in Table 1. The 0.50 ng/mL calibration level represents an in-sample concentration of 2 ng/L due to the 250-fold SPE concentration. Mean signal-to-noise values for the 0.50 ng/mL standard, using the peak-to-peak algorithm, ranged from 6.1 for PFPeA to 412 for DONA. These results demonstrate that the in-sample LOQ values exceeded 2 ng/L, significantly below the current EPA drinking water guidelines for PFOS and PFOA.
Calibration curve linearity was excellent with r2 values greater than 0.999 for most PFAS compounds over the 0.5-100 ng/mL standard range (Table 1). The detection system of the SCIEX 5500+ System results in improved linear dynamic range as compared to older detectors. This is important for sample sets which contain wide variations in concentration, reducing the need for dilution and reinjection.
Figure 5. MRM chromatograms for novel perfluorinated carboxylic and sulfonic acids and fluorotelomer sulfonates from 0.50 ng/mL standard.
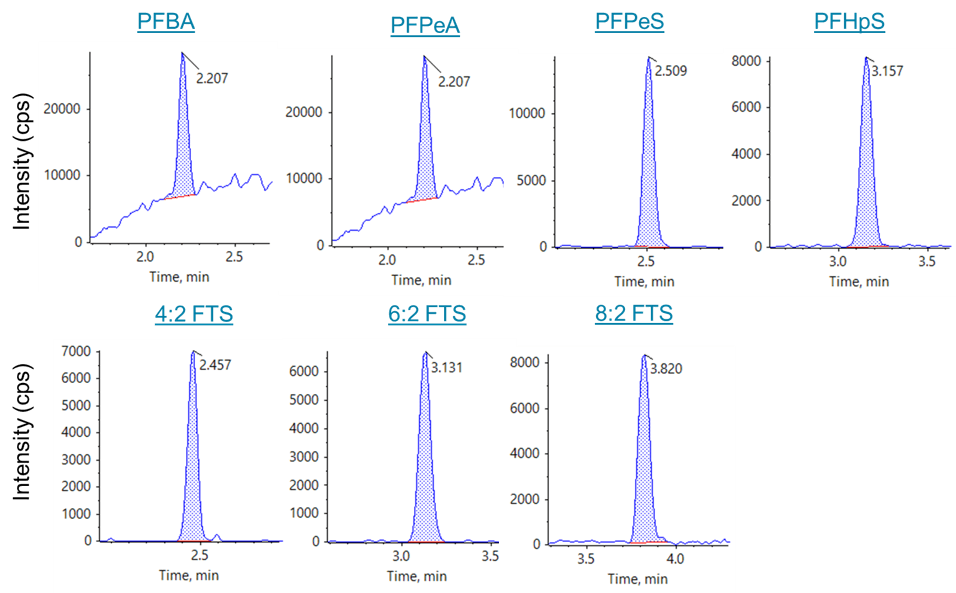
Table 1. Actual concentration (ng/mL) and signal-to-noise for the 0.50 ng/mL standard. Regression coefficient and concentration range for calibration curves.
Accuracy and precision
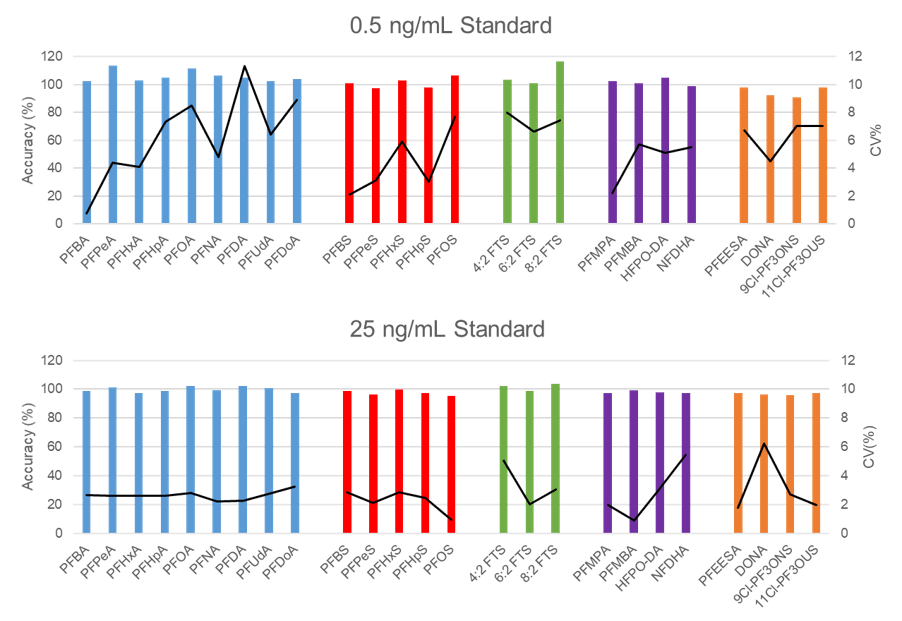
In addition to sensitivity, good accuracy and precision are crucial for strong data quality. Accuracy and precision were evaluated at the 0.50 ng/mL and 25 ng/mL standards (n=5). For both standard levels the accuracy was very good, generally 100% +/- 5% (Figure 6). Precision was also very good, the CV% was ~5% for the 0.5 ng/mL standard and ~2% for the 25 ng/mL standard.
Carryover
No analytes were detected in a blank injection after the 100 ng/mL standard injection demonstrating that carryover was insignificant.
Figure 6. Mean accuracy (primary y-axis, bars) and CV% (secondary y-axis, lines) of 0.50 ng/mL and 25 ng/mL standards (n =5). |
Minimum Reporting Level (MRL)
As outlined in the EPA Method 533 document, the MRL is calculated by analyzing a low-level spike 7 times during 3 consecutive days. Specifically, blank samples are spiked at the presumed MRL concentration and carried through the entire extraction process. The analyte recovery must be 50-150% at the 99% prediction level, and thus considers both accuracy and precision. The in-sample MRL concentration was 2 ng/L for all analytes with the exception of PFHpA, which was 4 ng/L.
Custom calculations and flagging
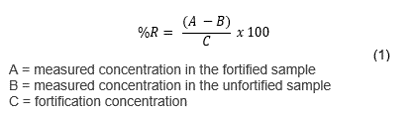
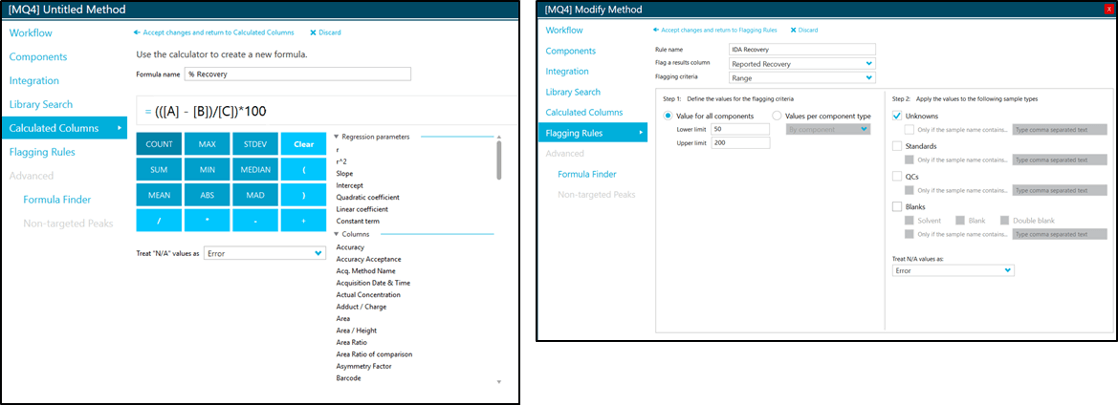
EPA Method 533 requires specific method performance and quality control criteria that require the analyst to complete several calculations. These calculations can become tedious when repeated for the 25 analytes required by the method. However, calculated columns in SCIEX OS Software 2.0 allows the analyst to automate these calculations. For example, EPA Method 533 requires the calculation of the concentration of each isotope dilution analogue recovery in both field and QC samples. This concentration is calculated using the average area in the initial calibration and the internal standard technique (Figure 6). Typically, analysts would need to transfer data into an additional data processing software (e.g. Microsoft Excel). However, using calculated columns, this recovery (%R) can be calculated directly in SCIEX OS Software:
 Click to enlarge
In addition, custom flags can be created to alert the user to out of range values (Figure 7). The user can select either constant values for all analytes, or input unique values for each analyte. The custom flagging can be selectively applied to the unknowns, standards, QC or blanks. Further, it is possible to apply the flagging rule to specific sample names. The flexibility and versatility of the user-generated flagging rules is very useful for data review and report generation.
Figure 7. Example screen shots for user-generated calculated columns and flagging rules in SCIEX OS Software.
Conclusions
Here a method has been developed on the SCIEX 5500+ System to meet EPA Method 533 requirements.
- The chromatography used provided good peak shape and resolution and was adapted from existing chromatography methods
- The method met the minimum reporting limits of 2 ng/L with 3 orders of dynamic range for most compounds
- Novel perfluorinated ether carboxylic and sulfonic acids were detected in the 0.50 ng/mL standard (2 ng/L in sample), easily meeting the US EPA drinking water guidelines of 70 ng/L for PFOS and PFOA
- Finally, custom calculations and flagging rules reduced time for data review and simplified report generation
References
- Rosenblum, A. and S.C. Wendelken. Method 533: Determination of per- and polyfluoroalkyl substances in drinking water by isotope dilution anion exchange solid phase extraction and liquid chromatography/tandem mass spectrometry. United States Environmental Protection Agency, Washington, November 2019.