Development of a targeted LC-MS/MS method for the detection of microbial Transglutaminase from Streptomyces mobaraensis
Peptide quantification using a QTRAP® 6500+ LC-MC/MS System coupled to an ExionLC™ System
Rebekah Sayers and Jianru Stahl-Zeng
SCIEX, UK and SCIEX, Germany

Introduction
The so-called “meat glue enzyme” transglutaminase is used by the meat industry to add value to meat by gluing together smaller scraps into a larger piece. Transglutaminase can be used to cross-link smaller pieces of any type of meat, fish, or meat product, to produce large, virtually intact sections. This has raised several food safety concerns. Specifically, the transglutaminase enzyme is the target antigen of antibodies found in the serum of patients suffering from coeliac disease. A rapid and robust analytical method is necessary to ensure the protein content is correctly determined and consumers can be confident in the origins of their food.
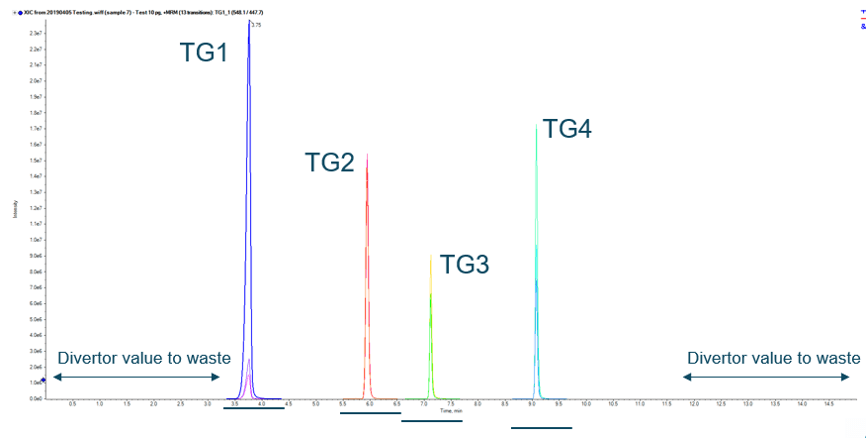
The detected enzyme, microbial transglutaminase (MTG) from Streptomyces mobaraensis, consists of 331 amino acids. The following tryptic peptides are characteristic markers of MTG: VTPPAEPLDR (TG1), SPFYSALR (TG2), LAFASFDEDR (TG3) and GAYVITFIPK (TG4). 1,2 The detection of these marker peptides was carried out after chromatographic separation by HPLC using a RP-C18 column and subsequent detection using MS/MS. In each case three MRM transitions were measured for each marker peptide. Peptide detection was confirmed if all three mass transitions had a signal-to-noise ratio of at least 3:1. The detection of MTG protein would then be considered positive if at least three of the four peptide markers were detected.
A rapid and robust analytical method is required to ensure the protein content is correctly determined and consumers can be confident in the origin of their food. In this work, an improved analytical LC-MS/MS method is presented which utilizes multiple reaction monitoring (MRM) to detect 4 target peptides for microbial transglutaminase from Streptomyces mobaraensis (Figure 1).
Key features of the targeted LC-MRM method
- With an increasingly health conscious consumer base, the demand to test for adulteration and authenticity of food products is growing
- An existing method was optimized to a more commercially viable one. This was aided by using DiscoveryQuant™ Software for automated optimization of method parameters and the Scheduled MRM™ Algorithm for time scheduled MRM transitions to maximize dwell times.
- The reproducibility and robustness of the resulting measurements was confirmed with a %CV < 6.55
- The assay showed sensitivity levels in pg/µL.
Figure 1. Chromatographic Separation of Peptides. Extracted Ion Chromatograms (XICs) for the three MRM transitions for each of the four peptides from transglutaminase by LC-MS/MS.
Methods
Sample Preparation: Peptide standards synthesized by JPT peptide technologies were reconstituted in 0.1% formic acid in 90% water 10% acetonitrile to a stock concentration of 5 mg/mL. The stock was then diluted in chromatographic buffer A to prepare a calibration series in the range 0.01-100 pg/µL.
Chromatography: An ExionLC™ System with a Phenomenex Aeris peptide 1.7 µ XB C-18 150 mm column at 40 °C with a gradient of 2 to 70% acetonitrile over 10 min in 0.1% formic acid was used at a flow rate of 300 μL/min. The injection volume was set to 2 μL. Total run time was 15 minutes.
Mass Spectrometry: A SCIEX QTRAP® 6500+ LC-MS/MS System operated in low mass mode equipped with Turbo V™ Ion Source was used. Analyst® Software 1.7.1 was used for data acquisition. The enzyme was detected initially using 3 MRM transitions per peptide to allow quantification and identification based on the ratio of quantifier and qualifier transitions as defined by regulation 2002/657/EC. Every sample was analyzed in triplicate.
Data Processing: Samples were analyzed in triplicate and data processed using SCIEX OS-MQ Software to perform quantification and statistical analysis. Peak picking and integration were performed using the AutoPeak integration algorithm.
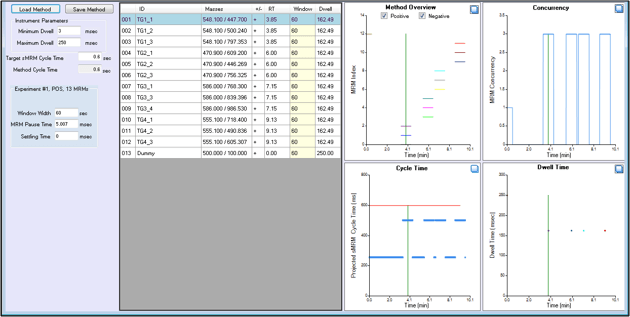
Figure 2. sMRM calculator for easy time scheduling MRM transitions. User inputs the peptide retention time, the target cycle time for the method and the desired MRM detection window width and the tool computes the concurrency and probable dwell times that will be used in the method. This allows the user to optimize the inputs before building the final method with Scheduled MRM Algorithm.
Optimization of the targeted peptide method
First, the MRM transitions for each of the target peptides were optimized using DiscoveryQuant Software using peptide standards. DiscoveryQuant Software significantly increases productivity by simplifying and expediting LC–MS method development cycle time for sensitive and selective assays, without compromising data integrity. The three most intense MRMs for each peptide were selected and the compound dependent parameters (CE and DP) were optimized.
Next using the optimized chromatography (Figure 1), the retention times for each peptide were determined such that MRM acquisition could be scheduled in time using the Scheduled MRM Algorithm (Figure 2). The Scheduled MRM Algorithm detects MRM transitions during a short retention time window only, this allows many more MRM transitions to be monitored in a single LC run, while still maintaining maximized dwell time and optimized cycle time for best accuracy and reproducibility.3
To build a method using the Scheduled MRM Algorithm, the sMRM calculator tool in Analyst Software can be used for optimizing inputs. The user inputs the MRM retention times, the MRM detection window, and the targeted scan time and the tool computes the projected concurrency and dwell times. This then allows the user to adjust the method inputs for best results before building the final method with the Scheduled MRM algorithm.
This two-step process produced a fully optimized LC-MS/MS method for the quantification of transglutaminase peptides from Streptomyces mobaraensis.
Determination of assay sensitivities
Calibration curves were constructed from a standard mix of the peptide markers (TG1-4) spiked into chromatographic buffer A to give final concentrations of 0.01-100 pg/µL. Assay sensitivities were determined using a minimum of two transitions per peptide with a signal-to-noise ratio >3:1. Calibration plots for quantifier and qualifier marker peptides are shown in Figure 3. Assay sensitivities, accuracies and %CV are shown in Table 1. Good performance of the peptides was observed, next steps will be to test in matrix to determine sensitivity and specificity in matrix.
Figure 3. Calibration plots for the four marker peptides. Here the calibration curves from 0.01-100 pg/µL are shown for the quantifier (blue) and the qualifier (pink), with a 1/x weighting and R2 > 0.99.
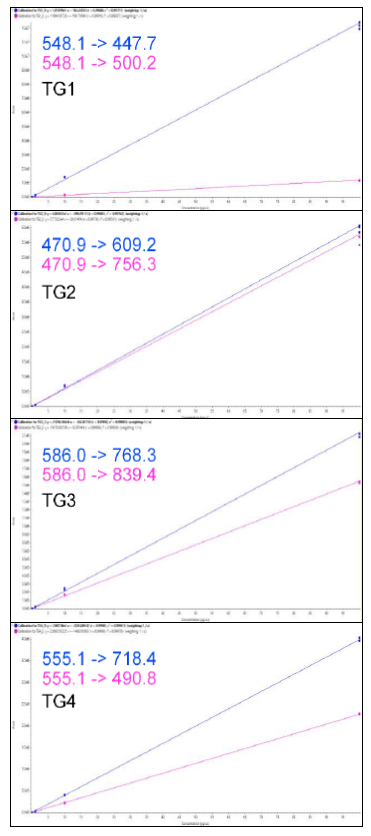
Table 1. Quantifier and Qualifier marker peptide transitions and assay sensitivities. The lower limits of detection (LLOD S/N > 3:1) and quantification (LLOQ S/N > 10:1) are shown for the calibration curves run in buffer. The reproducibility at both the LLOD and the LLOQ are reported as mean % CV. All assay sensitivities are shown in pg/µL.
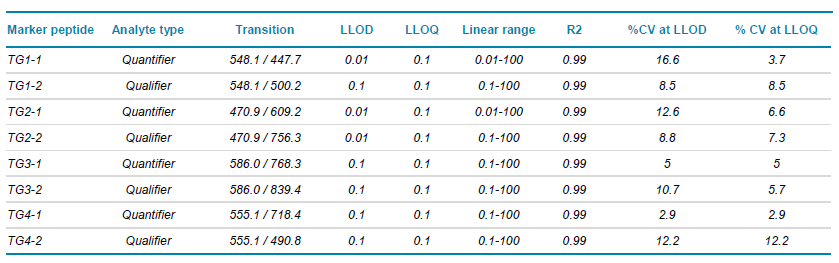
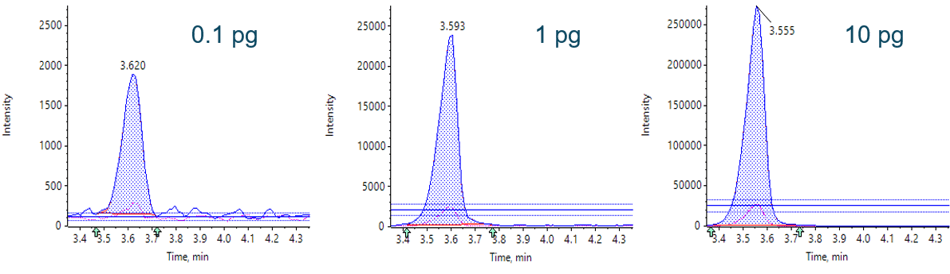
Figure 4. Example MRM transitions. Extracted ion chromatograms (XICs) of low, middle and high concentrations, quantifier and qualifier for TG1 peptide.
Conclusions
This work highlights a streamlined workflow for initial development of a targeted peptide method. The resulting analytical method provided reproduceable measurement of peptide targets found in MTG from Streptomyces mobaraensis in simple matrix. Multiple reaction monitoring (MRM) was used because of its high selectivity and sensitivity.
- The method parameters were first optimized using DiscoveryQuant Software from peptide standards
- Then, retention times were determined such that Scheduled MRM Algorithm could for best sensitivity and reproducibility
- The total HPLC run time was 15 minutes for higher throughput analysis
- Multiple peptides for the protein were monitored and two transitions per peptide are used for quantification
- Peptide detection was confirmed if both mass transitions had a signal-to-noise ratio of at least 3:1
- Preliminary sensitivity of the MRM method was confirmed for the measurement of MTG in simple matrix using a dilution series of peptide standards, and good linearity from 0.01-100 pg/µL
- Next steps are to test this method in meat products to determine whether assay meets the required sensitivity limits
References
- Jira, Wolfgang, and Fredi Schwägele. (2017) A sensitive high performance liquid chromatography–tandem mass spectrometry method for the detection of microbial transglutaminase in different types of restructured meat. Food chemistry 221, 1970-1978.
- Jira, Wolfgang, and Siegfried Münch. (2019) A sensitive HPLCMS/MS screening method for the simultaneous detection of barley, maize, oats, rice, rye and wheat proteins in meat products. Food chemistry 275, 214-223.
- The Scheduled MRM™ Algorithm Pro - Automated Intelligent Design of High Throughput, High Quality Quantitation Assays. SCIEX technical note RUO-MKT-02-8539-A