Identification and quantification of PFAS in food contact materials using MRMHR Workflow on X500R QTOF System
Wang Sha, Liu Bingjie, Cheng Haiyan, Li Lijun, Jin Wenhai
SCIEX, China

Introduction
In comparison to other surfactants, perfluorinated alkyl substances (PFAS) have stable physiochemical structures with hydrophobic and oleophobic properties. They are widely used in industrial and consumer products like plastic packaging materials for food and as coating in non-stick pans. Due to their chemical stability and low reactivity, PFAS are highly resistant to degradation even in living organisms and can therefore be accumulated in the food chain. Human exposure to PFAS residues has been implicated in incidences of cancer, obesity, endocrine system disruption and other adverse health effects. [1]
With the rapid growth in the food delivery industry in China (and globally) in the past two years, one-time-use plastic packaging materials are widely used by merchants due to their low cost and high durability [2]. One-time-use plastic has become a source of public concern and environmental pollution. Given the tremendous persistence of PFAS in the environment and the adverse effect on human health, monitoring of PFAS residue has gained traction in China and elsewhere.
In China, the level of PFOS and PFOA in food contact materials and products is regulated according to the latest National Food Safety Standard (GB 31604.35-2016). The detection limit is set at 1.0ng/g while the quantification limit is set at 2.0ng/g. In 2006, the European Union (EU) has set a regulation that the level of PFOS in finished products should not exceed 0.005% of the product mass.
The X500R QTOF System has the industry’s fastest scanning speed, allowing for the implementation of the unique MRMHR acquisition mode to provide excellent quantitative performance using high-resolution MS/MS data. This approach to quantitation with LC-QTOF-MS/MS minimizes matrix interferences and the Turbo V Ion Source with curtain gas interface, twin sprayer technology and built-in automatic calibration system help to improve and maintain instrument robustness and maintain high mass accuracy results. The high resolution MS/MS spectra can also be used for qualitative analysis by calculating the ion ratio for confirmation, thus reducing false positives by taking advantage of the data acquired on the LC-QTOF platform.
Key Workflow Advantages
- PFAS quantitation using an easily established method and minimal method development
- 10-minute run time using a Phenomenex Kinetex® C18 column demonstrates separation of PFAS targets
- MRMHR workflow using MS/MS for selectivity vs high resolution TOF MS mode provides improved signal-to-noise
- QTOF technology can be utilized for quantitative analysis of PFAS suite without compromising method performance (excellent sensitivity, linearity demonstrated)
Figure 1. Signal-to-noise comparison of PFHpA using TOF-MS and MRMHR data using a post spiked 0.2 ppb matrix blank. Monitoring the transition and the high resolution fragment ion results in greater specificity and reduced baseline, so signal-to-noise demonstrates marked improvement and method sensitivity is maximized.

Methods
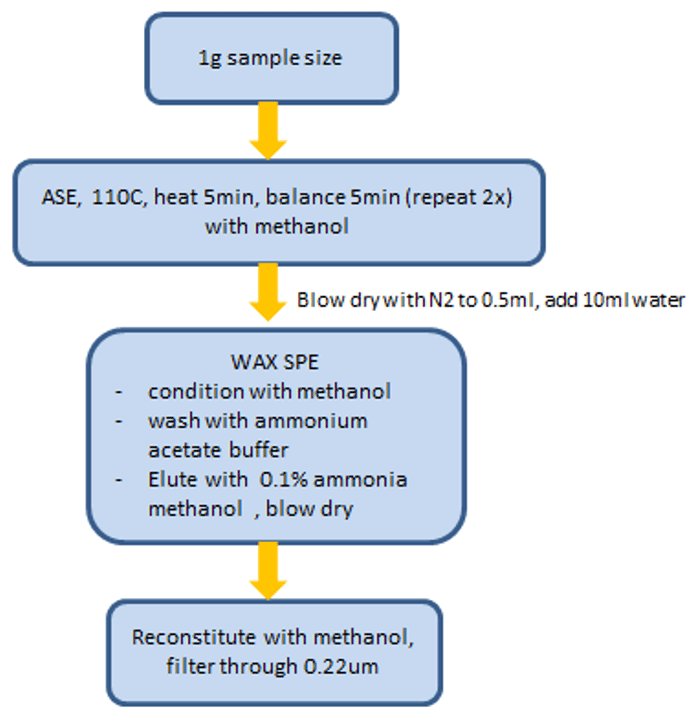
Sample preparation: The food packaging material to be tested is cut into small pieces. For coating sample, scrape it with a small knife. The sample preparation procedure was adapted from National Standard of China (document number GB 31604.35-2016) which is implemented on 19 April 2017 (Figure 2).
A total of eight samples were collected as test samples which include disposable meal box, plastic bag, beverage bottle, coating of non-stick pan, etc. Packaging materials in the collected samples were mainly polyethylene, polystyrene and polytetrafluoroethylene.
Figure 2. Extraction and clean-up process flow diagram
Chromatography: Using the SCIEX ExionLC™ AD System with a Phenomenex Kinetex, 2.6μm C18, 100 X 2.0 mm, compounds were separated using a gradient elution with mobile phase A of 5mM NH4AC in water and mobile phase B of 5mM NH4AC in methanol (flow rate of 0.3 mL/min, column temperature 40 ºC).
Mass spectrometry: The SCIEX X500R QTOF System was used analyse the compounds operating in negative ion polarity using the Scheduled MRMHR acquisition mode (Table 1). Source conditions were as follows: CUR of 30psi; CAD of 7; IS of -4500V; Temp 500 ºC; GS1 of 50psi; GS2 of 55psi.
Data processing: All data was processed with SCIEX OS Software.
Table 1. Scheduled MRMHR method setup in SCIEX OS Software. Unique RTs can be defined for each transition for each analyte.

Establishing the Scheduled MRMHR Quantitative Method
The SCIEX OS Software is fully automated with a user-friendly interface, greatly reducing the time to establish the acquisition method. The MRM parameters can be set up easily in two different ways. For compounds which are in MS/MS spectral library, fragment ions can be imported easily from the library to build the MRMHR method list. Up to 5 fragment ions can be imported at the same time using a single click. For compounds not found in the spectral library, spectra can be added easily to the library using TOF MS-IDA-MS/MS data acquired for standards of the desired targets.
MRM parameters like retention time, declustering potential (DP) and collision energy (CE) from an existing triple quadrupole method are fully transferrable.
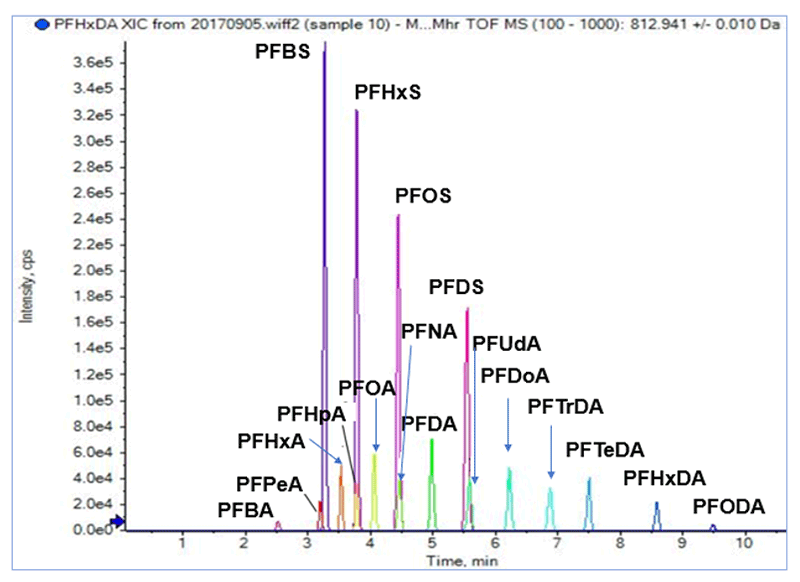
Figure 3. TOF MS extracted ion chromatogram of 17 PFAS. Good separation was achieved for most of the 17 PFAS compounds analysed.
MRMHR Quantitation of PFAS
Chromatogram of 17 PFAS utilizing extracted precursor ion data from TOF-MS scan are shown (Figure 3).
High selectivity data: Comparing 0.2 ppb post spiked in matrix blank, PFHpA show higher selectivity in MRMHR mode as compared to TOF-MS mode for quantification (Figure 1). Monitoring the high resolution fragment ion from the full scan MS/MS data collected provides greater specificity and reduced baseline, so signal-to-noise demonstrates marked improvement and method sensitivity is maximized.
Linearity and accuracy: The 17 monitored PFAS demonstrate good linearity and accuracy (Figure 4) with the correlation coefficients above 0.99. Accuracy values are within the permissible deviation range for LOD and LOQ according to the national standards.
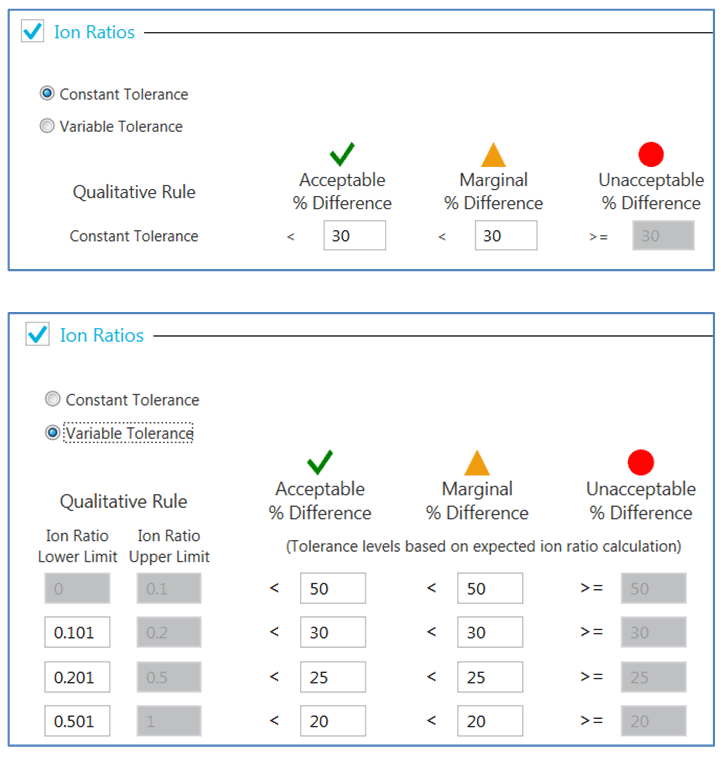
Ion ratio calculations: Ion ratios can be easily calculated using the SCIEX OS software. Ion ratio confirmation can be visually displayed in the chromatogram and result table. Depending on the requirement, the confirmation tolerance can be defined using either constant tolerance or variable tolerance as shown in Figure 5.
Figure 4. Calibration curve of 17 PFAS with acceptable accuracy and linear response.

Figure 5. Setting up tolerance for ion ratios confirmation. Constant tolerance (same percent difference from measured standard ion ratio) or variable tolerance (varying percent difference dependant on concentration level) can be utilized when determining whether an unknown same meets the criteria for qualitative analyte identification by ion ratio confirmation. Different levels of percent difference can be defined by the user to be flagged as within “Acceptable,” “Marginal,” or “Unacceptable.”
Detection of PFAS in food contact materials
SCIEX OS Software combines both qualitative and quantitative results in one single interface (Figure 6). The result table show the retention time, concentration, peak area, ion ratio confirmation and the mass error of 0.9ppm for a sample tested positive with PFOA.
Among the eight samples, eight types of PFAS were detected as shown in Table 2. Two out of eight samples have levels which exceeded regulated level of 1ng/g by national standard. Most of the detected PFAS are the acid derivatives of PFOA and primarily found in non-stick pan coating and disposable meal boxes. The number of actual samples collected in this test is rather small; hence statistically it does not imply that all related products are unsafe for consumers.
Figure 6. PFOA results in actual sample.
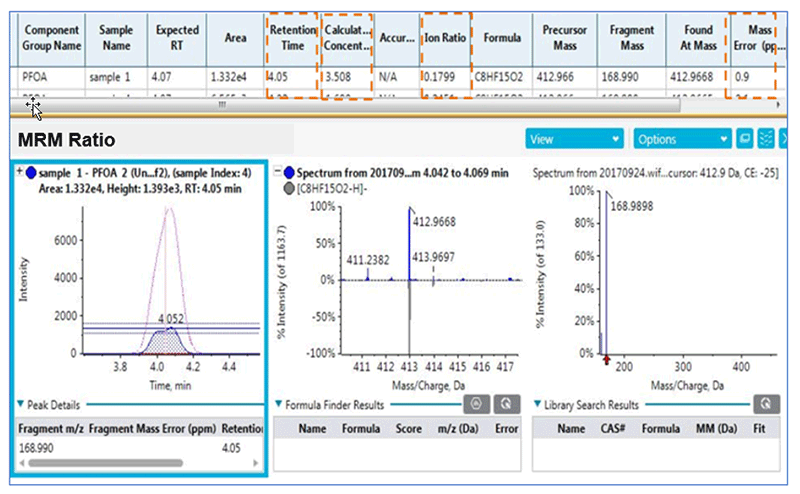
Table 2. PFAS Content in Different Food Contact Samples.

Summary
The SCIEX X500R QTOF System and SCIEX OS Software brings powerful performance capabilities for routine testing of PFAS. The unique MRMHR quantification method enables high selectivity even in real sample with matrix interference. This improves the detection and quantification of PFAS which can meet the EU regulation and national standards in China.
Although the concentration of PFAS in most of the test samples falls below the regulated level, the detection rate of perfluorinated alkyl substances is relatively high indicating that the quality of food contact/packaging materials may pose potential risks on consumer’s health.
References
- Xu R, Tan H, Yang H B, et al. (2014) Food and Fermentation Industries, 40(10): 205.
- Kannan K, Tao L, Sinclair E, et al. (2005) Arch Environ Con Tox, 48: 559.
- GB 31604.35-2016, National Food Safety Standard - Food contact materials and products - Determination of perfluorooctane sulfonate (PFOS) and perfluorooctanoic acid (PFOA).