SWATH® Acquisition LC-QTOF-MS/MS analysis of food colors and illegal dyes in spices
Aurélie Périat1 and Nicolas Mottier1, Michael Scherer2
1Official Food Control Authority of the Canton de Vaud, Epalinges, Switzerland; 2SCIEX, Switzerland
Abstract
In this study, a sensitive, robust, and fast method based on SWATH® Acquisition and data analysis was developed to determine and identify ninety-eight food colors and dyes in spices. High resolution MS and MS/MS data were collected using a SCIEX X500R QTOF System in both positive and negative modes in order to take into account the differences in ionization between the lipophilic illegal dyes and the hydrophilic artificial colors.

Introduction
Natural or artificial colors are added to many foods to enhance their attractiveness and compensate for either alterations or losses that could occur during processing or storage. Due to their low cost, effectiveness and excellent stability, artificial colors are usually preferred by the food industry over natural ones [1, 2]. Sudan dyes are a class of lipophilic azo dyes that are widely used for different industrial and scientific applications (coloring of fuels, waxes or oil, staining for microscopy, etc.) because of their colorfastness and low price. Since they are cheap and widely available, Sudan dyes are also attractive as food dyes as they can improve their appearance. However, due to the carcinogenicity of their metabolites, they are banned for food usage in most countries, including in the EU. Nevertheless, over the last years, these dyes have been found in various foodstuffs whether spices, tomato sauces or else [3]. In the case of spices, the Swiss legislation does not allow for the addition of food colours except for quinoline yellow (E104) that can be added to curry and tandoori preparations.
A suitable screening analytical method, amenable for both the lipophilic Sudan-type illegal dyes and the hydrophilic artificial ones, is required for their fast detection and identification. The SWATH Acquisition mode for MS/MS collection used by the X500R QTOF System allows for the simultaneous targeted and non-targeted screening of samples. The exact mass and MS/MS data provided produces sufficient data to confidently identify the analytes of interest but also identify unknown chemicals that may also be present in the sample.
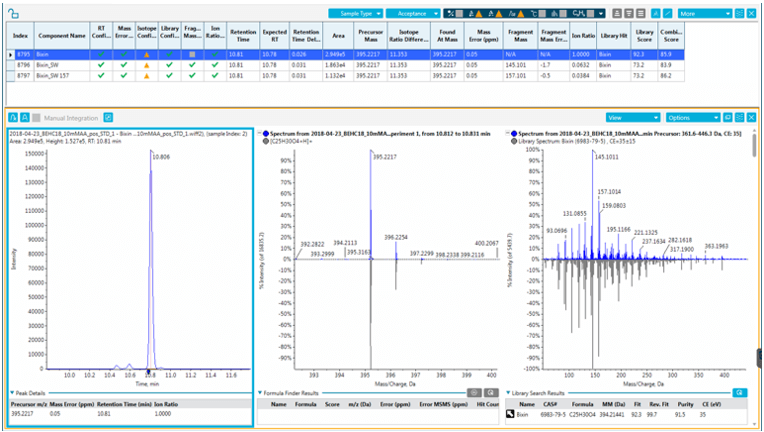
Figure 1. Results for a couscous sample adulterated with bixin (precursor mass, isotope distribution and MS/MS spectra).
Key advantages of SWATH Acquisition for dyes analysis
- Ensure collection of MS/MS data for every precursor in a complex spice sample, without missing any precursors due to low-level residue
- Confidently identify target dyes, food colours of importance based on collected MS/MS information and known formulae
- Create a custom spectral library using standards that can be employed to identify unknown component peaks in a sample
- Achieve extremely low false positive and false negative reporting rates using accurate mass information attained by the QTOF high resolution accurate mass platform
Methods
Samples: Approximately 1 g of spice was weighed and extracted for 30 minutes with a quaternary solvent mixture of water/methanol/acetonitrile/tetrahydrofuran (9:1:5:5 v/v/v/v).
The solution was centrifuged for 5 minutes at 2500 rpm and an aliquot of the supernatant was then filtered using a 0.2 mm PTFE filter into an amber LC-vial containing three internal standards (Sudan I-d5, Sudan III-d6, Congo Red-d8).
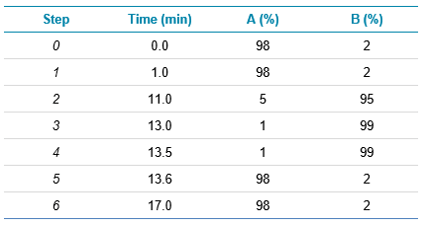
LC separation: 2 mL of the spice extracts were injected onto an ExionLC™ AD System coupled to an X500R QTOF System equipped with the Twin Sprayer probes. Separation was performed using a gradient on a Waters BEH UPLC column (1.7 mm, 2.1 x 100 mm) using a mobile phase consisting of an ammonium acetate 10mM buffer (A) with methanol (B) at a flow-rate of 0.5 mL/min and column temperature of 50 °C. Gradient conditions are listed in Table 1.
Table 1: Gradient conditions used for the LC separation and subsequent identification of the target dyes.
SWATH Acquisition method: Analyses were performed using the Turbo V™ Source in both negative and positive modes. The source temperature was set at 500 °C, the ion source gases 1 and 2 at 45 [AU], the curtain gas at 35 and the CAD gas at 7 [AU]. For the positive mode, the spray voltage was set at 5.5 kV and for the negative mode at -4.5 kV.
The TOF MS survey scan was performed from 120 to 1200 Da using these parameters for the positive mode: the declustering potential was set at 50, the accumulation time at 0.1 second and the collision energy at 10 V. For the negative mode, the declustering potential was set at -80, the accumulation time at 0.1 second and the collision energy at -10 V.
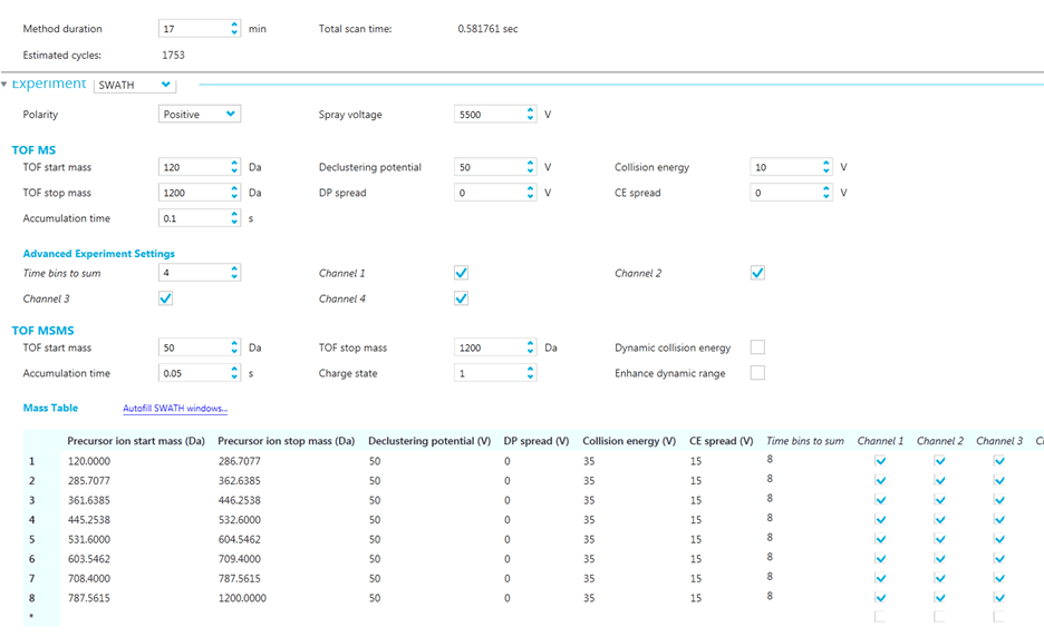
Analytes were detected by SWATH Acquisition using eight windows according to table presented in Figure 2. The following parameters were used in positive mode: the declustering potential was set at 50, the collision energy at 35 V with a spread of 15 V. For the negative mode, the declustering potential was set at -80 and the collision energy at -35 V with a spread of 15 V. The accumulation time for both modes was 0.05 seconds. The variable SWATH Acquisition windows were optimized by evaluating the ion density over the whole chromatographic range of twelve different spices (paprika, curcuma, sweet paprika, hot chili) and spice blends (curry, satay, tandoori, garam masala, couscous ras-el-hanout, Cajun and a “seven spices” mix).
Figure 2. MS method setup in SCIEX OS Software. The SWATH Acquisition is defined by the precursor mass windows and the MS/MS acquisition parameters.
Library: In order to create the in-house library, and since most dyes had purity levels below 95%, they were injected using the LC method described above in IDA mode. This had the advantage of ensuring that the MS spectra were of the highest purity available. The MS/MS libraries were built at six different energy collisions: 20, 30, 40, 50 V and 35 +/-15 V and 40 +/-20 V. In the case of compounds that could be ionised in both positive and negative modes, both were added to the library.
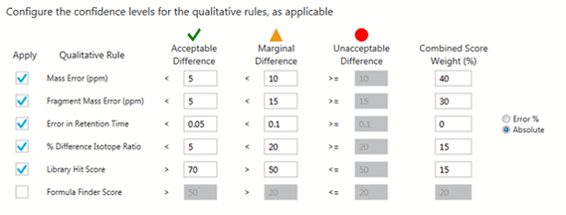
Data processing: Data was processed using the SCIEX OS Software. The set-up of the peak finding criteria was done using Analytics. The criteria for the traffic lights which allows for data review and filtering can be seen in Figure 3.
Figure 3. Qualitative rules applied for data processing. These are user-defined means of flagging results as confident matches within a set of acceptable tolerance limits for multiple parameters.
Results - validation
Forty-one compounds were selected for the validation based on their color and their relevance to the study (mostly Sudan-type dyes and artificial ones). Two spices were used for validation: ground paprika and curry. Both extracts were spiked in a manner that they contained between one and thirty-two compounds. In total, forty vials were thus prepared with each analyte added randomly in twenty of them.
As established for screening methods, selectivity and specificity as well as the false positive and false negative rates were determined with these solutions. The vials were injected onto the LC-MS using, throughout the sequence, the integrated Calibrant Delivery System (CDS) with the Twin Sprayer probe to maintain the mass accuracy.
After reprocessing the false positive rate was determined as 0% for all compounds whereas the false negative rate was 0% except for Amaranth (E123) and Reactive Red 195 with rates of 10% and 5%, respectively. These results highlight the excellent identification capabilities of the instrument. The mass error of the precursor ion did not exceed +/- 2 ppm for 81% of measurements (out of 494 in total) in the negative mode and 63% in the positive mode (out of 646). Only 2% of the negative mode measurements (3% in the positive mode) were comprised between +/- 5 and +/- 10 ppm and none were above +/- 10ppm.
Intra-day repeatability was assessed using both curry and paprika extracts and a representative subset of compounds. It was determined by injecting ten times the same vial in each mode successively. The parameters monitored were the retention time (RT), the raw area, the mass error and the false negative rate at the detection level. The coefficients of variation (CV) of the RT were in average below 1% for all compounds, except for Tartrazine and Acid Yellow which were nonetheless lower than 5%. In terms of false negative results, Para Red did not meet the criteria for detection (n=10) in one instance as the mass error was higher than 5 ppm at -6.4 ppm in the negative mode. Similar results were obtained with the paprika extract.
Table 2: Intraday repeatability and summary of the results obtained in terms of raw area and number of false negatives for the curry extract.
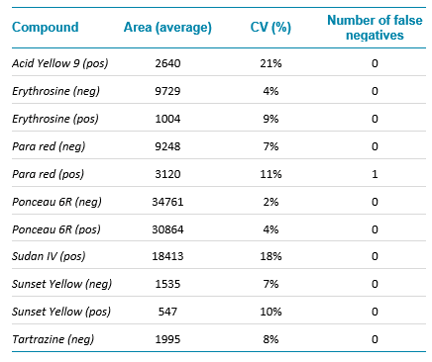
Figure 4. Ion ratios obtained for bixin with two SWATH Acquisition fragments.
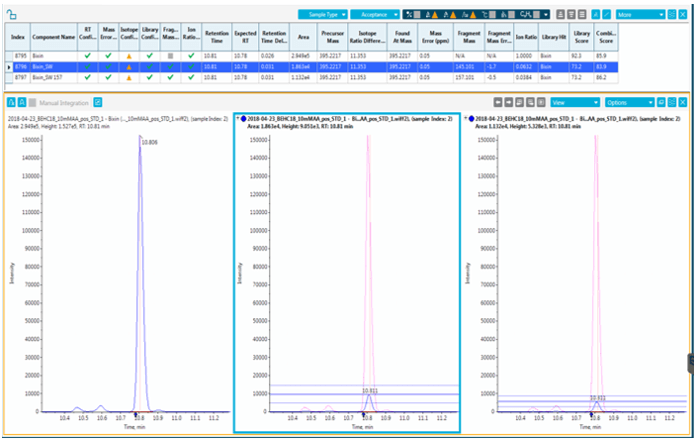
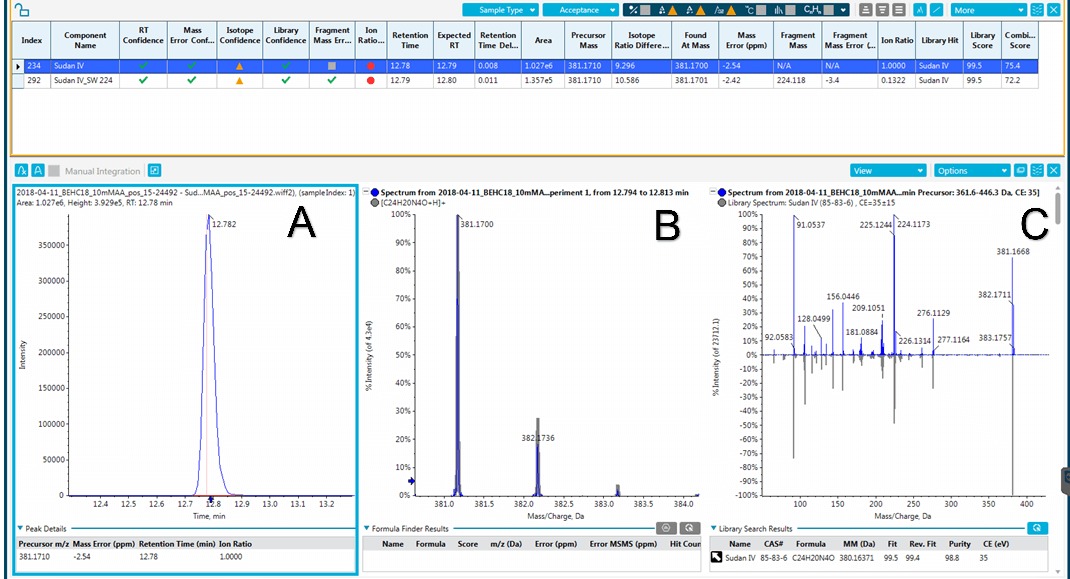
Figure 5: Qualitative results for a sample contaminated by Sudan IV. A) Chromatographic peak showing precursor and retention time. B) High resolution MS data including matching the observed isotope pattern to that of the target analyte. C) Matching of the MS/MS spectrum collected by SWATH Acquisition to that of the target analyte in the spectral database.
Conclusions
A new screening analytical method was developed to detect and identify both lipophilic Sudan-type illegal dyes and the hydrophilic artificial ones in spices. A simple solvent extraction was used and a common LC method was optimized for the analysis of 98 dyes that were added to the custom library. Forty-one colours and dyes were selected for the validation. A high degree of mass accuracy was obtained with the X500R LC-QTOF System at sufficient mass resolution regardless of the matrix type. The screening method was applied to spice samples. Sudan IV, an illegal dye, was identified with a high confidence level in a paprika sample whereas a natural food colour, bixin, was detected in a couscous spice blend. The concurrent SWATH Acquisition and TOF-MS data provided excellent means of identification thanks to the accurate mass of the fragments and their ion ratios in addition to the accurate mass of the precursor ion and its’ isotopic distribution. Furthermore, this type of acquisition would also allow for the retrospective analysis of suspect samples should a new “emerging” dye appear.
References
- Oplatowska-Stachowiak M, Elliot C., (2017) Food colors: Existing and emerging food safety concerns. Critical reviews in Food Science and Nutrition, 57 (3), 524-548.
- Colours Additives for Foods and Beverages, Ed. by M. J. Scotter, Woodhead Publishing, 2015.
- Review the toxicology of a number of dyes illegally present in food in the EU, (2005) The EFSA Journal, 263, 1-71.